A view of PKS 2155-304 with XMM-Newton Reflection Grating Spectrometers
Abstract
We present the high resolution X-ray spectrum of the BL Lac object PKS 2155-304 taken with the RGS units onboard XMM-Newton in November 2000. We detect a O vii K resonant absorption line from warm/hot local gas at 21.59 Å ( detection). The line profile is possibly double peaked. We do not confirm the strong 20.02 Å absorption line seen with Chandra and interpreted as Oviii K. A upper limit of 14 mÅ on the equivalent width is set. We also detect the Å interstellar Oi 1s2p line and derive a factor subsolar O/H ratio in the ISM along PKS 2155-304 line of sight.
Subject headings:
BL Lacertae objects: individual (PKS 2155-304) — intergalactic medium — large-scale structure of universe — quasars: absorption lines1. Introduction
The observed baryon density at (e.g. Rauch, 1998; Weinberg, Miralda-Escude, Hernquist, & Katz, 1997) agrees well with Standard Big-Bang nucleosynthesis predictions, when combined with observed light-element ratios (Burles & Tytler, 1998). At lower redshift, however, less than of the baryons observed at have been detected so far (Fukugita, Hogan, & Peebles, 1998). According to simulations for the formation of structures in the Universe, most of such baryons would be located, at the present epoch, in low density intergalactic gas, which has been shock-heated to temperatures of K (i.e. the warm-hot intergalactic medium WHIM, e.g. Hellsten, Gnedin, & Miralda-Escudé, 1998). The most efficient way to detect the presence of WHIM is through resonant absorption lines from highly ionized metals (e.g. Ovi, Ovii, Oviii, Ne ix) imprinted in the far UV (FUV) and soft X-ray spectra of background sources (Aldcroft, Elvis, McDowell, & Fiore, 1994; Mulchaey, Mushotzky, Burstein, & Davis, 1996; Hellsten, Gnedin, & Miralda-Escudé, 1998; Perna & Loeb, 1998; Fang & Canizares, 2000). However, severe instrumental limitations have hampered so far the detection of conspicuous amount of WHIM. The Far Ultraviolet Spectroscopic Explorer (FUSE) allows the OVI doublet ( and Å) to be detected only up to z. More importantly OVI dominates the relative abundance distribution of O in shock-heated gas in pure collisional ionization equilibrium, only at relatively low temperatures, K, and so it tracks just the low-temperature tail of the WHIM distribution (e.g. Fang & Canizares, 2000). Soft X-rays are far more promising. The strongest resonant transitions from Ovii, Neix (both helium-like ions, and therefore highly stable) and Oviii, all fall in the soft X-ray band. These ions dominate the O and Ne relative abundance distributions of both collisionaly ionized gas, and mixed, photoionized and collisionaly ionized gas, over a broad range of temperatures, between K and K, where the WHIM distribution peaks (Davé et al., 2001; Fang & Canizares, 2000). The major fraction of the WHIM should then be visible in the X-rays. However, despite the large relative abundances of “X-ray” ions in the WHIM, the current sensitivity and resolution of X-ray spectrometers has allowed so far only the strongest (EW mÅ) of these systems to be detected, and only against spectra of very bright background sources (Nicastro et al. 2002; Mathur, Weimberg & Chen 2003; Fang et al. 2002; Fang, Weimberg & Canizares 2003; with Chandra and Rasmussen, Kahn & Paerels 2003 with XMM-Newton; for a recent review see Paerels & Kahn 2003).
Three out of these six detections have been made against the spectrum of the bright ( erg cm-2 s-1), nearby (Falomo, Pesce, & Treves, 1993, z=0.116), blazar PKS 2155-304 (Nicastro et al., 2002; Fang et al., 2002). A high quality ( counts per resolution element at the relevant wavelengths) Chandra (HRCS/LETG) observation of PKS 2155-304, revealed the existence of Ovii, Oviii and Neix absorption lines at , identified with a WHIM system, pervading our Local Group (Nicastro et al., 2002). Lower quality Chandra (ACIS/LETG) spectra of PKS 2155-304 confirmed the above findings (Fang et al., 2002), and also show a line at 20.02 Å, that Fang et al. (2002) identify as the Oviii WHIM counterpart of a known Ly and Ovi system at , where a concentration of galaxies is seen (Maraschi et al., 1988; Shull et al., 1998; Shull, Tumlinson & Giroux, 2003, and references therein). However it is not clear why such a feature is not detected in the higher quality HRCS/LETG spectrum published by Nicastro et al. (2002). Additional data are needed to clarify this issue.
In this paper we present the analysis of the high resolution XMM-Newton Reflection Grating Spectrometers (RGS hereinafter) spectra of PKS 2155-304.
The structure of the paper is as follows:
in § 2 we report on the RGS data reduction and analysis.
The spectral fitting and comparison with previous measurements is given in
§ 3.
The discussion of the detected features is presented in § 4.
2. Observations and data reduction
PKS 2155-304 was observed by XMM-Newton in revolution 174 (Nov 19-21, 2000) in two short and two long pointings described in Table 1. XMM-Newton is equipped with three coaligned X-ray telescopes and provides images over a field of view with moderate spectral resolution using the European Photon Imaging Camera (EPIC), which consists of two MOS and one PN CCD arrays. High-resolution spectral information is provided by the Reflection Grating Spectrometers (RGS-1 and RGS-2) that deflect half of the beam of two of the three X-ray telescopes. Due to a failure in the read-out electronics of two RGS CCDs (CCD 4 in RGS-2 and CCD 7 in RGS-1) the total effective area is reduced by a factor 2 in the wavelength bands originally covered by these CCDs (10.5–14.0 Å and 20.1–23.9 Å). The observatory also has a coaligned 30 cm optical/UV telescope, i.e. the Optical Monitor (OM). In this paper we concentrate on the RGS spectra of PKS 2155-304 ( from 100 to 500, FWHM, in the energy range 0.33–2.5 keV - 5–38 Å), the first and second order spectra of which are clearly visible in both RGS. EPIC and OM data are discussed in Maraschi et al (2002) and Maraschi et al. (2003, in preparation).
We reprocessed the data using the Science Analysis System (SAS) software version 5.3.0 and the calibration files as of May 31st 2002. Since the wavelength calibration of XMM grating spectra depends strongly on the position of the 0th order, we used the VLBI position as centroid of the 0th order source (Ma et al., 1998). Extraction regions, for source and background, were chosen to be, respectively, within the 95% and outside the 98% of the PSF. Since XMM-RGS observations can be affected by high particle background periods caused by solar activity, we extracted RGS1 and RGS2 background lightcurves from CCD-9, the closest to the optical axis of the telescope and therefore the most affected by background flares. We excluded all the time intervals for which the background count rate was higher than count s-1 and report the net exposures in Table 1. Note that the short observation at the end of the run (Obs. Id. 0080940501) is completely affected by background flares and will not be further considered in this paper, which discusses the first three observations only. For each observation and for each RGS unit we extracted first and second order source and the background spectra, for a total of 12 spectra, but since second order spectra have a significantly lower number of photons, we will concentrate on first order only.
3. Spectral Fitting
We modeled the continuum of each RGS-1 and RGS-2 observation of PKS 2155-304 in the energy range 0.35 – 2.0 keV using version 11.2.0 of XSPEC. We adopted an absorbed power law model of the form
where f() is a normalization factor at keV, is the photon index and the photoelectric absorption is characterized by a column density N(X) and an absorption cross section for each element (Morrison & McCammon, 1983). The Galactic hydrogen column density is fixed at cm-2 (Lockman & Savage, 1995). The best fit slopes and the source fluxes during the observations are reported in Table 2. Errors in the paper represent confidence levels unless stated otherwise. We note a small systematic difference between RGS-1 and RGS-2, with RGS-1 measuring steeper slopes () and (%) higher fluxes compared to RGS-2. Table 2 shows that PKS 2155-304 emission steepens when the source gets fainter, a well known behavior for this source (e.g. Zhang et al., 2002).
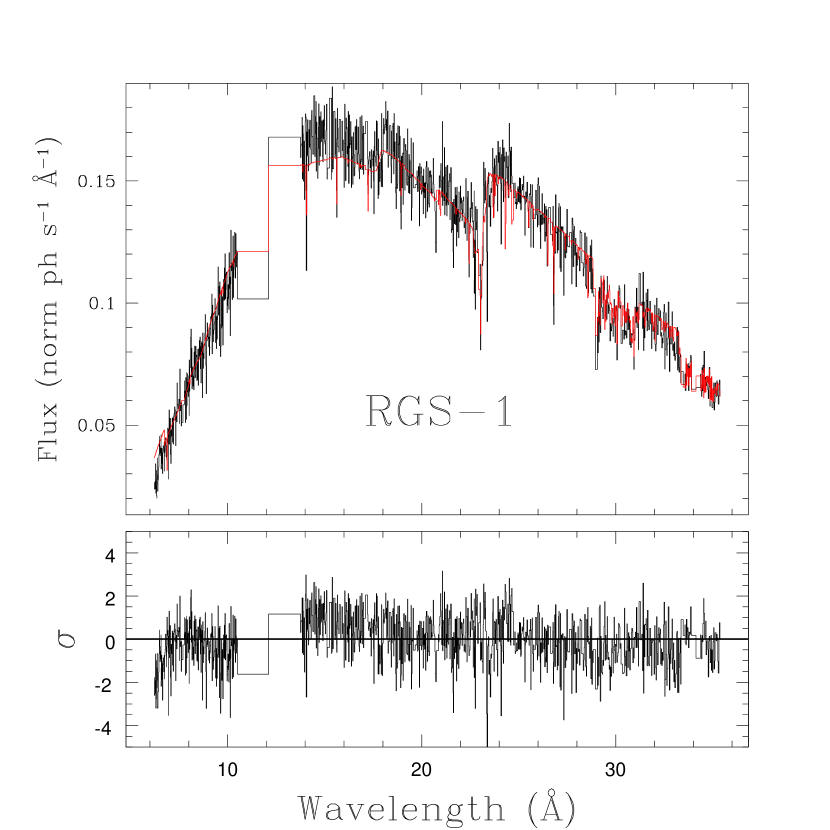
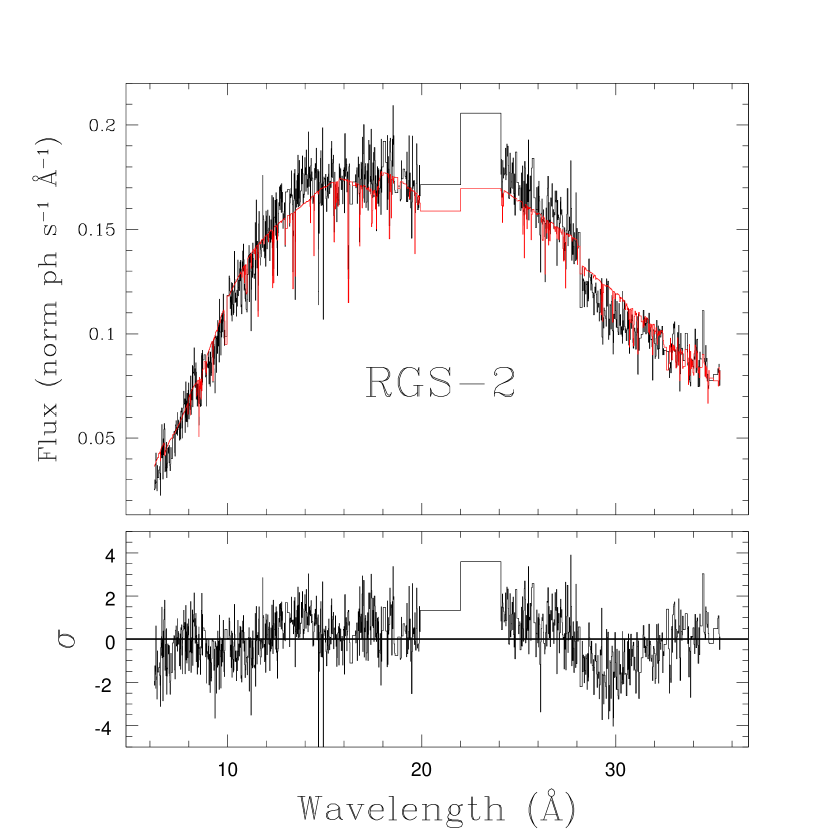
In order to improve the signal to noise ratio (SNR) we performed a simultaneous fit of the three datasets forcing the slope to be the same in the three observations, but leaving the normalization free to vary. For display purposes we combined all the three first order RGS-1 spectra together and did the same for the RGS-2 (Fig.1).
3.1. RGS Instrumental Features
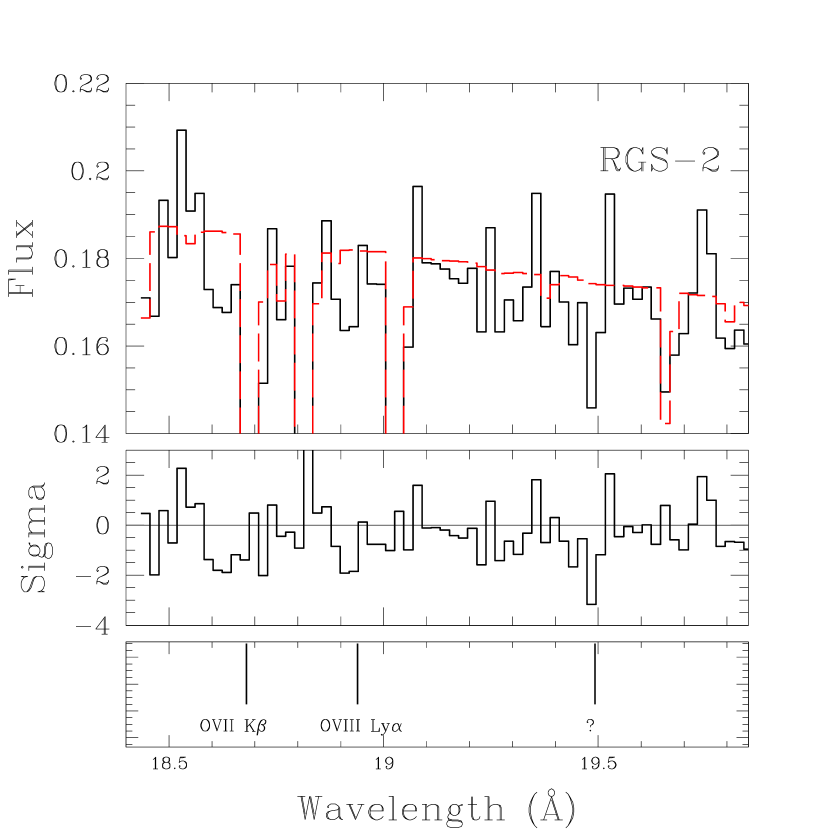
The RGS effective areas (see Fig. 2) are complex in shape, and contain tens of narrow dips due to bad columns or pixels in the CCD detectors. The exact shape of these instrumental features in observed spectra depends on the grating Line Spread Function (LSF), which is particularly broad for reflection-gratings, due to electron scattering of dispersed photons (i.e. mÅ FWHM Pollock, 2003, , Figure 1). Modeling of such narrow instrumental features in the XMM-Newton RGS requires, then, very accurate calibration measurements. Current RGS effective area calibration uncertainties are as accurate as % between 7 and 36 Å (den Herder, 2002). As a consequence, residual narrow instrumental features with such relative intensities, are expected in the unfolded RGS spectra (both in absorption and emission). These are indeed observed in both RGS-1 and RGS-2 spectra of PKS 2155-304 (Fig.1) and greatly hamper the detection and proper identification of real physical bound-bound electronic transitions from abundant metals in astrophysical gaseous environments. However, in the wavelength range we are interested in, these problems differently affect the RGS-1 and RGS-2. Particularly, at redshifts between us and PKS 2155-304, all the strong resonant absorption lines from neutral and/or highly ionized O and Ne, fall in wavelength ranges (i.e. 13-14 Å, 18-20 Å, 20-24 Å) where RGS-2 spectra either do not exist (20-24 Å, due to the failure of a CCD chip) or contain strong line-like shaped instrumental features (Fig.1). RGS-1 spectra are, on the other hand, relatively instrumental-feature-free in the relevant oxygen wavelength ranges (Fig.2). In the following, we present our analysis of the RGS-1 spectra of PKS 2155-304, and use the RGS-2 spectra only for comparison.
3.2. The combined spectra
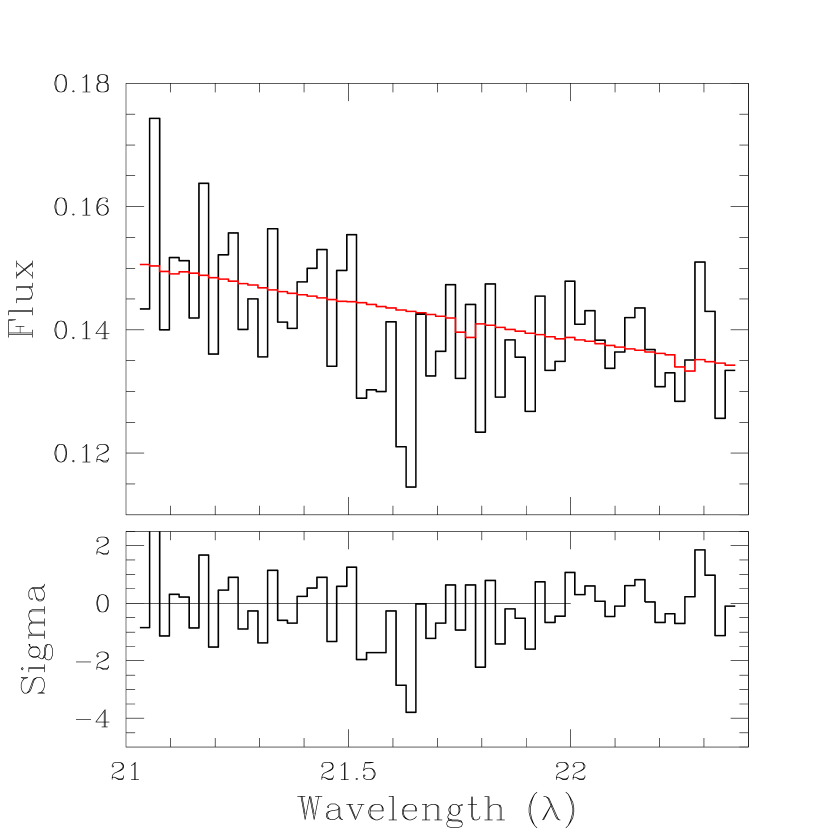
We modeled the RGS-1 and RGS-2 continuum of PKS 2155-304 from the summed spectra in the energy range 0.35 – 2.0 keV with the same absorbed power law model described above and the results are reported in Table 2.
Figure 1 shows the best fit to the PKS 2155-304 spectra (binned over two channels) and the residuals. Clearly visible in the residuals of RGS-1 spectrum is the O-edge at Å and the Ovii K at 21.6 Å. The RGS-2 residuals, show instead a pronounced dip around Å and a deviation from a power law below 14 Å. All these features, but the 21.6 Å line, are also present in the calibration spectrum presented in den Herder (2002) RGS calibration report and are due to an imperfect knowledge of the effective area.
To determine the line parameters we prefer the simultaneous fit of the three data sets because we can promptly see false absorptions caused by flickering hot pixels/columns in an observation which appear normal in the other observations, and can remove the problematic data set from the fitting procedure (e.g. Ovii K, see Table 3).
3.3. Lines
To better model the underlying continuum in the proximity of absorption/emission features, we did not adopt the broad band absorbed power law results presented above, but we divided the RGS-1 and RGS-2 spectra into Å wavelength bins and performed a simultaneous fit with a local absorbed power law. In the following sections we will discuss the features with significance .
3.3.1 The shift
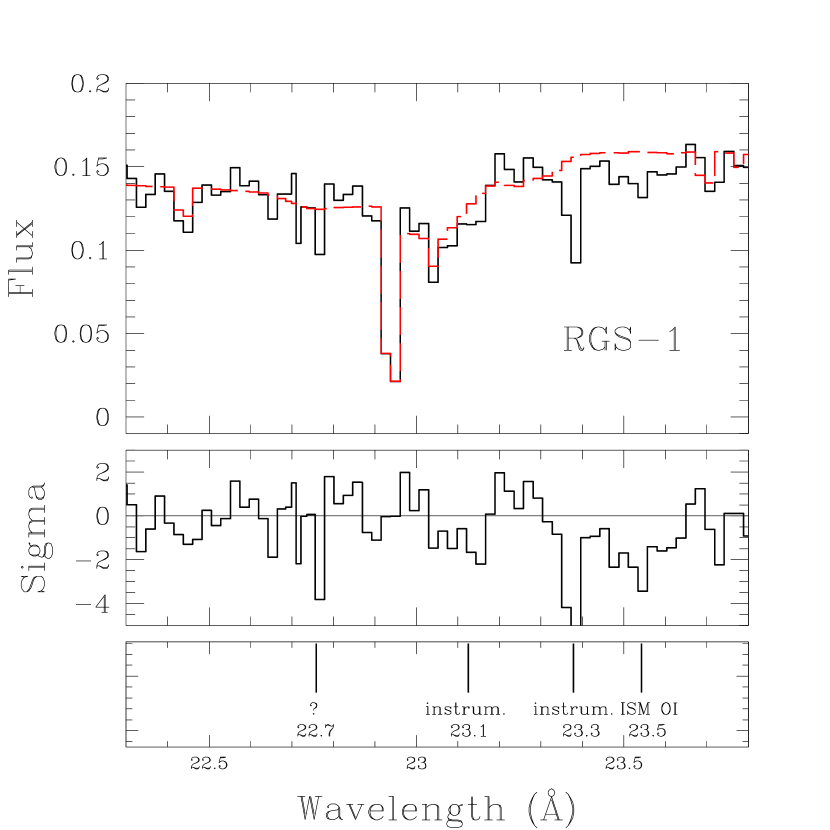
To determine the absolute line position in RGS-1 we used the 23.5 Å interstellar Oi 1s2p line (McLaughlin & Kirby, 1998; de Vries et al., 2003, see § 3.3.3). The RGS-1 line position is Å. This is shifted by (a) mÅ with respect to the laboratory value of 23.489 Å measured by Krause (1994), by (b) mÅ with respect to the position measured in the Chandra LETG spectrum of the low-mass X-ray binary X0614+091 by Paerels et al. (2001) and by (c) mÅ with respect to the Chandra position along PKS 2155-304 line of sight by (Nicastro et al., 2002). A similar shift ( mÅ) is present in the 23.3 Å molecular oxygen instrumental feature (see § 3.3.2) when compared to the Chandra position by (Nicastro et al., 2002). The systematic rigid redshift of the wavelength scale in the RGS-1 spectrum of PKS 2155-304 is larger than both the calibration uncertainty of 8 mÅ ( den Herder et al., 2001) and the intrinsic mÅ uncertainty in the line centroid measurement. For consistency with the Chandra measurements, we then decided to apply a constant shift of mÅ to all the RGS-1 line positions reported in this paper. The RGS-2 correction factor is more difficult to estimate because the 23.5 Å feature falls on the failed RGS-2 CCD 4.
3.3.2 Instrumental lines
The two lines at 23.07 Å and at 23.35 Å (Fig. 3) are likely to be broadened and shifted instrumental molecular oxygen lines (de Vries et al., 2003). The 23.35 Å line is also present in Chandra spectra, while the 23.07 Å line is a XMM-Newton feature. These lines are also present in the XMM-Newton spectrum Sco X-1 XMM-Newton (de Vries et al., 2003) and they are interpreted as instrumental shifted and broadened 1s2p lines of bound oxygen. Since XMM-Newton detectors do not contain atomic oxygen in their structure, these lines are probably caused by oxides (SiO2, Al2O3 and the hygroscopic MgFe2 den Herder, 2002, see de Vries et al. 2003 for a detailed discussion on these features).
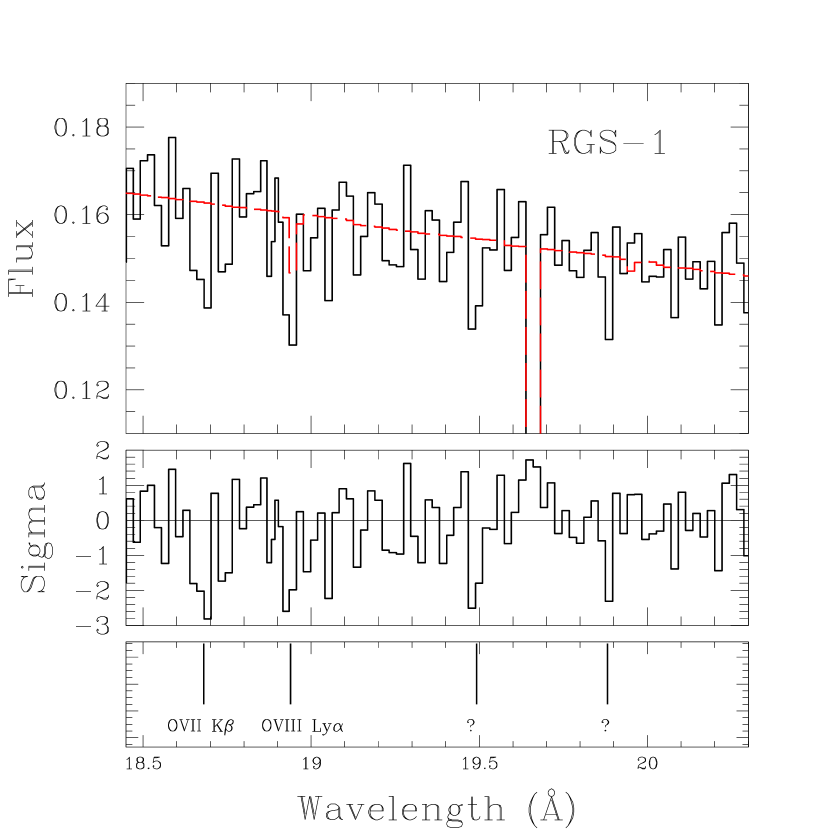
We note that an absorption feature appears in the RGS-1 and in the RGS-2 spectra at 19.5 Å (Fig. 4) with significance of 2.3 and 2.5 respectively and an EW of mÅ ( eV). The same line is not present in the Chandra spectra of PKS 2155-304 (Nicastro et al., 2002; Fang et al., 2002) but it is visible in the XMM-Newton spectrum of MRK 421 (Cagnoni, 2002) and therefore it is likely to have an instrumental origin.
3.3.3 Lines of astrophysical interest
The lines of astrophysical interest are reported in Table 3. One of the strongest lines in our spectrum is the Ovii K line at 21.6 Å (Figure 5 and Table 3). The Ovii K profile shows two peaks at 21.5 and 21.6 Å. The wavelength separation between the peaks is Å, larger than the resolution limit at this wavelength ( Å de Vries et al., 2003), and corresponds to km s-1. However we note that the significance of the splitting is statistically low, in the sense that no improvement of the fit with two Gaussian is found. Moreover note that the quoted velocity is more than a factor of three higher than the highest velocities observed by FUSE for the Ovi clouds (e.g. Nicastro et al., 2003; Sembach et al., 2003).
The corresponding Ovii K, is visible in RGS-1 at Å (Fig. 4 left) but it overlaps with an effective area feature in RGS-2 (Fig. 4 right). Since a double-peaked profile is not detected for this line, the double peak appearance of the Ovii K profile could be due to a positive fluctuation within the line, consistently with the arguments given above.
The EW of the Ovii K ( mÅ or eV) is consistent with the values presented in Nicastro et al. (2002) ( eV) using Chandra and in Rasmussen, Kahn, & Paerels (2003) ( mÅ) using a coaddition of XMM-Newton calibration observations for a total of 265 ks. As derived from the curve of growth presented in Fig. 4 of Nicastro et al. (2002), the Ovii K EW is compatible with an unsaturated line. To check if any effective area feature could be present in the positions of the Ovii lines, we extracted the RGS-1 spectra of the Crab nebula and of another BL Lac object: H 1426428. No Ovii K is detected in the 46 ks long observation of the BL Lac; but a % feature at 18.65 Å is visible. Similarly the Crab spectrum shows a % drop in the same region. Therefore the Ovii K, detected in RGS-1 at Å (see Figure 4, left panel), is likely to be affected by the presence of this effective area drop. Since we cannot correct for this effective area feature, the line EW reported in Tab. 3 is to be considered as an upper limit only. The EW ratio of Ovii K and K limit is , consistent with Nicastro et al. (2002) value of , and with the oscillator strength ratio of 4.77.
We do not detect any Oviii Ly at 18.97 Å. Fixing the line width to the value obtained for Ovii K, we find a 3 upper limit of 12.61 mÅ for the line EW (Tab. 3). We note however that the 3 upper limit corresponds to a Oviii Ly normalization 11% of the power-law value, comparable to the depth of a nearby (18.92 Å) effective area drop.
At the redshift of the intervening concentration of galaxies () we do not confirm the strong Oviii K present in PKS 2155-304 Chandra spectrum of Fang et al. (2002) but not present in Nicastro et al. (2002) nor in Rasmussen, Kahn, & Paerels (2003). The 20.02 Å line EW in Fang et al. (2002) is mÅ, comparable to the 21.6 Å Ovii K EW and to the 18.6 Å Ovii K in this spectrum. Since we detect the Ovii K (with EW consistent with Fang et al., 2002), the lack of detection of the 20.02 Å feature is unlikely to be the result of insufficient statistics in our continuum. An upper limit can be set on the equivalent width of a putative absorption line at 20.02 Å of 14.0 mÅ, at 3 confidence level, i.e. the value observed by Fang et al. (2002).
It is not possible to determine if any Neix absorption is present because RGS-2 only is active in this wavelength range and it presents a % drop in the effective area at Å. We detect at 1.4 at Å with EW of mÅ the 22.77 Å line already seen in PKS 2155-304 and also in MRK 421 RGS spectra by de Vries et al. (2003). The best fit parameters to the 23.5 Å interstellar Oi 1s2p line, discussed in § 3.3.1, are reported in Table 3.
4. Discussion
At we confirm the existence of a Ovii K absorption feature, but we do not detect features of higher ionization elements (Oviii, Neix and Nex) seen by Chandra (Nicastro et al., 2002). This lack of detection is likely to be related to the limited number of photons (e.g. photons between 19.5 and 20.5 Å, i.e. photons per 0.0065 Å resolution element) collected in the XMM-Newton observation, when the source was times fainter than in Nicastro et al. (2002). The Ovii K appears to be unsaturated and the curve of growth presented in (Nicastro et al., 2002) suggests an Ovii column density of cm-2. If the weak evidence of a double peak in the profile of the Ovii K line is considered real, such shape may indicate that we are starting to detect the different sheets of the local filament.
The upper limit on the Oviii Ly line EW, computed fixing the line FWHM to the Ovii K FWHM value, is mÅ, consistent with the value of mÅ found by Rasmussen, Kahn, & Paerels (2003) in the RGS spectrum of PKS 2155-304. Under the assumption of unsaturated lines the EW ratios between different ions of the same element depend on the gas temperature and density. Using the ratio between the upper limit on the EW of O viii Ly to the Ovii K (best fit value ), we obtain an upper limit on the gas temperature of K, for a gas density of - 1 atom cm-3 (see Fig. 5 in Nicastro et al., 2002). These values are consistent with the temperature range predicted for the WHIM.
It is not possible to discriminate with the present data whether the Ovii features are produced by a WHIM, as proposed by Nicastro et al. (2002) or by radiatively cooling gas within our Galaxy, as proposes by Heckman et al. (2002). In the FUSE spectrum of PKS 2155-304 Nicastro et al. (2002) found two unsaturated Ovi absorption lines: a narrow component (FWHM = km s-1) at km s-1 with EW = eV, probably related to a cloud in the Galactic disk, and a broad component (FWHM = km s-1) at km s-1 with EW = eV possibly associated with a WHIM filament. Using our Ovii K EW and the EW of the Ovi broad component from Nicastro et al. (2002) we derive a temperature range of K for a gas density of cm-3, which restricts to K once the upper limit from the Oviii is considered. We note, however, that the Ovii absorption features at local redshift have been found in the spectra of other 4 AGNs (3C 273 Fang, Sembach & Canizares (2003); MRK 421 Nicastro et al. (2001); Cagnoni (2002); NGC 4593 McKernan et al. (2003) and NGC 3783 Kaspi et al. (2002)) and might be associated to the high velocity Ovi lines (sampling a gas at K) recently seen in the spectra of bright AGNs by FUSE (Sembach et al., 2003; Nicastro et al., 2003). If this is the case, the “local” Ovii K would indicate the presence of WHIM within the Local Group (Nicastro et al., 2003).
The line at 23.5 Å is the interstellar Oi 1s2p transition (e.g. McLaughlin & Kirby, 1998, and references therein). Assuming a neutral ISM gas, no consistent velocity broadening and unsaturated lines, the comparison of the measured EW with the curve of growth derived using Stolte et al. (1997) cross sections implies O atoms cm-2. The H absorbing column density in PKS 2155-304 direction is cm-2 (Lockman & Savage, 1995), which brings to a O/H ratio of . This value is times smaller than in the Solar system ( Anders & Grevesse, 1989), but consistent with the ISM elemental abundances in the Magellanic Clouds (e.g. Russell & Dopita, 1990). Assuming that the line EW is enhanced by velocity broadening would further decrease the O/H ratio. If we adopt the theoretical cross-sections of (McLaughlin & Kirby, 1998), as in de Vries et al. (2003, (see their Fig. 3)), we derive O atoms cm-2, i.e. a O/H ratio of , still times lower than the Solar value. We note that de Vries et al. (2003) Oi 1s2p EW in PKS 2155-304 direction, derived from a coaddition of RGS observations for a total of 346 ks, is mÅ consistent with our measurement ( mÅ) and the line curve of growth presented in the paper takes saturation effects into account, but still there is indication of a subsolar O/H ratio.
We do not confirm the Oviii K line by Fang et al. (2002). Note that the lack of detection of WHIM outside our Local Group is consistent with the expectations of theoretical models. In fact only one Oviii absorption line with EW mÅ (i.e. detectable by the present X-ray satellites) in the spectrum of a random background source at is predicted (e.g. Hellsten, Gnedin, & Miralda-Escudé, 1998). The non-detection of WHIM up to therefore does not pose any problem.
Our XMM-Newton PKS 2155-304 spectrum shows a hint ( detection; EW mÅ) of a 22.7 Å feature, seen by de Vries et al. (2003) in the XMM-Newton spectra of PKS 2155-304 and MRK 421, and in the Chandra spectrum of PKS 2155-304. Since they do not find evidence of such line in the XMM-Newton spectra of Sco X-1 and 4U 0614091, they exclude a possible instrumental origin of the line and tentatively identify it with Oiv absorption from a local WHIM filament. Higher statistics and other time spaced observations are needed to investigate the reality of the 22.7 Å absorption feature.
References
- Aldcroft, Elvis, McDowell, & Fiore (1994) Aldcroft, T., Elvis, M., McDowell, J., & Fiore, F. 1994, ApJ, 437, 584
- Anders & Grevesse (1989) Anders, E. & Grevesse, N., 1989, Geochim. Cosmochim. Acta, 53, 197
- Burles & Tytler (1998) Burles, S. & Tytler, D. 1998, ApJ, 499, 699
- Canizares & Kruper (1984) Canizares, C. R. & Kruper, J. 1984, ApJ, 278, L99
- Cagnoni (2002) Cagnoni, I, 2002, submitted to ApJL (astro-ph/0212070)
- Davé et al. (2001) Davé, R. et al. 2001, ApJ, 552, 473
- den Herder et al. (2001) den Herder, J. W. et al. 2001, A&A, 365, L7
- den Herder (2002) den Herder, J. W., 2002, RGS calibration report RGS-SRON-RP-CAL-01/006 (http://xmm.vilspa.esa.es/docs/documents/CAL-SRN-0017-1-0.ps.gz)
- de Vries et al. (2003) de Vries, C. P., den Herder, J. W., Kaastra, J. S., Paerels, F. B., den Boggende, A. J., & Rasmussen, A. P. 2003, A&A, 404, 959
- Dickey & Lockman (1990) Dickey, J. M. & Lockman, F. J. 1990, ARA&A, 28, 215
- Falomo, Pesce, & Treves (1993) Falomo, R., Pesce, J. E., & Treves, A. 1993, ApJ, 411, L63
- Fang & Canizares (2000) Fang, T. & Canizares, C. R. 2000, ApJ, 539, 532
- Fang et al. (2002) Fang, T., Marshall, H. L., Lee, J. C., Davis, D. S., & Canizares, C. R. 2002, ApJ, 572, L127
- Fang, Sembach & Canizares (2003) Fang, T., Sembach, K. R., & Canizares, C. R. 2003, ApJ, 586, L49
- Fruscione, Bowyer, Konigl, & Kahn (1994) Fruscione, A., Bowyer, S., Konigl, A., & Kahn, S. M. 1994, ApJ, 422, L55
- Fukugita, Hogan, & Peebles (1998) Fukugita, M., Hogan, C. J., & Peebles, P. J. E. 1998, ApJ, 503, 518
- Giommi et al. (1998) Giommi, P. et al. 1998, A&A, 333, L5
- Heckman et al. (2002) Heckman, T. M., Norman, C. A., Strickland, D. K., & Sembach, K. R. 2002, ApJ, 577, 691
- Hellsten, Gnedin, & Miralda-Escudé (1998) Hellsten, U., Gnedin, N. Y., & Miralda-Escudé, J. 1998, ApJ, 509, 56
- Kashyap & Drake (2000) Kashyap, V. & Drake, J. J., 2000, Bull. Astron. Soc. India, 28, 475
- Kaspi et al. (2002) Kaspi, S. et al. 2002, ApJ, 574, 643
- Koenigl et al. (1995) Koenigl, A., Kartje, J. F., Bowyer, S., Kahn, S. M., & Hwang, C. 1995, ApJ, 446, 598
- Krause (1994) Krause, M. O., 1994, Nucl. Instrum. Methods Phys. Res., 87, 178
- Lockman & Savage (1995) Lockman, F. J. & Savage, B. D. 1995, ApJS, 97, 1
- Ma et al. (1998) Ma, C. et al. 1998, AJ, 116, 516
- Madejski et al. (1991) Madejski, G. M., Mushotzky, R. F., Weaver, K. A., Arnaud, K. A., & Urry, C. M. 1991, ApJ, 370, 198
- Maraschi et al. (1988) Maraschi, L., Calanchi, C., Treves, A., Blades, J. C., & Tanzi, E. G. 1988, ApJ, 333, 660
- Maraschi et al (2002) Maraschi, L. et al. 2002, Proceedings of the Symposium ’New Visions of the X-ray Universe in the XMM-Newton and Chandra Era’, ESTEC 2001, astro-ph/0202418
- Mathur, Weimberg & Chen (2002) Mathur, S., Weinberg, D. H., & Chen, X. 2003, ApJ, 582, 82
- McKernan et al. (2003) McKernan, B., Yaqoob, T., George, I. M., & Turner, T. J. 2003, ApJ, 593, 142
- McLaughlin & Kirby (1998) McLaughlin, B. M. & Kirby, K. P., 1998, J. Phys. B: At. Mol. Opt. Phys., 31, 4991
- Morrison & McCammon (1983) Morrison, R. & McCammon, D. 1983, ApJ, 270, 119
- Mulchaey, Mushotzky, Burstein, & Davis (1996) Mulchaey, J. S., Mushotzky, R. F., Burstein, D., & Davis, D. S. 1996, ApJ, 456, L5
- Nicastro, Fiore, Perola, & Elvis (1999) Nicastro, F., Fiore, F., Perola, G. C., & Elvis, M. 1999, ApJ, 512, 184
- Nicastro et al. (2001) Nicastro, F., Fruscione, A., Elvis, M., Siemiginowska, A., Fiore, F., & Bianchi, S. 2001, ASP Conf. Ser. 234: X-ray Astronomy 2000, 511
- Nicastro et al. (2002) Nicastro, F. et al. 2002, ApJ, 573, 157
- Nicastro et al. (2003) Nicastro, F. et al. 2003, Nature, 421, 719
- Paerels et al. (2001) Paerels, F. et al. 2001, ApJ, 546, 338
- Paerels & Kahn (2003) Paerels, F. B. S. & Kahn, S. M. 2003, ARA&A, 41, 291
- Perna & Loeb (1998) Perna, R. & Loeb, A. 1998, ApJ, 503, L135
- Pollock (2003) Pollock, A. M. T. RGS calibration report XMM-SOC-CAL-TN-0030 (http://xmm.vilspa.esa.es/docs/documents/CAL-TN-0030-2-0.ps.gz
- Rasmussen, Kahn, & Paerels (2003) Rasmussen, A., Kahn, S. M., & Paerels, F. 2003, ASSL Vol. 281, 109: The IGM/Galaxy Connection. The Distribution of Baryons at z=0
- Rauch (1998) Rauch, M. 1998, ARA&A, 36, 267
- Rumph, Bowyer, & Vennes (1994) Rumph, T., Bowyer, S., & Vennes, S. 1994, AJ, 107, 2108
- Russell & Dopita (1990) Russell, S. C. & Dopita, M. A. 1990, ApJS, 74, 93
- Sembach et al. (2003) Sembach, K. R. et al. 2003, ApJS, 146, 165
- Shull et al. (1998) Shull, J. M., Penton, S. V., Stocke, J. T., Giroux, M. L., van Gorkom, J. H., Lee, Y. H., & Carilli, C. 1998, AJ, 116, 2094
- Shull, Tumlinson & Giroux (2003) Shull, J. M., Tumlinson, J., & Giroux, M. L. 2003, ApJ, 594, L107
- Stolte et al. (1997) Stolte, W. C., Samson, J. A. R., Hemmers, O., Hansen, D., Whitfield, S. B. & Lindle, D. W., 1997, J. Phys. B.: At. Mol. Pot. Phys., 30, 4489
- Tripp, Savage, & Jenkins (2000) Tripp, T. M., Savage, B. D., & Jenkins, E. B. 2000, ApJ, 534, L1
- Weinberg, Miralda-Escude, Hernquist, & Katz (1997) Weinberg, D. H., Miralda-Escude, J., Hernquist, L., & Katz, N. 1997, ApJ, 490, 564
- Zhang et al. (2002) Zhang, Y. H. et al. 2002, ApJ, 572, 762


| Obs. Id. | Startaadays of November 2000, time is Terrestrial Time. RGS 1 and RGS 2 were operated simultaneously and have start and stop time differing of few seconds only. | Stopaadays of November 2000, time is Terrestrial Time. RGS 1 and RGS 2 were operated simultaneously and have start and stop time differing of few seconds only. | Total ExposurebbTotal RGS on time in ks. | Net ExposureccIn ks after the high particle background times rejection. |
|---|---|---|---|---|
| 0080940401 | 19, 15:36:56 | 19, 18:30:22 | 10 | 9 |
| 0080940101 | 19, 18:38:20 | 20, 11:26:51 | 60 | 58 |
| 0080940301 | 20, 12:53:01 | 21, 05:56:27 | 61 | 44 |
| 0080940501 | 21, 05:58:37 | 21, 07:28:45 | 5 | 0 |
| Obs. Id. | RGS 1 | RGS 2 | ||||
|---|---|---|---|---|---|---|
| Norm. aaat 1 keV in units of ph cm-2 s-1 keV-1 | Flux bbIn units of erg cm-2 s-1 | Norm. aaat 1 keV in units of ph cm-2 s-1 keV-1 | Flux bbIn units of erg cm-2 s-1 | |||
| (0.5-2.0 keV) | (0.5-2.0 keV) | |||||
| 0080940401 | ||||||
| 0080940101 | ||||||
| 0080940301 | ||||||
| Total | ||||||
| Line ID | aaNote that we applied a mÅ shift to RGS-1 wavelength calibration in order to match Nicastro et al. (2002) position for the interstellar Oi 1s2p line. | FWHM | EWbbThe EW is computed as the mean of the EW of the line in the three spectra as a result of a simultaneous fit. The errors are computed as the mean of the three values obtained allowing the line and the power laws normalization to vary within their 1 limits | ||
|---|---|---|---|---|---|
| (Å) | (km s-1) | ( Å) | (mÅ) | ||
| Ovii Kc,dc,dfootnotemark: | 3.7 | ||||
| Oviii LyeeThe line position and line width are fixed to the expected value and to the Ovii K value respectively. The EW corresponds to the 3 upper limit. | 0.7 | ||||
| Ovii K | 4.5 | ||||
| molecular Oi | – | 2.2 | |||
| molecular OiccResults obtained excluding the first observation (ID 0080940401) because of the presence of an effective area feature on the line position. | 5.5 | ||||
| Oi K | 4.6 | ||||
| Oviii KffThe line position and the line width are fixed to the value and to the 90% upper limit in Fang et al. (2002) respectively. | 20.02 | 16624 | 6.49 | 0.4 |