Multiwavelength scaling relations for nuclei of Seyfert galaxies††thanks: Partly based on observations collected at the European Southern Observatory, La Silla, Chile and at Calar Alto, Spain.
Abstract
We analyze an X-ray flux-limited, complete sample of 93 AGN at z0.1, selected from the ROSAT Bright Survey. Two thirds of the sample are Seyfert 1 galaxies (Sy1) and one third are Narrow-Line Seyfert 1 galaxies (NLSy1). We have obtained optical images of all objects. By modeling the host galaxy and the AGN central component we decompose the optical emission into nuclear, bulge and disk components, respectively. We find that the nuclear optical luminosity, thought to be associated with the accretion disk surrounding the active black hole, correlates with the X-ray luminosity, the radio luminosity and the black hole mass.
Subject headings:
galaxies: Seyfert — galaxies: nuclei — x-rays: galaxies1. Introduction
The last few years have brought fundamental progress in understanding the suspected connection between active galactic nuclei (AGN), characterized by non-thermal emission from a massive ( M⊙) black hole (BH), and normal galaxies, whose extended emission is thermal. In particular, now 1) there is robust evidence that quasars reside in galaxies (Bahcall et al. 1997); 2) it is established that massive “quiescent” BHs are also present in the central regions of normal galaxies (Magorrian et al. 1998); 3) a statistical correlation between BH mass and mass or velocity dispersion of the host galaxy’s bulge exists (Gebhardt et al. 2000; Ferrarese & Merritt 2000), which suggests a common evolution for galaxies and their central, massive BHs; 4) the previous correlations hold for normal as well as AGN-host galaxies (McLure & Dunlop 2002).
For AGN with typical masses of M⊙, the bulk of the accretion radiation is emitted in the soft X-ray and EUV/UV range. A fraction of this optically thick radiation is Compton-upscattered by a corona of electrons surrounding the BH. This process is thought to produce the typical power law X-ray spectra observed in all AGN. The primary soft X-ray/EUV radiation of the accretion disk also ionizes the surrounding gas, producing the well-known AGN emission lines. At radio frequencies, the core luminosity of the AGN is due to synchrotron emission by relativistic electrons immersed in a seemingly global magnetic field. It is conceivable that these electrons are the same which Compton-upscatter the disk photons. It is therefore interesting to ask whether there is a direct correlation between radio, optical and X-ray emission in the central part of the AGN where the accretion disk is located.
While information in the radio and X-ray bands is already available from all-sky surveys like the NRAO VLA Sky Survey (NVSS, Condon et al. 1998), FIRST (Faint Images of the Radio Sky at Twenty centimeters; Becker et al. 1995) and the ROSAT Bright Survey (RBS, Schwope et al. 2000), optical data for the central kiloparsec of AGN are more difficult to obtain. Indeed, in modeling AGN and their host galaxies, the information contained in the central pixels has been usually rejected (see e.g. Virani et al. 2000). With a new well-tested, well-performing and robust fitting algorithm (Kuhlbrodt et al. 2001), it has recently been possible to model both the host galaxy and the nucleus from optical images.
Here we apply this decomposition algorithm to a new sample of objects, and use the results of the decomposition to study the relations between the properties of the central point source, in particular the X-ray ( keV), optical (R band) and radio (1.49 GHz) emission. After presenting the sample selection in §1 and the catalog data in §2, the relations between the different parameters are described in §3, and discussed in §4. Unless specified differently, a value of Ho=50 km Mpc-1s-1 has been used throughout this paper.
2. Construction of the sample
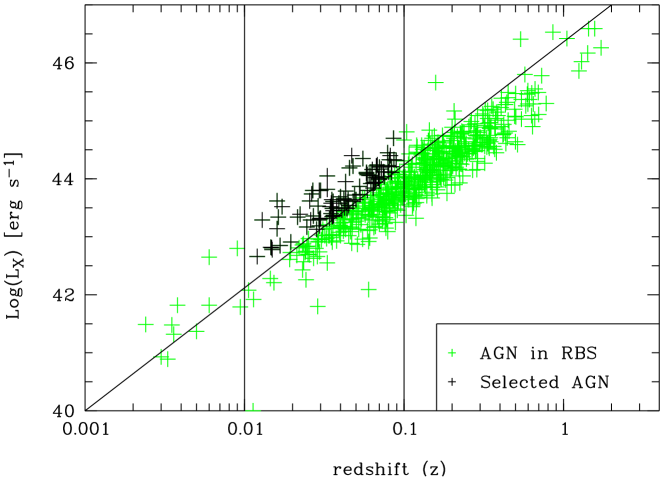
We used the ROSAT Bright Survey (RBS, Schwope et al. 2000), consisting of the 2000 brightest, optically identified sources detected during the ROSAT All Sky Survey (RASS, Voges et al. 1999). Selecting at X-rays has the advantage that the contribution of the emission from the host galaxy is small with respect to the AGN. We selected the strongest (ROSAT PSPC count rate (cr) above 0.3 cts s-1 in the 0.5–2.0 keV range), local (0.009z0.1) AGN in order to achieve reasonable spatial resolution with ground-based optical observations. The sample consists of 93 AGN (black symbols in Fig. 1). At the time when the work started, all of them were classified in NED111 NASA/IPAC Extragalactic Database as Sy1 galaxies, but in the meantime about 30% of them have been found to be NLSy1 (Veron-Cetty & Veron 2001). The size of the sample thus allows us to work with 2 independent, complete samples, Sy1 (64) and NLSy1 (29), with comparable X-ray luminosity. In both cases the observer has a direct view of the AGN, i.e. unobstructed by the torus.
3. Data collection
All optical data was acquired in dedicated observing runs, described
in detail elsewhere (Salvato 2002; Salvato 2003, in preparation). Here
we give only some brief characteristics. In order to explore the
relationship of nuclear luminosities in various wavelengths we
collected data from public catalogs for the X-ray and radio
wavelengths.
Optical data.
The entire sample has been observed in the R band with a typical
exposure time of 10 minutes at the 1.5m Danish telescope (Bessel R
filter) at La Silla and of 20 minutes at the 1.2m telescope (Johnson R
filter) at Calar Alto. We have applied the two-dimensional
decomposition algorithm (Kuhlbrodt et al. 2001) to all images, which
takes into account the point spread function (PSF) of the
corresponding image. A three-component model has been applied,
involving a point-like nuclear component, a bulge component with a
R1/4 radial dependence, and an exponential disk
component. Besides the spatial parameters we therefore obtain
magnitudes of these three components. These derived magnitudes have
been corrected for Galactic absorption, using the maps of Dickey &
Lockman (1990) and converted to the visual extinction as derived by
Predehl & Schmitt (1995). A comparison of our fit parameters (colors,
disk and bulge parameters, etc.) with a sub-sample of galaxies studied
already earlier (e.g. McLure & Dunlop 2001), reveals perfect
agreement (details in Salvato 2002), and thus provides some confidence
that also the nuclear light component is fitted correctly. In §4, this optical nuclear luminosity is supposed to represent the
accretion disk surrounding the BH.
Black hole masses.
BH masses are computed from the derived bulge luminosity,
using a unique equation for Sy1 and NLSy1 as in McLure & Dunlop
(2002): /M⊙)= which is valid under the assumption that differences
between Sy1 and NLSy1 are due to geometrical rather than physical
effects. Our masses (Tab. 1), after correcting for the
different cosmology, agree well with those derived by reverberation
mapping (Kaspi et al. 2000) for the common sources.
X-ray luminosity.
Typically, non-active galaxies have very low X-ray luminosities; thus
the X-ray emission at a ROSAT/PSPC count rate above 0.3 cts/s is
likely produced only in the nuclei of AGN. However, the X-ray emission
is not directly related to the accretion disk, because due to the
canonical temperatures of the disk emission peaks in the UV. The
X-ray luminosity has been computed using the X-ray flux in the
0.5–2.0 keV (Tab. 2 in Schwope et al. 2000), assuming a power law
spectrum with photon index of –2 and applying the corresponding
Galactic absorption and correction. We caution that this approach
yields unreliable and inconsistent results for few NLSy1 in our
sample, having very steep, soft X-ray spectra.
Radio data. We cross-correlated our sample with the NVSS and FIRST radio catalogues, and, owing to their limited sky coverage, 53 matches were found. Both surveys are centered at 1.49 GHz ( = 20 cm), where the synchrotron emission of our targets may be associated with the nuclear activity but also with the spatially-extended star formation activity, if any. NVSS and FIRST map the sky at different spatial resolution (45′′and 5′′, respectively), and thus allow to disentangle the two potential contributions. In fact, if the unresolved AGN produces all the radio emission, the fluxes listed in the two catalogues must be consistent; otherwise the NVSS flux must be larger. A flux-flux plot shows that galaxies with and without the extra contribution to the radio emission from star formation activity can be separated by a line of equation . This selection criterion is robust against a maximal 20% variability of the AGN radio flux (Falcke et al. 2001). Thus the radio luminosities of 21 out of 53 galaxies are attributed only to their nuclear activity.
| Source Name | Kaspi et al. | This work |
|---|---|---|
| M⊙) | /M⊙) | |
| n011 (Fairall 9) | 7.59 8.01 | 7.898.83 |
| n054 (PG 1211+14) | 7.45 7.7 | 8.44 9.34 |
| n065 (IC 4329A) | 7.25 | 6.76 7.78 |
| n069 (NGC 5548) | 8.02 8.16 | 7.14 8.12 |
| Equation 1 | Equation 2 | |||||
|---|---|---|---|---|---|---|
| a | b | c | d | |||
| All | 0.580.06 | 18.442.6 | 0.74 | 0.960.24 | -4.1810.7 | 0.68 |
| Sy1 | 0.560.07 | 19.483.0 | 0.72 | 0.740.22 | 4.809.6 | 0.60 |
| NLSy1 | 0.610.11 | 17.094.9 | 0.82 | 1.180.52 | -13.9522.9 | 0.92 |
4. Correlation analysis
Optical vs. X-ray emission. A strong linear relation is found between the optical accretion disk and the X-ray luminosity (Fig. 2), of the form
| (1) |
where the coefficients “a” and “b” have been determined separately
for the whole sample (All) and for the Sy1 and NLSy1 galaxies alone,
respectively (Tab. 2). The consistency of the relations is
confirmed by the Spearman Rank correlation coefficient, , which is
higher than 0.7. From the plot and the table it is obvious that Sy1
and NLSy1 behave in the same way. The scatter is about 0.5
dex. There are (at least) two obvious reasons for this scatter:
first, optical and X-ray fluxes have not been measured simultaneously,
and due to the known variability of Seyferts a factor of a few can
easily be accounted for. Second, the X-ray fluxes have been
computed on the basis of the total measured counts and an assumed power
law slope. It would have been more correct (though not possible in
most cases due to photon statistics) to fit also the power law slope,
and thus obtain a more accurate X-ray flux.
One may think that the line may produce a
non-negligible contribution to the continuum emission in the
R-band. For testing this hypothesis, the template spectrum of a Sy1
has been convolved with the transmission curve of the R-band
filter. We computed the dilution factor from Hα, for
different [NII]/Hα ratios and for different
EW(Hα), also taking into account that Hα may be
enhanced by galaxy interaction. The dilution factor is not more than
1% and thus being negligible.
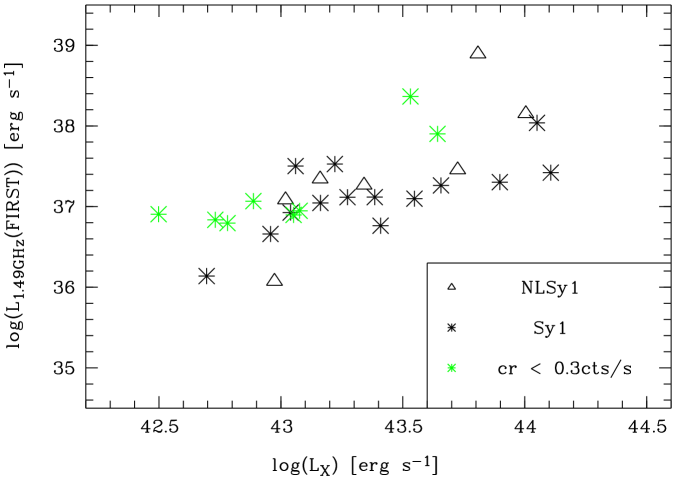
Radio vs. X-ray emission. We also find that the X-ray emission correlates well with the radio continuum emission. As in the previous case, the relation is linear, and has been fit in the form
| (2) |
The coefficients “c” and “d” are listed in columns 4 and 5 of
Tab. 2. Here we used only those 21 galaxies for which we have
information about nuclear radio emission. As previously, the linear
regression has been computed for all objects, and for the Sy1 (14
galaxies) and NLSy1 (7 galaxies) independently. Due to the small size
of the two subsamples the errors are quite high and the Spearman Rank
correlation coefficient in not really reliable. Nevertheless, it
appears that NLSy1 may have a steeper slope than the Sy1 galaxies.
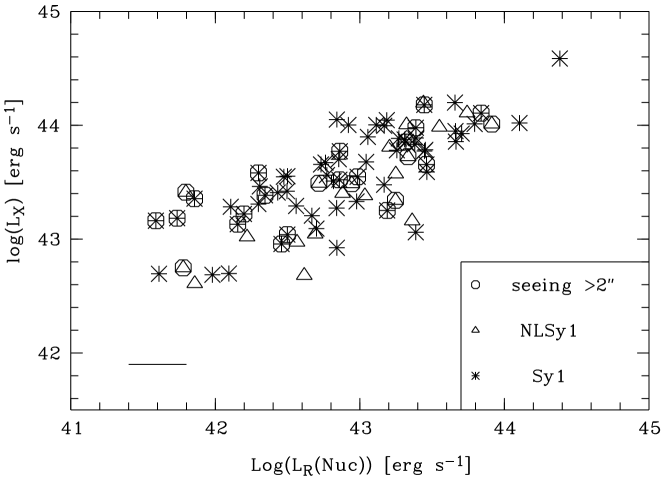
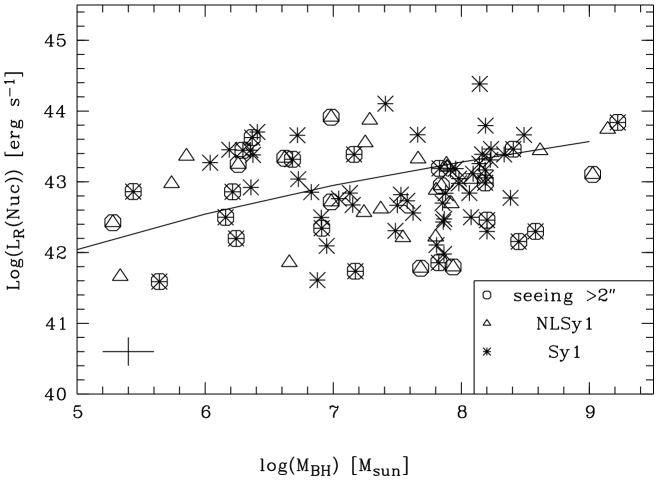
Optical vs BH masses. The optical luminosity of the accretion disk is also correlating with the BH mass computed according to §3.2 (Fig. 4). The solid line indicates the predicted relationship for an optically thick accretion disk around a non-rotating BH (Shakura & Sunyaev 1973), where for a given BH mass the R band flux depends on the temperature (and thus accretion rate ) of the object ( chosen here). The curvature of this line is basically a measure of the differing bolometric correction for varying BH mass (and thus temperature).
5. Conclusions
We find that the optical luminosity of the nuclei of Seyfert galaxies correlates with the power-law X-ray emission, the radio emission from the core as well as the Black Hole mass.
These relations are not driven by the Malmquist bias, which is introduced whenever a sample is selected via a flux-limit. In fact, the additional 9 Sy1 galaxies with cr 0.3 cts/s and NVSS/FIRST counterpart confirm the general trend (see Fig. 3, grey asterisks.)
The correlation of the optical nuclear luminosity with the X-ray luminosity could potentially be understood if the canonical blackbody-like continuum emission from the accretion disk is enhanced due to irradiation by soft X-rays, so that an increase in the X-ray flux would create a larger optical flux. This is a well-known effect in X-ray binaries, though it has not been possible so far to quantify this relation, as it depends on too many parameters (e.g. X-ray spectrum of the irradiating source, temperature and ionization state of the disk, geometry of the disk).
Kriss et al. (1982) and Koratkar et al. (1995) found a strong correlation between the soft X-ray luminosity and the broad and line luminosity, respectively, in quasars and Sy1 galaxies. It has been argued that an increased accretion disc flux would not only cause a larger photoionization (and thus Hα flux), but also provide more seed photons which would be up-scattered to produce the power law X-ray spectrum, and thus the X-ray flux. This effect is unlikely to explain our correlation, since simulations show that the contribution of the Hα emission line to the band flux is less than 1%.
Including the correlation with the radio luminosity leads to the consideration of a less direct, yet at least as plausible, coupling between the luminosities in the different wavelengths, namely via the electron corona which is supposed to surround the accretion disk. The electron temperature distribution is expected to depend on the accretion disk properties, primarily the accretion rate and disk temperature. On the other hand, the temperature and density of the corona determine the efficiency of the Compton scattering, and thus directly determine the slope and power of the X-ray spectrum. Thus, a change in e.g. the accretion rate would not only lead to a varying optical emission, but via the corona also to a varying X-ray and radio emission. The physical relation between the processes which produce the emission in the X-ray and radio remains at the level of speculation. In microquasars, the stellar-binary analogs of jet emitting objects in our Galaxy, Rau & Greiner (2002) have recently found a similar correlation between the strength of the radio emission and the X-ray power law slope. Owing to the smaller timescales involved in microquasars (due to their smaller black hole mass), a whole continuum of jet strengths has been observed from bright, spatially resolved ejections over “baby-jets” down to quasi-steady radio (synchrotron) emission. Adopting this similarity, one could argue that the core radio emission in Seyfert galaxies witnesses matter outflow from the central black hole. Objects with higher activity at X-ray wavelengths, i.e. higher accretion rate, may thus also show higher mass outflows from their central engine, thus implying a larger radio flux. Indeed, this is what has been found when comparing the X-ray and radio fluxes of galactic black hole binaries in the low/hard state: the radio flux scales as X-ray flux to the power of 0.7 (Gallo et al. 2003). Surprisingly, this is (within the errors) the same correlation as we find (coefficient in Tab. 2). Certainly, further investigations are necessary to understand the processes involved and their interrelation, but it is encouraging that seemingly the same processes are at work in AGN and galactic black hole binaries.
6. acknowledgements
MS is grateful to Günther Hasinger and the AIP (Potsdam) for the scientific and human support during the Ph.D. time. MS also thanks A. Merloni, D. Pierini and M. Radovich for their help and discussion. The authors thank the anonymous referee for the useful comments that improved the final version of this paper. We made use of the publicly available NVSS and FIRST radio catalogues.
References
- (1) Bahcall, J.N. et al. , 1997, ApJ, 479, 642
- (2) Becker, R.H., White, R.L., Helfand, D.J., 1995, ApJ, 450, 559
- (3) Condon J.J. et al. , 1998, AJ, 115, 1693
- (4) Dickey, J.M., Lockman, F. J., 1990, ARAA, 28, 215
- (5) Falcke, H. et al. , 2001, in “Black Holes in Binaries and Galactic Nuclei”,ESO Workshop in Garching.
- (6) Ferrarese, L. & Merrit, D., 2000, ApJ, 539, L9
- (7) Gallo E., Fender, R.P., Pooley, G.G., 2003, MNRAS, 344, 60
- (8) Gebhardt, K. et al. , 2000, ApJ, 539, L13
- (9) Kaspi, S. et al. , 2000, ApJ, 533, 631
- (10) Koratkar, A. et al. , 1995, ApJ, 440, 132
- (11) Kriss, G.A., Canizares, C. R., Ricker, G.R., 1980, ApJ, 242, 492
- (12) Kuhlbrodt, B., Wisotzki, L., Jahnke, K., 2001, in “QSO hosts and their environments”, Granada, eds. J. Marquez et al. , Kluwer Acad. Press
- (13) Magorrian, J. et al. , 1998, AJ, 115, 2285
- (14) McLure, R.J., Dunlop, J.S., 2001, MNRAS, 327, 199
- (15) McLure, R.J., Dunlop, J.S., 2002, MNRAS, 331, 795
- (16) Predehl, P., Schmitt, J.H.M.M., 1995, A&A, 293, 889
- (17) Rau, A., Greiner, J., 2003, A&A, 397, 711
- (18) Salvato, M., 2002, Ph.D. Thesis, University of Potsdam (Germany)
- (19) Schwope, A. et al. , 2000, Astron. Nach., 321, 1
- (20) Shakura, N.I. & Sunyaev, R.A., 1973, A&A, 24, 337
- (21) Véron-Cetty, M.P., Véron, P., Gonçalves, A.C., 2001, A&A, 372, 730
- (22) Voges, W. et al. , 1999, A&A, 349, 383
- (23) Virani, S.N., De Robertis, M.M, VanDalfsen, M.L., 2000, AJ, 120, 1739