Simulations of the Intergalactic Medium
Abstract
I present a review by epoch of baryons in the intergalactic medium (IGM), from the first star until today. Recent observations indicate a protracted period of reionization, suggesting multiple populations of reionizers; detection of these sources is a key goal that is now coming within reach. The optical Lyman alpha forest () is well-described by the Fluctuating Gunn-Peterson Approximation, but puzzling observations of associated metal lines and nearby galaxies may provide insights into galactic feedback processes. IGM studies at are progressing rapidly thanks to ultraviolet absorption line studies of both Ly absorbers and the warm-hot intergalactic medium. Cosmological hydrodynamic simulations have played an integral part in these advances, and have helped to shape our understanding of the IGM at each epoch. Working jointly, observations and theory continue to expand our knowledge of the IGM as the earliest stages of galaxy formation and the dominant reservoir of baryons at all redshifts.
Astronomy Department, the University of Arizona, 933 North Cherry Avenue, Tucson, AZ, USA 85721
1. Introduction
All baryons in the Universe were originally in the intergalactic medium (IGM). Today, the majority of baryons remain there. Understanding the evolution of the IGM is therefore a critical component for a complete theory of how baryons evolve in the Universe, from the smooth Dark Ages to present-day galaxies and large-scale structure. In this review I will highlight some recent work towards understanding the evolution of the IGM’s various components, their physical state and connection to galaxies, with particular emphasis on the contributions and insights provided by numerical simulations.
This review is divided into four sections. §2 presents a simulation-based overview of the various baryonic components in the Universe. §3 discusses some of the latest theoretical and observational results probing the epoch of reionization. §4 presents a short history of optical Ly forest studies, and expounds on two of its more puzzling aspects: The presence of metals in the diffuse IGM, and the effects of galaxies on their surrounding gas. §5 highlights recent developments in probing the IGM, including prospects for detecting the so-called missing baryons. §6 provides a short summary.
2. The History of Baryons in the Universe
Baryons in the Universe can be divided into four phases, according to their density and temperature (e.g. Davé et al. 1999): (1) “Condensed”: Stars and cold gas in galaxies. This is the most readily detectable baryonic phase. (2) “Hot”: Gas bound in clusters. These baryons are seen via their X-ray emission, which generally requires that they have K. (3) “Diffuse”: Low-density gas whose dynamics are governed by the underlying dark matter distribution. This phase gives rise to the majority of Ly absorbers seen in distant quasar spectra. (4) “Warm-Hot”: Mildly shock-heated, uncollapsed gas with K. This gas is difficult to detect in absorption due to its high ionization state, and difficult to detect in emission due to its low density. Hence these are the “missing baryons” that have drawn considerable attention, as we will discuss in §5.
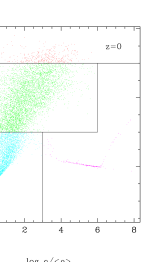
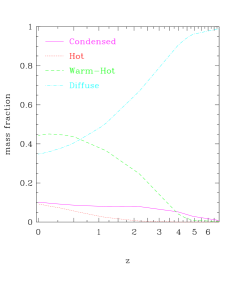
Figure 1 (left panel) shows the cosmological phase diagram, i.e. a density-temperature plot of gas in a representative volume of the Universe, drawn from a TreeSPH simulation by Springel & Hernquist (2003, their 100 Mpc/h G4 run). They use kinetic feedback and a multi-phase ISM model to obtain a converged star formation history that reproduces the observed stellar density at . Divisions between the four phases above are indicated. At the lowest densities, the diffuse phase shows a tight density-temperature relation (discussed in §4.2). Moving to mildly overdense regions allows gas to compress and shock heat, producing a scatter in temperature that grows with density through the warm-hot phase. As gas falls into the largest bound systems it virializes at the halo temperature and enters the hot phase. At larger densities, the cooling time becomes short and gas is able to cool into the condensed phase and form stars. The upturn at arises from the details of feedback implementation in this simulation, and the floor at K in the condensed region arises because no molecular hydrogen or metal line cooling is included in this run.
The right panel of Figure 1 shows the mass fraction in each phase from . At , virtually all baryons are in the diffuse phase. As structure forms, intergalactic gas in the filaments surrounding galaxies is able to shock-heat, and the warm-hot phase begins to grow. The condensed phase increases rapidly up to , then the growth slows considerably, following the observed cosmic star formation history. Cluster formation governs the hot phase; this becomes significant only at late times when large potential wells are able to form. By the present day, of the baryons reside in the warm-hot phase. This conclusion is broadly consistent with that from a number of other cosmological hydrodynamic simulations, using a variety of numerical techniques, resolutions, and input microphysics (Davé et al. 2001). Thus these predictions for the evolution of baryons are generic to CDM models, and are driven primarily by the gravitational growth of structure (Valageas & Silk 2001).
3. The Reionization Epoch
3.1. The First Stars
The IGM came into being, by definition, when the first galaxies formed. At this time, the Universe was essentially metal- and dust-free, with (presumably) negligible magnetic fields. Thus the first star formed in a relatively simple environment, from the gravitational collapse of a primordial gas cloud (Tegmark et al. 1997). Ultra-high resolution simulations by Abel, Bryan & Norman (2002) and Bromm, Coppi & Larsen (2002) show that a star produced in this environment is likely to be a VMS (very massive star, ), since the lack of H2 and metal cooling agents results in a large Jeans mass.
The calculation of the second star is significantly more complex. Due to the exceptionally biased nature of the first collapsed object (an perturbation), the second star would be expected to form close to the first star. However, the first star emits a copious amount of ultraviolet radiation during its million year lifetime, which can sufficiently heat surrounding gas so as to inhibit subsequent collapse. If the collapse is inhibited beyond the lifetime of the first star, then the resulting supernova may have a dramatic impact on the second star’s gas cloud. VMS’s were originally believed to collapse directly to black holes with no ejectae; however, calculations by Heger & Woosley (2002) show that in a specific stellar mass range (), the resulting pair instability supernova can expel a large fraction of its material into the surrounding IGM. Not only would the mechanical wind energy evacuate surrounding gas, but the accompanying metals would pollute the IGM. If the pollution reaches a modest value of , then subsequent star formation from that gas will not be VMS’s but will instead follow a Population II IMF (Schneider et al. 2003).
From these considerations, it might appear that the first few massive stars would serve to quickly pollute the IGM and transition to a lower-mass IMF incapable of reionizing the Universe until late times. This cannot be the whole story, though, since WMAP observations of the temperature-polarization cross correlation indicate a Thomson optical depth of , implying a high reionization redshift of (95% confidence; Kogut et al. 2003). While the error bars are still large (and will improve with accumulating WMAP data), if taken at face value they suggest a sizeable population of efficiently-emitting VMS’s in place at early times (Cen 2003b).
3.2. The Minihalo Epoch
The epoch of minihalos, i.e. bound systems with virial temperatures below K that can only cool via molecular hydrogen line emission in a primordial gas, is a crucial one for the reionization history of the Universe. Minihalos are so ubiquitous at that they are expected to have a covering fraction of unity around all halos having K that are likely to be ionizing sources, thereby providing a large sink for reionizing photons (Shapiro, Iliev & Raga 2003). However, if minihalos are able to form stars themselves, they may provide a large source of reionizing photons instead. H2 production in primordial gas is insufficient to rapidly cool minihalos, but the presence of metals or X-rays that can stimulate H2 production could alter this scenario (Haiman, Abel & Rees 2000; though see Venkatesan, Giroux & Shull 2001). An early population of black holes (Madau et al. 2003) may be a candidate for producing such hard X-rays. However, Oh & Haiman (2003) argue that even if a minihalo forms an initial burst of stars, the resulting increase in entropy in the relic H II region would prevent further gas collapse; thus they argue that minihalos cannot contribute significantly to measured by WMAP. Given the conflicting theoretical predictions, direct observations of minihalos are highly desireable. Prospects include seeing them in 21cm emission with LoFAR or ALMA (Iliev et al. 2002, 2003), or in 21cm absorption to background sources (Furlanetto & Loeb 2003) if such sources exist.
Since the Universe at is sufficiently dense to recombine after being initially ionized, and feedback from the first generation of stars may suppress subsequent star formation, it is possible that the Universe underwent two epochs of reionization (Cen 2003; Wyithe & Loeb 2003a). The first would occur at from VMS’s (Oh et al. 2001; Wyithe & Loeb 2003b), and the second around from Population II stars in protogalaxies. This would reconcile the WMAP results with observations of a sharp rise in the IGM neutral fraction seen in spectra of Sloan Digital Sky Survey quasars (White et al. 2003). Sloan data also shows that the numbers of quasars are too small to provide the necessary photons to perform this final stage of reionization (Fan et al. 2003), thus star forming regions in protogalaxies are the likely culprit. An observational signature of multiple reionizations may lie in 21cm emission from the IGM (Furlanetto, Sokasian & Hernquist 2003).
3.3. Detecting the Reionizers at
Observing the sources responsible for the final reionization of the Universe is one science driver for the James Webb Space Telescope (JWST), scheduled to lauch in 2011. Broad-band color selection can be used to identify candidates, but detailed spectroscopic follow-up will be challenging from space, and may require novel approaches in ground-based infrared spectroscopy.
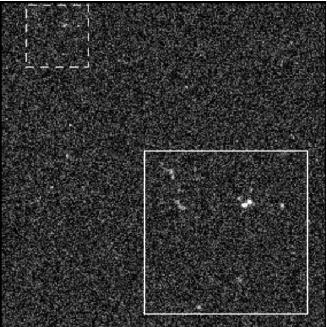

Perhaps surprisingly, it may be more efficient to search for star formation using ground-based narrow band searches for Ly emission. Cowie (priv. comm.) has confirmed several sources this way, so Ly emission is in fact detectable prior to the end of reionization. Barton et al. (2003) used a hydro simulation to show that with optimistic (but not outrageous) assumptions regarding the IMF and escape fractions, it may be possible to detect pre-reionization objects with existing 8-10m telescopes, using an narrow-band filter in a night sky window corresponding to Ly emission at . Figure 2 (left panel) shows a simulated 32-hour observation with a VMS-based IMF and favorable escape parameters from Santos (2003). These include having sources blow a local ionization bubble (Haiman 2003), having the emission be centered redwards of the protogalaxy’s redshift, and no dust attenuation. Under these (admittedly fortuitous) conditions, a fair number of sources would be detectable.
While detection with an 8m telescope will require some cooperation from nature, detection with a 20m+ class telescope would be straightforward even for fairly conventional IMFs and escape parameters. The right panel of Figure 2 shows the Ly luminosity function predicted from the Q5 simulation of Springel & Hernquist (2003), having particles and a 10 Mpc/h (comoving) box size. For a mildly top-heavy IMF as might be expected for Population II stars, the Ly luminosities would be lower than the “plausible” model. This would preclude detection with an 8m class telescope, at least without a large-area survey, but could be seen with a 20-30m class telescope. Such a telescope would also be required for spectroscopic follow-up of JWST broad-band selected high redshift galaxies, which is crucial for constraining their physical properties.
4. The Optical Ly Forest
4.1. History of Cloud Models
Redshifted intervening weak neutral hydrogen absorption, i.e. the “Ly forest”, was first detected in quasar spectra in the 1960’s (e.g. Schmidt 1965; Lynds & Stockton 1966). Their cosmological origin was clearly demonstrated by Sargent et al. (1980), who also found a substantial number of associated C IV absorbers. Models for absorption systems trace back to Gunn & Peterson (1965) and Bahcall & Salpeter (1965), who forwarded the idea of a smooth, highly ionized IGM causing a uniform “Gunn-Peterson trough” (as it was later called), punctuated by discrete clouds of neutral hydrogen. This model persisted, in various forms, into the 1990’s, with individual cloud confinement provided by ambient pressure from a hot IGM (Sargent et al. 1980; Ikeuchi & Ostriker 1986), gravity (Melott 1980; Black 1981), CDM minihalos (Rees 1986; Ikeuchi 1986), and combinations thereof (Petitjean et al. 1993). With ever-improving observations, it became clear that no model could fit Ly data without a great deal of uncomfortable tuning. The advent of Keck’s HIRES spectrograph, together with new insights from hydro simulations, paved the way for the final demise of “cloud” models.
4.2. The Fluctuating Gunn-Peterson Model
In the early 1990’s, an alternative origin for Ly absorbers was being formulated from rapidly advancing cosmological hydrodynamic simulations. It was noted that the Cosmic Web must necessarily contain gas ionized by a metagalactic flux from quasars. The resulting H I absorption along any line of sight had statistical properties remarkably similar to that of observed Ly systems (e.g. Cen et al. 1994; Zhang, Anninos & Norman 1995). In particular, the column density distribution (i.e. the number of systems per unit column density per unit redshift) from such models naturally reproduced the observed power law over orders of magnitude in (Hernquist et al. 1996; Davé et al. 1997).
From these simulations a new paradigm arose for the origin of the Ly forest. Instead of arising in individual clouds, Ly absorption is analogous to a Gunn-Peterson trough that fluctuates as it passes through over- and under-dense regions of the Universe. The absorbing gas is expected to have a tight density-temperature relation set by the balance between adiabatic cooling due to Hubble expansion and photoionization heating by the metagalactic UV background (Hui & Gnedin 1997). This “equation of state” of the IGM can be constrained observationally (Schaye et al. 2000; Choudhury, Padmanabhan, & Srianand 2001). Thus a given density corresponds to a given temperature, which corresponds to a given ionization fraction, which in turn corresponds to a given H I optical depth. The simulation paradigm can thus be encapsulated in the “Fluctuating Gunn-Peterson Approximation” (FGPA; Croft et al. 1998), in which . The density is that of either the dark matter or the gas, since they trace each other quite well in these low-density, gravitationally-dominated systems. The constant of proportionality is inversely related to the H I photoionization rate, and also depends on the IGM temperature and cosmological parameters (see Croft et al. for precise form).
The FGPA has proven to be a valuable tool for interpreting Ly forest data. For instance, according to the FGPA, the mean baryon density can be simply related to the mean optical depth of H I absorption. Rauch et al. (1997) measured , and together with a minimal estimate of the H I photoionization rate from quasars, determined . At the time, this determination was considered quite high, though it agreed with initial results from [D/H] studies (Tytler, Fan & Burles 1996). WMAP results (Spergel et al. 2003) have now confirmed the Rauch et al. value. Another application of the FGPA is to interpret metal lines observations (discussed in §4.3), using the conversion between and to obtain accurate, pixel-by-pixel ionization corrections.
A more ambitious application of the FGPA, and the one for which it was originally proposed, is the reconstruction of the matter power spectrum (Croft et al. 1998). Since the optical depth is a one-dimensional, nonlinear map of the underlying dark matter distribution, it can be inverted to yield the matter fluctuation spectrum. The cosmological parameters derived from the latest such analysis at (Croft et al. 2002) are consistent with the WMAP results at (Spergel et al. 2003) and large-scale structure studies at , but uniquely probes an intermediate redshift regime. WMAP and the Croft et al. data together show a mild preference for a running tilt of the primordial power spectrum, but this is controversial (Seljak, McDonald & Makarov 2003).
4.3. Metals in the Diffuse IGM
High resolution spectroscopy on 8-10m class telescopes has opened up a new window for studying metal absorption in low-density regions of the Universe. Using Keck/HIRES, Songaila & Cowie (1996) found that most Ly systems at with , and half the systems with , showed associated C IV absorption. This is fairly surprising, since the latter column density limit corresponds to matter overdensities of a few at those redshifts, which presumably lie well outside of galaxies. Thus some mechanism must be invoked to transport metals across cosmological distances. Constraints on such mechanisms can be provided by examining the density dependence of the metallicity, : A strong gradient would imply late, local enrichment, while a more uniform distribution would suggest an early epoch of enrichment.
There are two approaches to studying : One is to trace a single ion over a range of IGM densities, and the other is to examine different ions that trace different densities. The idea behind the latter is shown in the left panel of Figure 3: The curves show the Line Observability Index (LOX; Hellsten et al. 1998) for C IV and O VI, as a function of (which, via the FGPA, yields the ionization conditions). The curves shown use a metallicity [C/H] and a halo star abundance pattern with [O/C]. The LOX translates to an equivalent width, in mÅ, of a “typical” associated metal absorber. The solid lines show the LOX for a Haardt & Madau (1996) background, while the dashed lines show the effects of attenuating this background by above 4 Ryd in order to mimic the ionization conditions prior to He II reionization (e.g. Heap et al. 2000). Notice that a comparison of these two ions can provide not only an estimate of , but also constrain the shape of the ionizing flux. The horizontal lines denote approximate detection limits for Keck/HIRES, for within the Ly forest (dashed; appropriate for O VI) and redwards of it (solid; for C IV). From this, it is predicted that C IV would routinely be seen for , as observed, but at lower densities it is increasingly ionized to C V. Meanwhile, the lowest density gas is probed nicely with O VI absorption. Systems with correspond to gas at the mean density of the Universe at , so in principle O VI absorption can even probe into voids. Note that O VI here is photoionized, not collisionally ionized, consistent with observations of O VI absorbers at (Carswell et al. 2002).


The practical difficulty with using O VI is that its doublet lies at rest wavelengths 1032&1037Å, firmly within the dense Ly forest, so it is quite difficult to identify and confirm the doublet lines. Instead, Davé et al. (1998) followed Songaila (1998) in taking a pixel-based approach to identify an excess of absorption over the expected contribution from H I at the wavelength of associated O VI. The so-called optical depth ratio technique yields the plot shown in the right panel of Figure 3: The histogram of apparent optical depth ratios from a Keck/HIRES spectrum of Q1422+2309 is compared to predictions from a hydro simulation with and without oxygen. This shows that O VI is clearly present in C IV systems, at a level consistent with a quasar-dominated, post-He II recombination ionizing background and an alpha-enhanced abundance pattern. Davé et al. also found no O VI in weaker H I systems that showed no C IV. From these results, Davé et al. reached two main conclusions:
-
1.
A comparison of O VI in systems with and without C IV indicates a metallicity gradient of .
-
2.
The presence of O VI means that He II was reionized over at least half the redshift path length covered by Q1422’s Ly forest from .
Though much larger data sets now exist, this work has not been followed up due to the lack of availability of Keck/HIRES quasar spectra.
Meanwhile, VLT’s UVES spectrograph has now obtained large samples of high-redshift quasar spectra. Aguirre et al. (2002) developed a somewhat different pixel-based analysis technique called the Pixel Optical Depth (POD) method to optimally extract metallicity information in low-density regions. Using 9 UVES spectra and hydro simulations for calibration, Schaye et al. (2003) quantified the variation in IGM metallicity with both density and redshift, employing the simpler, more robust idea of measuring C IV absorption over a sizeable range of H I optical depths. They obtained [C/H], over and . Thus they find a modest gradient with density (consistent with Davé et al. 1998), but little evolution of the IGM metallicity. A similar lack of evolution in C IV was also found by Songaila (2001) for . Aguirre et al. (2003) extended this method to Si IV, which generally traces higher densities than C IV, and confirmed the lack of evolution in a new ion, in addition to finding intriguing evidence for large alpha enhancements ([Si/C]) in the IGM. These results generally point towards an early epoch of enrichment at .
Conversely, recent observations of superwinds from Lyman break () galaxies (Pettini et al. 2002) argues in favor of a local enrichment mechanism. Adelberger et al. (2003) find a curious lack of H I absorption in the immediate vicinity of galaxies at impact parameters comoving Mpc/h (see the solid points in the left panel of Figure 4), which they interpret as further evidence for strong winds. Adelberger (these proceedings) also found a strong enrichment of C IV along lines of sight passing near galaxies, providing direct evidence for in situ enrichment. Thus the exact manner and epoch at which the IGM was enriched remains uncertain.
4.4. Absorption Near Galaxies at


The galaxy-IGM connection explored by Adelberger et al. (2003) also presents a mystery. The dramatic drop in absorption near galaxies is opposite to what is expected from hierarchical simulations, since matter clustering tends to increase absorption close to galaxies (Kollmeier et al. 2003). The left panel of Figure 4 shows the Adelberger et al. data (labelled “ASSP”) compared to a hydro simulation having no winds/photoionization (triangles), and various ad hoc model with complete evacuation of H I out to (squares), 1 (pentagons), and 1.5 (hexagons) comoving Mpc/h, and another model where the evacuation volume is proportional to the galaxies’ baryonic mass (stars). Only in the extreme case of complete evacuation out to 1.5 Mpc/h does the model come within the error bars of the data. The radius would have to be even larger if the evacuation was (more realistically) non-spherical or incomplete. Large evacuation radii are required because peculiar velocities can shift absorption from large distances to the galaxies’ redshifts (Desjacques et al. 2003). Models based on local photoionization by star formation fail by a considerable margin to produce the required evacuations, so winds are the logical explanation, but the required energies are quite large. Similar conclusions were found by Croft et al. (2002).
The fact that only three quasar-galaxy pairs contribute to Adelberger et al.’s innermost point raises the possibility that the lack of absorption is a statistical fluke. To examine this, Kollmeier et al. sampled trios of galaxy-absorber pairs in various models to determine the frequency of obtaining a flux decrement as low as observed. Figure 4, right panel, shows that it is exceptionally rare for our fiducial simulation, even when a random redshift error of km/s is included. Even for our most extreme evacuation model there is barely a 5% chance of reproducing the data.
It remains unclear what physics is required to reconcile the models with this data. Kollmeier et al. considered photoionization from AGNs, “filling in ” of Ly absorption from cooling radiation (Fardal et al. 2001), non-equilibrium effects, and other ideas, but none appeared promising. Obviously a larger sample of these systems would be helpful, and has already been obtained at (Steidel, priv. comm.). If these observational results are borne out, it may require a radical change in our understanding of feedback processes.
5. The Low-Redshift Intergalactic Medium
5.1. The Ly Forest at
The launch of HST with its ultraviolet capabilities heralded a new age in IGM studies, as the Ly absorption line (and various UV metal features) became routinely observable for systems with . The Quasar Absorption Line Key Project compiled over 80 spectra (Jannuzi et al. 1998), and quantified the statistics of low- absorbers with great precision (Weymann et al. 1998), even though the Faint Object Spectrograph (FOS) data could not resolve individual Ly absorbers. A major surprise was that any absorbers were found at all, since an extrapolation from the rapidly-declining population at would predict virtually none (Morris et al. 1991).
Davé et al. (1999) extended hydrodynamic simulations to using the first distributed-memory parallel TreeSPH code (Davé, Dubinksi, & Hernquist 1997), and found that the statistical properties of simulated absorbers were in good agreement with Key Project results. Furthermore, they argued against a second population of slowly-evolving absorbers dominating at low- (Bahcall et al. 1996), and instead claimed that the change in evolution of the absorber population was caused by a drop in the amplitude of the quasar-dominated metagalactic flux, which increased the neutral fraction and balanced the drop in gas column density due to cosmic expansion. In other words, low- Ly absorbers, at least the weaker ones, are physically analogous to their high- counterparts, albeit shifted to somewhat lower column densities.


The Space Telescope Imaging Spectrograph (STIS), installed in 1997, provided the first fully resolved glimpse at the local Ly forest. Careful comparisons versus hydro simulations continued to show excellent agreement with data (Davé & Tripp 2001; see Figure 5). This suggests that with a large sample of weak absorbers, as should be provided by the Cosmic Origins Spectrograph beginning in 2005, many of the analyses done at high- could be performed at . Hence COS offers great promise for constraining the metagalactic ionizing flux (Davé & Tripp 2001), the IGM metallicity, and possibly even the matter power spectrum at on mildly nonlinear scales.
5.2. The Warm-Hot Intergalactic Medium
Despite the physical similarities in Ly absorbers, the low- IGM is considerably more complex than the high- one. As shown in Figure 1, at the diffuse IGM contains most of the baryons in the Unvierse, but this is not true at low redshifts. In particular, the elusive Warm-Hot Intergalactic Medium (WHIM) is predicted to contain a third to half of all baryons today (Davé et al. 2001).
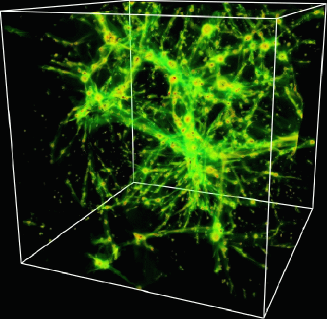
The WHIM has drawn widespread interest recently because it may be the repository of the so-called “missing baryons”. Fukugita, Hogan & Peebles (1998) performed an inventory of baryons observed today and found roughly a half to be missing, compared with high- Ly forest measurements or the now well-determined . Cen & Ostriker (1999) suggested that they reside in a warm-hot state, with K, making them difficult to detect. Davé et al. (2001) examined the physical properties of WHIM gas in more detail, finding that it generally resides in filamentary large-scale structures, well outside of virialized objects (Figure 6, left panel). The existence of such gas in large quantities was at first surprising, since if it is all placed in virialized halos then the soft X-ray background would be overproduced by orders of magnitude (Pen 1999; Wu, Fabian & Nulsen 1999). Instead, the low densities predicted by simulations result in a much weaker background, broadly consistent with observational limits (Croft et al. 2001; Phillips, Ostriker & Cen 2001).

Detecting the WHIM in absorption is challenging, since H I is a poor tracer of gas at these temperatures. However, O VI is promising because it has a collisional ionization maximum at K. Tripp, Savage & Jenkins (2000) detected four intervening O VI systems at , and obtained a lower limit on the baryon density contained in such systems to be . Because of the uncertainties in ionization corrections, metallicities, and gas densities, it is perhaps more straightforward to make predictions from simulations regarding the expected frequency of O VI absorbers. The right panel of Figure 6 shows such a comparison from Chen et al. (2003). Observations (solid points) are reproduced nicely with a metallicity of roughly one-tenth solar for WHIM gas, a metallicity that is somewhat higher than Schaye et al. (see §4.3) at WHIM densities (), extrapolated to . Cen et al. (2001) and Fang & Bryan (2002) obtain similar results. O VI absorption has also been detected in association with the Local Group (Nicastro et al. 2003).
It is also possible to detect WHIM absorption in the X-ray band, particularly using the O VII and OVIII lines (Chen et al. 2003; Fang, Bryan & Canizares 2003). Mathur, Weinberg & Chen (2003) claim to have detected WHIM O VII absorption in a Chandra spectrum of H1821, though XMM follow-up did not unambiguously confirm it.
Detecting WHIM emission, while even more difficult, may ultimately prove the best approach for obtaining a complete map of missing baryons in the local Universe. Zappacosta et al. (2002) found a diffuse soft X-ray structure associated with a galaxy overdensity at , but a more systematic search will have to await new satellites. The proposed Missing Baryon Explorer (MBE) would detect a significant number of WHIM sources in six X-ray emission lines (Fang et al. 2003). The Japanese have a similar proposal called Diffuse Intergalactic Oxygen Surveyor (DIOS). Emission in lower ionic species such as O VI and C V would detect the bulk of WHIM gas at lower temperatures, and the proposed Spectroscopy and Photometry of the IGM’s Diffuse Radiation (SPIDR) satellite was aiming to do so until it was cancelled in the design phase.
6. Summary
Observations of the IGM have progressed rapidly in recent years, which in turn has spurred dramatic advances in our theoretical understanding of the various baryonic components in the Universe. Still, many questions crucial to our understanding of galaxy and structure formation remain unanswered, including:
-
•
What are the sources that reionize the IGM, and how can we detect them?
-
•
How and when did metals get into the IGM?
-
•
What effects do galactic feedback have on surrounding IGM gas, and how does it change with redshift?
-
•
How do we obtain a complete observational census of baryons today?
Here I have given a status report on these topics, which currently present more questions than answers. Major advances will only come through joint progress in observational capabilities, particularly in the ultraviolet, along with improving simulations for the evolution of baryons in the Universe.
Acknowledgments.
I wish to thank the various collaborators on projects mentioned in these proceedings, including Betsy Barton, Greg Bryan, Renyue Cen, Xuelei Chen, Rupert Croft, John Dubinski, Taotao Fang, Mark Fardal, Uffe Hellsten, Lars Hernquist, Neal Katz, Juna Kollmeier, Jerry Ostriker, Casey Papovich, J.-D. Smith, Volker Springel, Todd Tripp, and David Weinberg.
References
Abel, T., Bryan, G. L., & Norman, M. L. 2002, Science, 295, 93
Adelberger, K. L., Steidel, C., Shapley, A., & Pettini, M. 2003, ApJ, 584, 45
Aguirre, A., Schaye, J., Kim, T.-S., Theuns, T., Rauch, M., & Sargent, W. L. W. 2003, ApJ, in press, astro-ph/0310664
Aguirre, A., Schaye, J., Theuns, T. 2002, ApJ, 576, 1
Bahcall, J. N. & Salpeter, E. E. 1965, ApJ, 142, 1677
Barton, E. J., Davé, R., Smith, J.-D. T., Papovich, C., Hernquist, L., & Springel, V. 2003, ApJ, submitted, astro-ph/0310514
Black, J. 1981, MNRAS, 197, 533
Bromm, V., Coppi, P. S., & Larson, R. B. 2002, ApJ, 564, 23
Carswell, R., Schaye, J., & Kim, T.-S. 2002, ApJ, 578, 43
Cen, R. 2003, ApJ, 591, 12
Cen, R. 2003b, ApJ, 591, L5
Cen, R., Miralda-Escudé, J., Ostriker, J.P., & Rauch M. 1994, ApJ, 427, L9
Cen, R. & Ostriker, J. P. 1999, ApJ, 514, 1
Cen, R., Tripp, T. M., Ostriker, J. P., & Jenkins, E. B. 2001, ApJ, 559, L5
Chen, X., Weinberg, D. H., Katz, N., & Davé, R. 2003, ApJ, 594, 42
Choudhury, T. R., Padmanabhan, T., Srianand, R. 2001, MNRAS, 322, 561
Ciardi, B. & Madau, P. 2003, ApJ, 596, 1
Croft, R. A. C., Hernquist, L., Springel, V., Westover, M., & White, M. 2002, ApJ, 580, 634
Croft, R. A. C., Weinberg, D. H., Bolte, M., Burles, S., Hernquist, L., Katz, N., Kirkman, D., & Tytler, D. 2002, ApJ, 581, 20
Croft, R. A. C., Weinberg, D. H., Katz, N., & Hernquist, L. 1998, ApJ, 495, 44
Davé, R., Dubinski, J., & Hernquist, L. 1997, NewAst, 2, 277
Davé, R., Hernquist, L., Weinberg, D. H., & Katz, N. 1997, ApJ, 477, 21
Davé, R., Hellsten, U., Hernquist, L., Katz, N., & Weinberg, D. H. 1998, ApJ, 509, 661.
Davé, R., Hernquist, L., Katz, N., & Weinberg, D. H. 1999, ApJ, 511, 521
Davé, R., Cen, R., Ostriker, J. P., Bryan, G. L., Hernquist, L., Katz, N., Weinberg, D. H., Norman, M. L., & O’Shea, B. 2001, ApJ, 552, 473
Davé, R. & Tripp, T. M. 2001, ApJ, 553, 528
Desjacques, V., Nusser, A., Haehnelt, M. G., & Stoehr, F. 2003, MNRAS, submitted, astro-ph/0311209
Fang, T. & Bryan, G. L. 2001, ApJ, 561, L31
Fang, T., Bryan, G. L., Canizares, C. R. 2002, ApJ, 564, 604
Fang, T., Croft, R. A. C., Sanders, W. T., Houck, J., Davé, R., Katz, N., Weinberg, D. H., Hernquist, L. 2003, ApJ, submitted, astro-ph/0311141
Fan, X. et al. 2003, AJ, 125, 1649
Fardal, M. A., Katz, N., Gardner, J. P., Hernquist, L., Weinberg, D. H., & Davé, R. 2001, ApJ, 562, 605
Fukugita, M., Hogan, C. J., & Peebles, P. J. E. 1998, ApJ, 503, 518
Furlanetto, S. R. & Loeb, A. 2002, ApJ, 579, 1
Furlanetto, S. R., Sokasian, A., & Hernquist, L. 2003, MNRAS, submitted, astro-ph/0305065
Gunn, J. E. & Peterson, B. A. 1965, ApJ, 142, 1633
Haardt, F. & Madau, P. 1996, ApJ, 461, 20
Haiman, Z. 2002, ApJ, 576, L1
Haiman, Z., Abel, T. & Rees, M. J. 2000, ApJ, 534, 11
Heap, S. R., Williger, G. M., Smette, A., Hubeny, I., Sahu, M. S., Jenkins, E. B., Tripp, T. M., & Winkler, J. N. 2000, ApJ, 534
Heger, A. & Woosley, S. E. 2002, ApJ, 567, 532
Hellsten, U., Hernquist, L., Katz, N., & Weinberg, D. H. 1998, ApJ, 499, 172
Hernquist, L.H., Katz, N., Weinberg, D.H., & Miralda-Escudé, J. 1996, ApJ, 457, L51
Hui, L. & Gnedin, N. Y. 1997, MNRAS, 292, 27
Ikeuchi, S. 1986, Astrophys. Space Sci. 118, 509
Ikeuchi, S. & Ostriker, J. P. 1986, ApJ, 301, 522
Iliev, I. T., Shapiro, P. R., Ferrara, A., & Martel, H. 2002, ApJ, 572, L123
Iliev, I. T., Scannapieco, E., Martel, H., & Shapiro, P. R. 2003, MNRAS, 341, 81
Jannuzi, B. T. et al. 1998, ApJS, 118, 1
Kogut, A. et al. 2003, ApJS, 148, 161
Kollmeier, J. A., Weinberg, D. H., Davé, R., & Katz, N. 2003, ApJ, 594, 75
Lynds C. R. & Stockton A. N. 1966, ApJ, 144, 446
Madau, P., Rees, M. J., Volonteri, M., Haardt, F., & Oh, S. P. 2003, ApJ, submitted, astro-ph/0310223
Melott, A. 1980, AJ, 268, 630
Morris, S. L., Weymann, R. J., Savage, B., Gilliland, R. 1991, ApJ, 377, L21
Nicastro, F., Zezas, A., Elvis, M., Mathur, S., Fiore, F., Cecchi-Pestellini, C., Burke, D., Drake, J., & Casella, P. 2003, Nature, 421, 719
Oh, S. P. & Haiman, Z. 2003, MNRAS, submitted, astro-ph/0307135
Oh, S. P., Nollett, K. M., Madau, P., & Wasserburg, G. J. 2001, ApJ, 562, L1
Pen, U.-L. 1999, ApJ, 510, L1
Petitjean, P., Bergeron, J., Carswell, R. F., & Puget, J. L. 1993, 260, 67
Pettini, M., Rix, S. A., Steidel, C. C., Adelberger, K. L., Hunt, M. P., & Shapley, A. E. 2002, ApJ, 569, 742
Phillips, L. A., Ostriker, J. P., Cen, R. 2001, ApJ, 554, L9
Rauch, M. et al. 1997, ApJ, 489, 7
Rees, M. J. 1986, MNRAS, 218, 25
Santos, M. R. 2003, MNRAS, submitted, astro-ph/0308196
Santos, M. R., Bromm, V., & Kamionkowski, M. 2002, MNRAS, 336, 1082
Sargent, W. L. W., Young, P. J., Boksenberg, A. & Tytler, D. A. 1980, ApJS, 42, 41
Schaye, J., Theuns, T., Rauch, M., Efstathiou, G., Sargent, W. L. W. 2000, MNRAS, 318, 817
Schaye, J., Aguirre, A., Kim, T.-S., Theuns, T., Rauch, M., & Sargent, W. L. W. 2003, ApJ, 596, 768
Schmidt, M. 1965, ApJ, 141, 1295
Schneider, R., Ferrara, A., Salvaterra, R., Omukai, K., & Bromm, V. 2003, Nature, 422, 869
Seljak, U., McDonald, P., & Makarov, A. 2003, MNRAS, 342, L79
Shapiro, P. R., Iliev, I. T., & Raga, A. C. 2003, MNRAS, submitted
Songaila, A. 1998, AJ, 115, 2184
Songaila, A. 2001, ApJ, 561, L153
Songaila, A. & Cowie, L. L. 1996, AJ, 112, 335
Spergel, D. N. et al. 2003, ApJS, 148, 175
Springel, V. & Hernquist, L. 2003, MNRAS, 339, 312
Tegmark, M., Silk, J., Rees, M. J., Blanchard, A., Abel, T., & Palla, F. 1997, ApJ, 474, 1
Tytler, D., Fan, X.-M., & Burles, S. 1996, Nature, 381, 207
Valageas, P., Schaeffer, R., & Silk, J. 2002, A&A, 388, 741
Venkatesan, A., Giroux, M. L., & Shull J. M. 2001, ApJ, 563, 1
Weymann, R. J. et al. 1998, ApJ, 506, 1
White, R. L., Becker, R. H., Fan, X., & Strauss, M. A. 2003, AJ, 126, 1
Wu, K. K. S., Fabian, A. C., & Nulsen, P. E. J. 2001, MNRAS, 95
Wyithe, J. S. B. & Loeb, A. 2003a, ApJ, 586, 693
Wyithe, J. S. B. & Loeb, A. 2003b, ApJ, 588, L69
Zappacosta, L., Mannucci, F., Maiolino, R., Gilli, R., Ferrara, A., Finoguenov, A., Nagar, N. M., Axon, D. J. 2002, A&A, 394, 7
Zhang, Y., Anninos, P., & Norman, M.L. 1995, ApJ, 453, L57