Cryogenic Tests of Volume-Phase Holographic Gratings: I. Results at 200
Abstract
We present results from cryogenic tests of a Volume-Phase Holographic (VPH) grating at 200 measured at near-infrared wavelengths. The aims of these tests were to see whether the diffraction efficiency and angular dispersion of a VPH grating are significantly different at a low temperature from those at a room temperature, and to see how many cooling and heating cycles the grating can withstand. We have completed 5 cycles between room temperature and 200 , and find that the performance is nearly independent of temperature, at least over the temperature range which we are investigating. In future, we will not only try more cycles between these temperatures but also perform measurements at a much lower temperature (e.g., ).
1 Introduction
Volume-Phase Holographic (VPH) gratings potentially have many advantages over classical surface-relief gratings (Barden, Arns, & Colburn 1998; see also Barden et al. 2000), and are planned to be used in a number of forthcoming instruments (e.g., AA; Bridges et al. 2002). While applications to optical spectrographs only are currently being considered, VPH gratings will also be useful to near-infrared spectrographs if the performance at low temperatures is satisfactory. In particular, its diffraction efficiency and angular dispersion should be confirmed. Contraction of dichromated gelatin with decreasing temperature could cause variations in the line density and profile of diffraction efficiency (the thickness of the gelatin layer is one of the parameters defining diffraction efficiency). Since cooling and heating cycles might cause some deterioration of a VPH grating and reduce its life time, we also need to see whether these characteristics vary with the successive cycles.
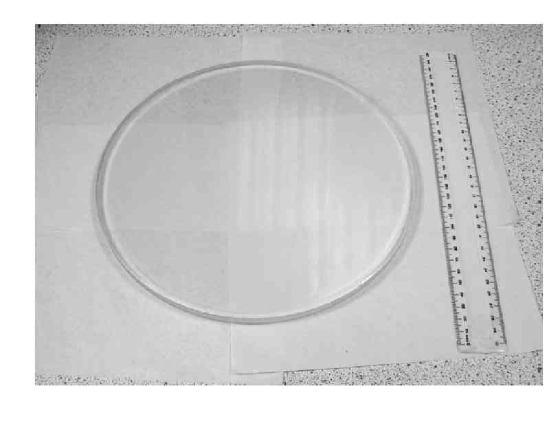
In this paper, results from measurements of a sample grating at 200 and at room temperature are presented. A picture of the grating investigated is shown in Figure 1. This grating was manufactured by Ralcon Development Lab, and its diameter is about 25 cm. The line density is 385 lines/mm and thus the peak of diffraction efficiency is around 1.3 m at the Bragg condition when the incident angle of an input beam to the normal of the grating surface is 15∘. The measurements are performed at wavelengths from 0.9 m to 1.6 m. The target temperature, size and line density of the grating, and wavelengths investigated are nearly the same as those adopted for the Fibre-Multi Object Spectrograph (FMOS; e.g., Kimura et al. 2003), which is one of the next generation instruments for the 8.2m Subaru telescope with commissioning expected in 2004: this instrument will be observing at wavelengths from 0.9 m to 1.8 m, and a VPH grating will be used as an anti-dispersing element in the near-infrared spectrograph which is operated at 200 to reduce thermal noise.
2 Pre-test at Room Temperature
Before starting measurements using the cryogenic test facility (see next section), we investigated the diffraction efficiency of the VPH grating at a room temperature. The measurements were performed manually on the optical bench. The procedures and results obtained are summarised below.
2.1 Measurements
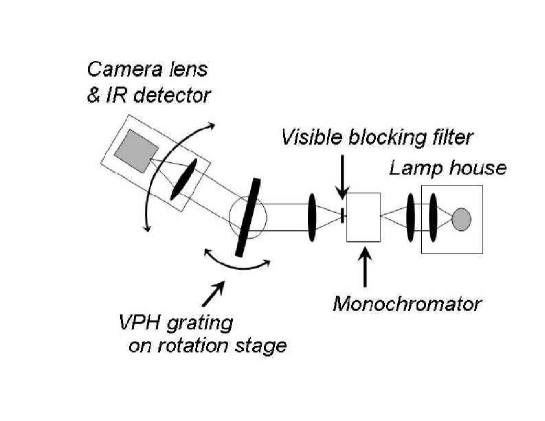
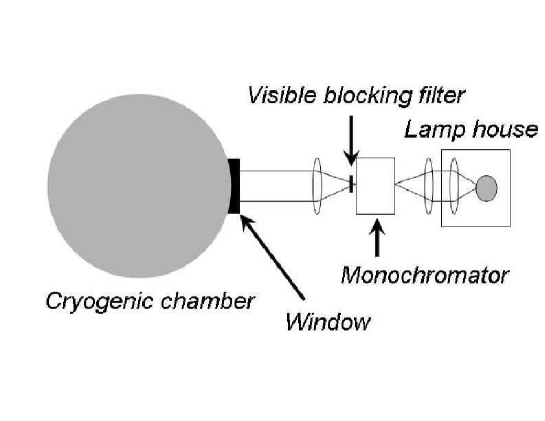
In Figure 2, the overall configuration of the optical components used for the measurements is indicated (the detailed information for the main components are listed in Table 1). Light exiting from the monochromator is collimated and used as an input beam to illuminate the central portion of the VPH grating. The spectral band-width of this input beam is set by adjusting the width of the output slit of the monochromator. The slit width and the corresponding spectral band-width were set to 0.5 mm and 0.01 m, respectively, throughout the measurements; the beam diameter was set to 2 cm by using an iris at the exit of the lamp house.
The input beam is diffracted by the grating and the camera, composed of lenses and a near-infrared detector (320 256 InGaAs array), is scanned so as to capture the diffracted beam. The output slit of the monochromator is thus re-imaged on the detector. Since the detector has some sensitivity at visible wavelengths, a visible blocking filter which is transparent at wavelengths longer than 0.75 m is inserted after the monochromator to reduce contamination of visible light from a higher order.
The basic measurement procedures are as follows. First, the brightness of the lamp and the wavelength of light exiting from the monochromator are fixed (the brightness of the lamp is kept constant by a stabilised power supply during the measurement cycle at a given wavelength), and the total intensity included in the image of the slit is measured without the VPH grating. Then, the VPH grating is inserted at an angle to the optical axis, and the intensities of the zero and first order () diffracted light are measured. The diffraction angle is also recorded. Next, the grating is set at a different incident angle and the intensities of the diffracted light and diffraction angles are measured. After these measurements are repeated for all the incident angles of interest, a different wavelength is chosen and the same sequence is repeated. The brightness of the lamp can be changed when moving from one wavelength to another: a higher brightness was used at shorter wavelengths because the system throughput is lower.
2.2 Results
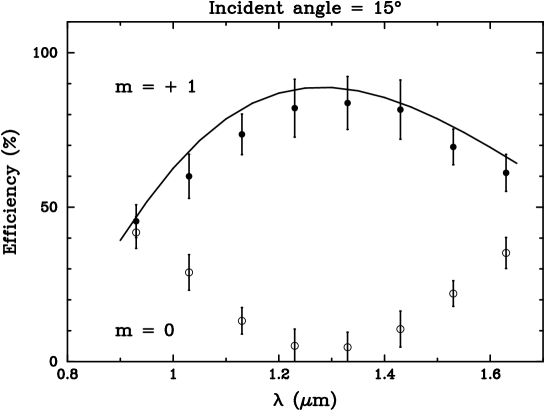
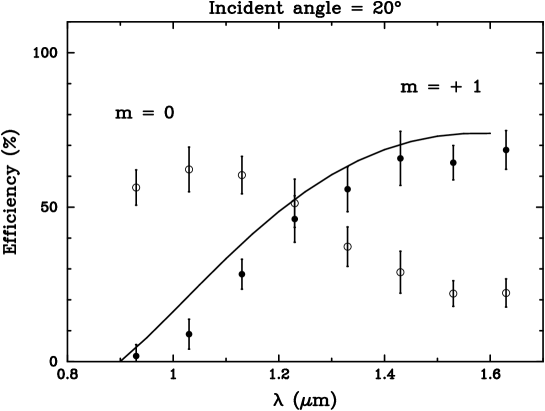
In Figure 3, the diffraction efficiencies measured are plotted against wavelengths for the cases where incident angles are 15∘ (upper panel) and 20∘ (lower panel). Open and solid dots show the efficiency profiles for the zero and first order () diffracted light, respectively. Since random errors are dominated by fluctuations of the bias level of the detector on a short time scale ( sec), the error bars plotted are calculated from a typical value of the fluctuations. It is found from this figure that particularly for the incident angle of 15 ∘, the peak of the diffraction efficiency reaches 80% and the efficiency exceeds 50% over the wavelength range from 0.9 m to 1.6 m. The profiles can be well reproduced by theoretical calculations based on the coupled wave analysis (Kogelnik 1969), which are shown by the solid lines in the figure. In these calculations, a thickness of the dichromated gelatin layer of 12 m and a refractive index modulation amplitude of 0.05 are assumed. Energy losses by surface reflections at boundaries between glass and air ( 10%) are also included. Although the energy losses at boundaries between glass and gelatin are likely to be much smaller because their refractive indices are very similar, they might explain that the measured diffraction efficiency tends to be slightly lower than the theoretical calculation. (The energy lost by internal absorption of the dichromated gelatin layer is estimated to be 1% below 1.8 m; e.g., Barden et al. 1998).
3 Cryogenic Test
In the following, we describe the measurements at 200 as well as those at a room temperature, both of which were performed using the cryogenic test facility as shown below. Throughout these measurements, we used a different VPH grating from that used in the pre-test at room temperature, although both have the same specifications.
3.1 Measurements
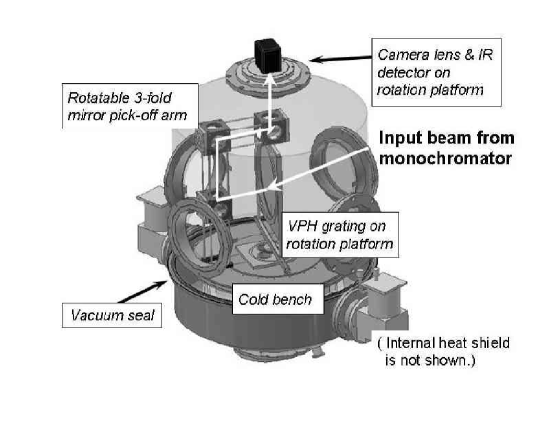
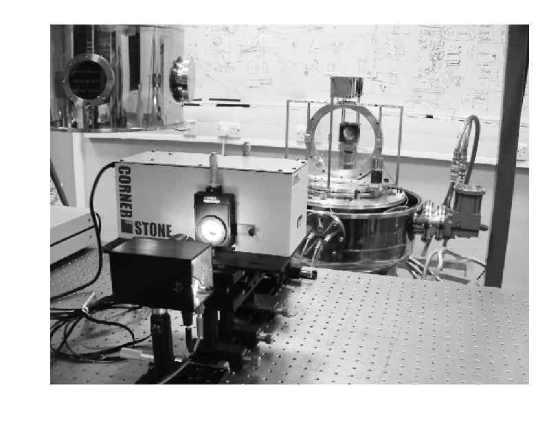
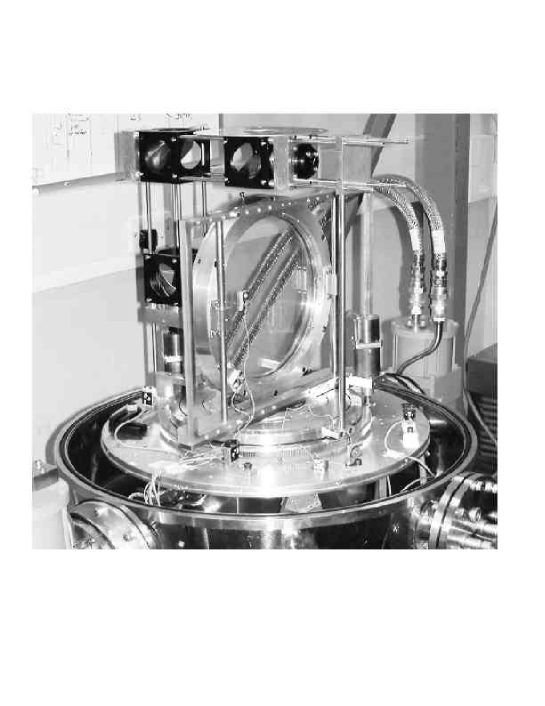
In Figures 4, schematic views of the fore-optics and the optics inside the cryogenic chamber are indicated. Pictures of these facilities are shown in Figure 5. The fore-optics and light path before the window of the cryogenic chamber and the camera are the same as those used in the warm pre-test. The slit width and the spectral band-width were set to 0.1 mm and 2.0 m, respectively, throughout the measurements, and the beam diameter was set to 2 cm by using an iris before the window. The light path in the cryogenic chamber is described as follows: the input beam illuminates the central portion of the VPH grating and is diffracted by the grating. The diffracted light is captured by scanning the pick-off arm and is delivered to the camera on the top of the chamber by 3 pick-off mirrors. The output slit of the monochromator is thus re-imaged onto the detector. This procedure enables measurements to be made at a variety of incident and diffraction angles without having to mount the detector inside the cryostat.
The measurement procedures are the same as those in the pre-test, except that all the measurements were performed with the VPH grating in place. We initially perform the measurements at a room temperature ( 280 ). Then, we repeat the measurements at 200 before returning to 280 to repeat the cycle. When we cool the VPH grating, we monitor the temperature of the grating with a sensor on the surface, close to the edge of the grating but unilluminated by the input beam. When the temperature reaches , we switch off the compressor and cold heads before starting the measurements. Although we do not have any thermostatic systems to maintain a given temperature, it takes several hours for the temperature of the grating to start increasing and go above 200 after the compressor and cold heads are switched off. Thus the temperature of the grating stays approximately at 200 5 for the duration of the measurement cycle.
3.2 Results and Discussions
The following results were obtained when the incident angle was set to , which gives the peak of diffraction efficiency around 1.3 m when satisfying the Bragg condition. We note that the same trends are obtained from measurements when different incident angles are adopted.
3.2.1 Variation of diffraction efficiency
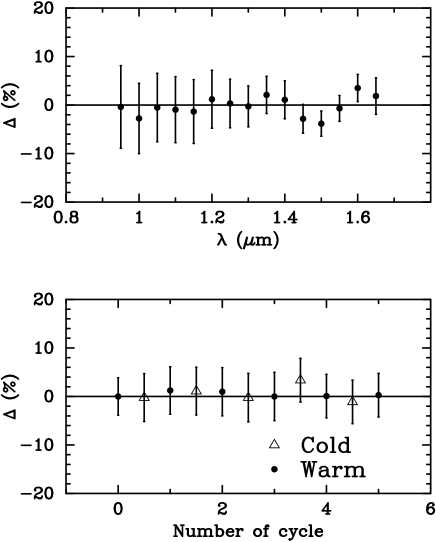
In the upper panel of Figure 6, differences of diffraction efficiencies in a sequence of measurements at 200 from those obtained in the first warm test (280 ) are plotted against wavelengths. The error bars are calculated from the typical fluctuation of the bias level of the detector. The errors are larger at shorter wavelengths because the system throughput is lower so that the bias level fluctuation is larger compared to the intensity of the slit images (the brightness of the lamp is kept constant with a stabilised power supply throughout the measurements at all the wavelengths). It is found that the differences are close to zero at all the wavelengths, suggesting that there is no significant variation in profile of diffraction efficiency such as a global decrease in the efficiency or a lateral shift of the peak. In the lower panels, the differences in diffraction efficiency are averaged over the wavelength range, and the averaged difference from the first warm test is plotted against cycle number. Open triangles and solid dots represent the measurements at 200 and those at 280 , respectively. The error bars indicate the standard deviation of a distribution of the differences around the average value. These results suggest that the diffraction efficiency of a VPH grating is nearly independent of temperature, at least between 200 and 280 , and that no significant deterioration is caused by a small number of heating and cooling cycles.
3.2.2 Variation of angular dispersion
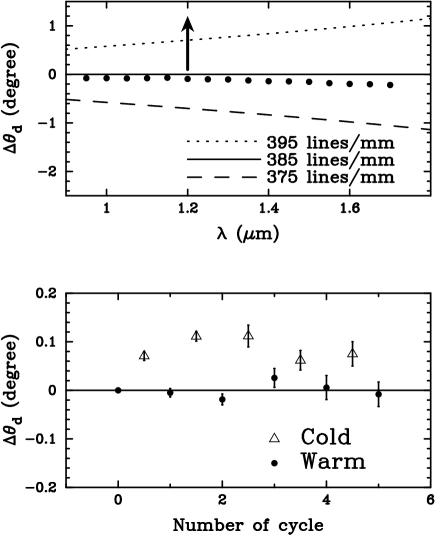
In the upper panel of Figure 7, difference of diffraction angle from the prediction for the line density of 385 lines/mm (the nominal line density of the VPH grating) is plotted against wavelength; solid line (zero level) corresponds to the relationship between diffraction angle and wavelength for the line density of 385 lines/mm. Dotted and dashed lines indicate the relationships predicted for a line density of 375 and 395 lines/mm, respectively. The data points show the actual measurements at 280 .111Although this plot may suggest that the line density of the VPH grating is slightly smaller than 385 lines/mm, precise definition of the line density through measurements is beyond the scope of this paper. As the arrow shows, if the gelatin layer shrinks with decreasing temperature, the line density would increase and the data points would shift upwards on this plot.
In the lower panel, the difference of diffraction angle from that measured in the first warm test is plotted against the number of cycles. The symbols have the same meanings as those in Figure 6. Again, each data point represents the difference averaged over the wavelength range, and the error bars indicate the standard deviation of the distribution of the differences around the average value. The lower panel suggests that at 200 , the diffraction angle is slightly larger than that at 280 . This is equivalent to a slight increase of the line density of the grating, and the simplest explanation for this is a shrinkage of the grating with decreasing temperature. By using this increment of diffraction angle ( 0.1∘), the amount of shrinkage is estimated to be % of the diameter of the grating, which is consistent with the amount of shrinkage of the glass substrate expected when the temperature is decreased by 80 (the amount of shrinkage of gelatin would be larger by an order of magnitude). One needs to keep in mind, however, that only a small portion of the VPH grating was illuminated throughout the measurements (the beam diameter was 2 cm while the diameter of the VPH grating is 25 cm) and thus a variation of the line density might be difficult to be detected. Investigating larger portions over the VPH grating would be an important future work.
3.3 Comparison with other results
Other cryogenic tests of VPH gratings are also in progress by the gOlem group at Brera Astronomical Observatory (Bianco et al. 2003). Their preliminary results suggest that diffraction efficiency is significantly reduced ( 20% around the peak) at 200 compared with room temperature, which is inconsistent with our results. One consideration here is that there is a significant difference in speed of the cooling and heating processes between the tests of the gOlem group and ours. In the gOlem case, they require only 1 hour to cool a VPH grating down to their target temperature from a room temperature (Zerbi 2001). With the cryogenic chamber used for our experiments, it takes about 15 hours to cool down to 200 from 280 . This may imply that rapid cooling and/or heating can cause some deterioration of a VPH grating. Further experiments are required in this area.
4 Summary & Conclusion
In this paper, results from the cryogenic tests of a VPH grating at 200 are presented. The aims of these tests were to see whether diffraction efficiency and angular dispersion of a VPH grating are significantly different at a low temperature from those at a room temperature, and to see how many cooling and heating cycles the grating can withstand. We have completed 5 cycles between room temperature and 200 , and find that diffraction efficiency and angular dispersion are nearly independent of temperature. This result indicates that VPH gratings can be used in spectrographs cooled down to 200 such as FMOS without any significant deterioration of the performance.
In future, we will be trying more cycles between 200 and 280 to mimic more realistic situations of astronomical use. Measurements at a much lower temperature (e.g., 80 ) will also be necessary to see whether VPH gratings are applicable to spectrographs for use in the -band. We will report on these issues in a forthcoming paper.
References
- (1) Barden, S. C., Arns, J. A., & Colburn, W. S. 1998, Proc. SPIE, 3355, 866
- (2) Barden, S. C., Arns, J. A., Colburn, W. S., & Williams, J. B. 2000, PASP, 112, 809
- (3) Bianco, A., Molinari, E., Conconi, P., et al. 2003, Proc. SPIE, Vol. 4842, 22
- (4) Bridges, T., Aa Team. 2002, Anglo-Australian Observatory Epping Newsletter, 100, 20
- (5) Kimura, M., Maihara, T., Ohta, K., Iwamuro, F., Eto, S., Iino, M., Mochida, D., Shima, T., Karoji, H., Noumaru, J., Akiyama, M., Brzeski, J., Gillingham, P. R., Moore, A. M., Smith, G., Dalton, G. B., Tosh, I. A. J., Murray, G. J., Robertson, D. J., & Tamura, N. 2003, Proc. SPIE. 4841, 974
- (6) Kogelnik, H. 1969, Bell System Tech. J., 48, 2909
- (7) Zerbi, F. M. 2001, “Preliminary tests on VPH in Cryogenic environment” on the web page: http://golem.merate.mi.astro.it/projects/vph/cryo/cryo.html
| Manufacturer | Product ID | Comments | |
|---|---|---|---|
| Light source | Comar | 12 LU 100 | Tungsten-halogen lamp |
| Monochromator | Oriel Instruments | Cornerstone 130 | 600 lines/mm grating, Blaze at 1 m |
| Model 74000 | |||
| Visible blocking filter | Comar | 715 GY 50 | Transparent at nm |
| Near-infrared detector | Indigo Systems | AlphaNIR | 320 256 InGaAs array |