The radio galaxy - relation: the 10 mass limit
The narrow - relation of powerful radio galaxies in the Hubble diagram is often attributed to the stellar populations of massive elliptical galaxies. Because it extends over a large range of redshifts (0 4), it is difficult to estimate masses at high redshifts by taking into account galaxy evolution. In the present paper, we propose to estimate the stellar masses of galaxies using the galaxy evolution model PÉGASE. We use star formation scenarios that successfully fit faint galaxy counts as well as =0 galaxy templates. These scenarios also predict spectra at higher , used to estimate valid photometric redshifts. The baryonic mass of the initial gas cloud is then derived. The - relation is remarkably reproduced by our evolutionary scenario for elliptical galaxies of baryonic mass 10, at all up to = 4. is also the maximum mass limit of all types of galaxies. Using another initial mass function (IMF), even a top-heavy one, does not alter our conclusions. The high value of observed at 4 implies that massive clouds were already formed at early epochs. We also find that the limit is similar to the critical mass of a self-gravitating cloud regulated by cooling (Rees & Ostriker, 1977; Silk, 1977). Moreover, the critical size 75 Kpc is remarkably close to the typical diameter of Ly haloes surrounding distant radio galaxies. This confirms the validity of the method of baryonic mass determination based on the -band luminosity. A puzzling question that remains to be answered is the short time-scale of mass-accumulation required to form such massive galaxies at 4. We discuss the dispersion of the - relation in terms of uncertainties on the mass limit. The link between the presence of the active nucleus and a large stellar mass is also discussed.
Key Words.:
galaxies: fundamental parameters, galaxies: distances and redshifts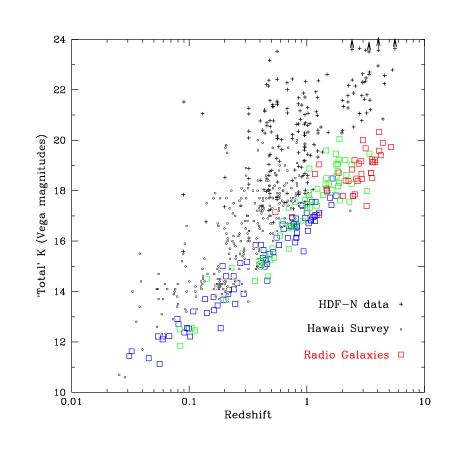
1 Introduction
The Hubble diagram is an efficient tool to study the evolution of galaxies at high redshifts. Because evolutionary processes in the expanding universe are not known, models are required. The most valuable models propose scenarios of star formation that aim to fit observations of galaxies at all redshifts; the first constraint is to reproduce the templates of nearby (0) galaxies.
The -band (centred at 2.2 m) is preferred for evolutionary analysis because galaxies are seen over a large redshift range (0 4) in their near-IR to optical rest frames. Moreover, the evolutionary effects are reduced. The Hubble - diagram is known to be an excellent tool to measure stellar masses of galaxies, up to high redshifts. At 0, the luminosities are dominated by the bulk of old low mass red stars. At higher , the emission is due to the redshifted emission of blue luminous young stars because galaxies are more gas-rich and formed stars more actively in the past.
The main feature of the galaxy distribution in the Hubble -band diagram is the well-known - relation, the sharp bright limit traced by nearby ( 0) massive galaxies and by hosts of distant powerful radio galaxies. The physical meaning of the relation, up to = 4 or more, is still puzzling. Most of the interpretations of the - relation explain its dispersion either by testing various sets of cosmological parameters (H0, q0, ) (Longair & Lilly, 1984, and more recently Inskip et al. 2002) or by examining the relation of the galaxy magnitude with its radio power. The radio-powerful 3CR galaxies are on average brighter ( 0.6 mag) than the less radio-powerful 6C (Eales & Rawlings, 1996; Eales et al, 1997) or 7C (Willott et al. 2003) radio galaxies. Moreover the radio-powerful Molonglo sample (McCarthy, 1999) shows a 1 mag with the 6C catalogue at all redshifts. From their near-infrared morphologies, the stellar populations of radio galaxy hosts are identified with massive elliptical galaxies, even at high redshifts (van Breugel et al., 1998; Lacy et al., 2000; Pentericci et al., 2001). Radio galaxy luminosities are generally high, typically L 3 to 5 L∗ for both radio-loud and radio-quiet galaxy hosts (Papovich et al., 2001). Radio galaxy hosts are located in place of elliptical galaxies in the fundamental plane (Kukula et al., 2002). At high , mass estimates of radio galaxy hosts are rare. From an incomplete rotation curve, Dey et al., (1996) derived a mass of 10 for 3C 265 (=0.81). Using HST/NICMOS observations, Zirm et al., (2003) confirmed that radio galaxy hosts are massive, even at high . Stellar masses estimated by fitting stellar energy distributions (SEDs) to the NICMOS data are between 3 and 8 10. The CO (3-2) line of the very massive galaxy SMM J02399-0136 (z=2.8) observed with the IRAM observatory by Genzel et al., (2003) shows that it is a rapidly rotating disk with a total dynamical mass of 3 1011 sin2 i M⊙ ( is the galaxy inclination). Stellar masses of three galaxies, selected in the Hubble Deep Field South at K 22 on the basis of their unusually red near-IR color (J-K 3), were estimated to be about 1011 M⊙ from their SEDs (Saracco et al., 2003).
Section 2 presents the observational samples of radio and field galaxies in the Hubble diagram. Following a preliminary interpretation of the - relation (Rocca-Volmerange, 2001), we explore in section 3 the space of cosmology and galaxy evolution parameters with the code PÉGASE to confirm this interpretation. We successively analyse the parameter set: distance modulus, star formation scenarios that define the evolutionary time-scales of the various components, the IMF and finally the baryonic mass of the initial gas reservoir. For the sake of clarity, evolution scenarios are limited to spiral and elliptical types: considering scenarios between these two types would not modify our conclusions. In section 4, the - diagram is analysed with the predicted - sequences of spiral and elliptical galaxies formed from clouds of various baryonic masses = to 1012 . We find that only the sequence of the elliptical galaxies formed from a 1012 progenitor cloud uniformly fits the - relation from =0 to =4. The sensitivity of this result to other factors (cosmology models, intensities of emission lines) is considered.
The striking similarity of the =1012 mass limit to the theoretical estimate of the critical mass of fragmentation for self-gravitating clouds (Rees & Ostriker, 1977) is finally discussed in section 5. Since the - relation is mainly traced by the most powerful radio galaxies, this means that the most massive galaxies correspond to the most massive black holes. Masses of galaxies of various radio powers are derived in section 6. In particular, strong constraints on mass accumulation time-scales are given by the high masses of radio galaxy hosts at 4. The discussion and conclusion make up the last sections.
2 The observational - relation
The observational sample of distant field galaxies and of radio-loud galaxies in the -band has been gathered by De Breuck et al., (2002) (Fig. 1). Radio sources are from the 3CR and 6CE catalogues completed by radio galaxies observed with NIRC at the Keck I telescope (Laing et al., 1983, Eales et al., 1997, van Breugel et al., 1998). All the magnitudes of radio sources are corrected to a standard 64 kpc metric aperture, following the method of Eales et al., (1997). The brightest (1) 3CR sample is complete. The NIRC sample is a selection by van Breugel et al., (1998) of powerful radio sources at the highest redshifts (1.8 4.4) with strong emission lines. The 6CE and NIRC catalogues are not complete. In sections 4 and after, the complete 7C catalogues and the 6CE* sample, recently published by Willott et al., (2003), were added to the De Breuck’s sample for the interpretation of the - relation. Over the 8-magnitude range of -band luminosities of galaxies, the bright envelope of the radio galaxy distribution delineates a sharp limit, up to =4: the so-called - relation. For comparison, field galaxies of the Hawaii survey (Cowie et al., 1999) and the HDF-N survey (Williams et al., 1996), observed in the -band at KPNO by Dickinson et al., (2003) are also plotted in the Hubble diagram. The spectroscopic redshifts were published by Fernández-Soto et al., (1999), Cohen et al., (2000) and Songaila et al., (1994).
3 Modeling galaxy evolution through the -band
The variation of apparent magnitudes with redshift is predicted by galaxy evolution models, assuming a cosmological model. To clarify the sensitivity of the model outputs to the adopted star formation scenarios, we separately analyze the effects of other parameters (distance modulus, IMF, initial mass and redshift, cosmological parameters). Stellar energy distributions (SED) of galaxy templates are predicted at all redshifts. The main emission lines, due to ionization by massive stars, are computed with an HII region model in which the Lyman continuum photon number and metallicity are the main parameters. Their intensities are added to the SEDs, assuming a FWHM of 10 Å at =0.
For each spectral type, the reddened apparent magnitude of a synthetic galaxy through the filter at redshift and cosmic time is given by:
where Mλ(0, t(0)) is the intrinsic magnitude at and at the present cosmic time t(0). The distance modulus (z) will be considered below. The k-correction and e-correction respectively depend on the cosmology and on the evolution scenario. The extinction A through the filter is derived from the total amount of metal and dust geometry. In our code PÉGASE, the extinction factor for elliptical galaxies is computed with a radiative transfer code for a dust distribution fitted on a King’s profile and Draine’s grain model (see Fioc, 1997 for details). For spirals, the stars, gas and dust are mixed homogeneously.
We adopt the cosmological model of Friedmann-Lemaître with the Hubble constant H0 in km. s-1. Mpc-1 and the matter and cosmological constant density parameters. We successively consider the H0, , values: (65, 0.3, 0.7) for standard , (65, 0.1, 0.) for open and (65, 1., 0.) for flat universes. Note that evolutionary models are able to successfully reproduce a wide range of galaxy observables only in the open and non-null universes.
3.1 The distance modulus
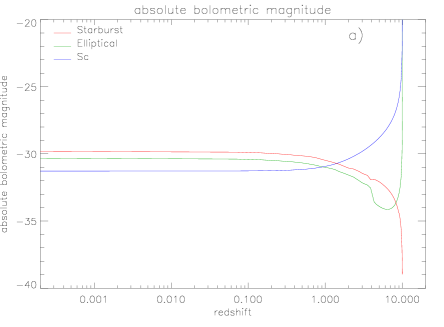
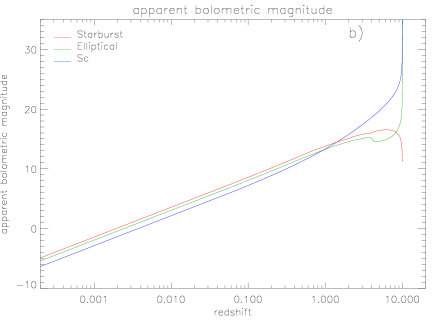
The distance modulus is related to the luminosity distance , and depends only on the cosmological parameters (Weinberg, 1972). Fig. 2 shows the absolute (a) to apparent (b) magnitude change in the standard cosmology for three spectral types (starburst, elliptical, spiral Sc). At low , the evolutionary effects of early-type galaxies are negligible because the emission is dominated by the bulk of low-mass giant stars. The slight luminosity increase for spirals is due to recent star formation. At higher , evolution effects become dominant when star formation rates are more intense, in particular when (=10 in our model); the galaxy formation redshift is the redshift when simultaneously infall and initial star formation begin.


3.2 Star formation rates and mass fractions
In the following, is the initial mass of the gas reservoir, the baryonic mass of the progenitor cloud. The scenarios of star formation conservatively assume star formation rates proportional to the current gas mass. The duration of star formation decreases from irregular and spiral ( Gyr) to elliptical (Gyr ) galaxies. The classical formalism is only briefly reviewed here. The number of stars formed per log mass unit and time unit is
= / is the star formation law of the galaxy where is the current gas mass of the galaxy and is the star formation efficiency. IMF is the initial mass function and is assumed not to evolve. All variables are normalized to the mass unit of the initial cloud, so that the model outputs are multispectral luminosities and mass fractions (stellar: , gaseous: ). More details are given in the README of the code PÉGASE.2 111Available at http://www.iap.fr/pegase (Fioc & Rocca-Volmerange, 1997, 1999c). For simplicity, among the eight scenarios of galaxy evolution proposed by PÉGASE.2, we only select those for elliptical and spiral Sc galaxies. The extreme difference between their star formation efficiencies implies different star formation durations ( 1Gyr for ellipticals and 10 Gyr for spirals). This is long enough to constrain the accumulation time-scales of the stellar and progenitor masses. Another reason to adopt the two scenarios is that the formation law of our spiral Sc scenario is close to the star formation law deduced from the hierarchical model by Baron & White (1987) while our law for ellipticals is drastically different to hierarchical predictions. Note that the instantaneous starburst, often adopted to model stellar populations of radio galaxy hosts (Ridgway et al., 2001, Willott et al., 2003), is unphysical. Moreover, because the time-scale is too short, the scenario gives too red colors when they are compared to those of massive elliptical galaxies, typical of powerful radio galaxy hosts.
Fig. 3 presents, respectively for elliptical (a) and spiral (b) galaxies, the evolution with age and of the galaxy mass and of its stellar and gaseous masses. For the two types, star formation starts at infall from the initial gas reservoir. It simultaneously initiates galaxy formation, so that the initial galaxy mass is null. measures the gas mass within the galaxy. Neutral atomic HI and molecular H2 hydrogen are not distinguished. The stellar mass only corresponds to stars still alive while stellar remnant masses are taken into account in . is the sum of + + . Template elliptical scenarios are characterized by a decreasing infall time scale of 300 Myr and the star formation efficiency =0.3 . Then supernovae produce strong galactic winds starting at 1 Gyr, eliminating all gaseous components and instantaneously stopping any further star formation. Note that our scenarios do not assume further inflow of cool gas from the halo. From Fig. 3a), the elliptical scenario is then characterized by peaks of and as drops because galactic winds. After the age of 1Gyr, the difference between and of ellipticals is due to the integrated mass of stellar remnants . In template Sc spirals, the infall time scale is 8 Gyr and the efficiency is = 10 without galactic winds. The star formation time duration is much longer ( 10 Gyr). The baryonic mass Mbar of the progenitor is derived by fitting the apparent luminosities of galaxies with the predictions for .
3.3 Initial mass function
The IMF parameters are the slope parameter () and the lower and upper mass limits. Three IMFs are considered. First, for Rana & Basu’s (1992) IMF, the slope parameter above 1.4 is =-1.51 and =-1.71 above 6.5 . Second, for Salpeter’s (1959) IMF, the slope parameter is = -1.35. Finally, for Gibson & Matteucci’s (1997) IMF, = -0.8, which greatly increases the mass of metal ejected. This ”top-heavy” IMF was proposed by the authors to explain high metal abundances at the most remote epochs. For all IMFs, we adopt a lower mass of 0.1 and an upper mass of 120.
A truncated IMF, biased towards massive stars, with a lower mass of 1 and a slope of -0.8 (the upper mass is unchanged) is unable to reproduce the bright -band magnitudes of nearby elliptical galaxies: the bulk of low mass stars that dominates the stellar emission at =0 in the -band is then missing. It will not be considered below.
4 The - relation
Figure 4 compares the observed distributions of galaxies in the Hubble diagram with the predictions of elliptical (a) and spiral (b) models. The model sequences are computed with constant values of Mbar in the range 109 to 1013 for the two scenarios. The IMF is from Rana & Basu (1992) for all sequences, except for the 1013 sequence also computed with the ”top-heavy” (TH) IMF.
All observations are covered by the sequences of between 109 and 10; so the initial mass of the reservoir cloud Mbar is the main parameter explaining the evolution of stellar masses in the Hubble -band diagram.
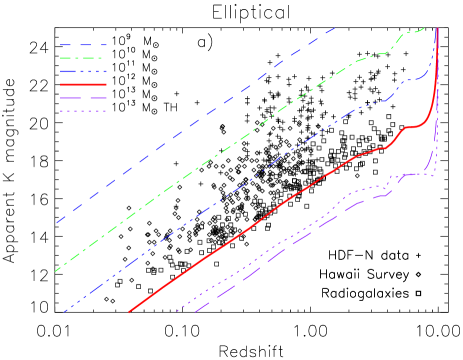
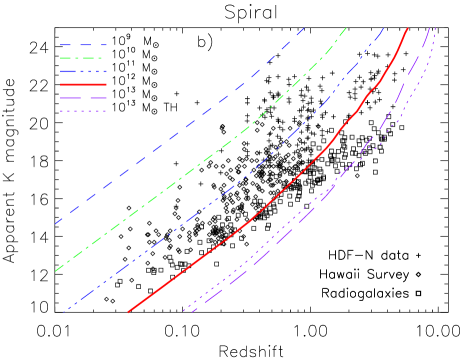
Fig. 4a also shows the continuous fit of the bright - relation by the sequence of elliptical galaxies of 10, up to 4. For spirals, the 10 sequence (Fig. 4b) is not acceptable at high while the one, possible at high , has no match at low .
Confirming that powerful radio galaxies are hosted by massive ellipticals (van Breugel et al. 1998; De Breuck et al. 2002; Willott et al. 2003), we also estimate their stellar and galaxy masses at all redshifts: for ellipticals at =0 (14 Gyrs) (Fig. 3a) 55% and 65% of the initial mass of the gaseous progenitor; these values only vary within 10% between =4 and =0. Thus 35% of the baryonic mass is still in the halo and 10%. Gas exchanges as late inflows may occasionally change these fractions. However, depending on their efficiency, they would induce fluctuations of the star formation history incompatible with the uniformity of the - relation.
The scenario of spirals (Fig. 3b) gives, at =0 (14 Gyrs), 35%, 45% and 85% of the initial mass . These masses rapidly evolve with redshift: at 2, 3%, 27% and 31% of the initial mass .
Finally, field galaxies of deep surveys are fitted either by less massive “elliptical” scenarios of = 10 or by “spiral” scenarios of =10. The Hubble diagram is alone unable to separate the two models. In particular at low ( 0.3), the predictions of the most massive elliptical and spiral models are similar.
The - sequences are predicted with two other IMFs. The variation of results computed with either Rana & Basu’s IMF or the ”top-heavy” (TH) IMF is presented on the Mbar = 10 sequence in Fig. 4ab. Fig. 5 also shows the Mbar = 10 sequence with the Salpeter IMF compared to Rana & Basu. The IMF effect on the luminosity is less than 10% at all .

The sequence limit for massive ellipticals depends little on the formation redshift . Changing (6.6, see Hu et al., 2002; Kodaira et al., 2003) in elliptical scenarios modifies the - relation only during the first Gyr (see Fig. 4a).
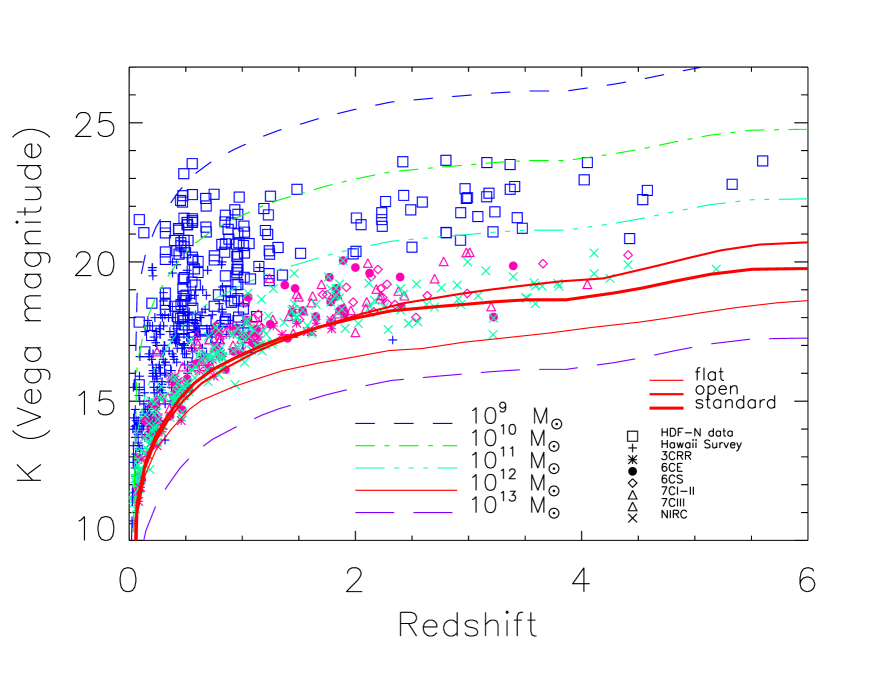
The standard cosmology (H0=65 km. s-1. Mpc-1, =0.3, =0.7) has been adopted. However, to study the sensitivity to the cosmological model, we compare the -band observations to evolution models in the (and not log as previously shown) scale (Fig. 6) for various universes. A flat universe without the cosmological constant (H0=65 km. s-1. Mpc-1, =1, =0) is not compatible with the data. Both standard and open universes can fit the data; the variation of given by the two models is lower than 10 %.
Fig. 6 is similar to Fig. 4ab and Fig. 5 but in the redshift scale and includes more data: the catalogues 7C-I and 7C-II (Willott et al. 2003), 7C-III (Lacy et al. 2000) and 6C∗ (Jarvis et al. 2001) are added to the De Breuck compilation. All our previous conclusions, in particular that the more powerful radio galaxy hosts are the more massive galaxies, up to 10, are confirmed by these data.
Emission lines from gas photoionization by massive stars are computed in our models. Fig. 7 shows predictions for the main emission lines (H, [OIII]5007, [OII]3727), redshifted in the -band and compared to the data. The -band luminosity variation =, due to ionization by massive stars, does not exceed 0.25 mag in spirals, as in ellipticals. However, observations show stronger emission lines than model predictions: other sources of ionization (shocks and photoionization by AGN) are known to be highly efficient in radio galaxies. From the powerful NIRC and the 7C radio sources (Fig. 7), the relative excesses due to emission lines are 5% at high .

5 The - relation and the fragmentation limit
The uniform galaxy mass limit = 10 at all redshifts from the -band luminosities is striking. The critical mass of fragmentation for a self-gravitating cloud has been estimated by Rees & Ostriker (1977). The dynamical model predicts that the kinetic energy of infall is first thermalized via shocks; further evolution then depends on the relative cooling and free-fall time-scales. High masses in the range 1010 to 10 ,undergoing an efficient cooling, collapse at about the free-fall rate, fragment and possibly form stars while larger masses may experience a quasi-static contraction phase; they go into free fall only when they reach critical values of radius and mass. The authors evaluated the critical mass 10 between the two regimes that define the fragmentation limit.They also estimated the mass-independent critical size 75 Kpc.
The maximum baryonic mass delimitating the observed cut off of the galaxy distribution in the Hubble diagram is then similar to the theoretical fragmentation limit of galaxies. This clarifying explanation of the - relation is very simple. Moreover the corresponding critical size 75 Kpc remarkably fits the typical diameter of Ly haloes (150 Kpc) surrounding active radio galaxies. The value at 0 is also dynamically confirmed by measurements of masses of nearby galaxies.
This correspondance between the various mass estimates emphasizes the robustness of mass determination using -band stellar luminosities. This method of mass determination is thus potentially appropriate to all deep galaxy surveys which may improve our knowledge of mass evolution at high .
The limit for radio galaxies is also estimated from observations, up to 4 (Fig. 4), implying strong constraints on galaxy evolution models. The most massive galaxies which reach the fragmentation limit at 4 formed their stellar mass within 1Gyr. This time-scale is too short to form the stellar mass by the hierarchical merging of initial building blocks as predicted by the CDM model. However these objects might be rare and their mode of formation exceptional. On the other hand, because distant radio galaxies are known to be in a dense medium of already evolved and luminous (masses ?) galaxy companions, the self-gravitational model may efficiently accumulate several 10 within 1 Gyr if the cooling process is highly efficient: the dissipation by strong emission lines of the huge (diameter of 150 Kpc) ionized cocoon of the radio galaxies may explain the cooling efficiency at high redshifts. Chokshi (1997) already evoked the Rees & Ostriker (1977) models to interpret distant radio galaxies, relating them to large density fluctuations undergoing isothermal free-fall and regulated by cooling H and He line emission. Her interpretation suggested intense stellar formation triggered by the radio jet. The present analysis of the Hubble -diagram that confirms large stellar populations in distant radio galaxies is unable to affirm that massive star formation was triggered by the radio jet, in the AGN environment or outwards from the overpressured cocoon. Only high spatial resolution on extended radio galaxies will help to clarify such hypotheses.
6 Masses of radio galaxy hosts
In the literature, the stellar masses of radio galaxy hosts are tentatively related to their radio power: as an example, spheroids of stellar masses greater than 4 10 are more frequently observed in radio-loud than in radio-quiet galaxies (McLure & Dunlop, 2002). Willott et al. (2003) found systematic differences between the -band magnitude distributions in the Hubble diagram of the 7C, 6CE, 6C* and 3CR catalogues of increasing radio-power. The 7C distribution is 0.55 mag fainter than the 3CR at all redshifts. Note that such a -band magnitude difference at all redshifts means in our interpretation an average mass difference between the two catalogues. Fig 8 shows the respective mass distributions of the 3CR catalogue (empty histogram) and of the 7C catalogue (grey line histogram) computed with our models. The two distributions are limited by the mass limit 10, confirming that the limit is independent of radio power. The more radio-powerful 3CR catalogue is on average more massive (11.7 Log ()12.1) than the less powerful 7C catalogue (11.5 Log () 12.0). The respective peaks of the two distributions differ by 0.2, corresponding to a variation of 2 10. The variation is not significantly sensitive to cosmological or IMF effects.
The stellar and baryonic mass estimates from -band luminosities with the help of evolution models is limited by uncertainties. According to Fig. 6, the predicted sequences computed with the open and standard universes are compatible with observations within 10% at the highest . As previously analyzed, the stellar masses of ellipticals vary within 10% depending on the adopted IMF. Another source of uncertainty at high redshifts is the calibration at =0. Depending on templates that are either the brightest cluster members or averaged elliptical galaxies, the uncertainty may reach 10%. Strong emission lines at precise redshifts are seen in the Hubble diagram so that they require a special fitting procedure. More uncertain is the nebular continuum of radio sources observed in the blue band (rest frame), not modelled in elliptical galaxies. On the basis of starburst models, it may be lower than 20% at 4. The global uncertainty on the upper limit of baryonic mass of galaxies given by models is 50%. That implies = 1 0.5 10. For less luminous galaxies, the accuracy will depend on evolutionary scenarios by types.

7 Discussion
The main results obtained in this analysis are the following: first, the - relation is due to the galaxy mass limit 10; second, fitting the - sequence corresponds to the fragmentation limit predicted by gravitational models; finally, we are able to identify massive galaxies of 10 at redshifts 4. The mass limit from Rees & Ostriker, (1977) based on dynamical arguments validates the baryonic mass determination based on the -band luminosity.
-
•
Estimates are obtained using star formation scenarios with infall from the baryonic halo, winds, active and passive stellar evolutions. The star formation rate is proportional to the gas amount. We confirm that only the star formation scenarios of elliptical galaxies are able to reproduce the stellar populations of the most powerful radio galaxy hosts. The robustness of our model PÉGASE is to predict colors and SEDs of the typical observed templates at . Statistical values of such colors were estimated after corrections (inclination, extinction, aperture) by Fioc & Rocca-Volmerange (1999b). Scenarios of star formation, galactic winds, infall, also respecting metal and dust evolution constraints in PÉGASE, allow us to predict the details of the evolution of the various mass components (Fig 3).
Previous studies already tested the validity of the scenarios at higher . The to multi-spectral faint galaxy counts from the HDF-N and Hawaii surveys were fitted with these scenarios (Fioc & Rocca-Volmerange 1999a). Another constraint of the validity of the scenarios is given by the photometric redshifts computed with the code -. Used as high templates, evolutionary scenarios give photometric redshifts close to spectroscopic redshifts with 0.1 (Le Borgne & Rocca-Volmerange 2002).
Does the observed dispersion of the - relation weaken our results? One fundamental property of the relation is its uniformity (Lilly & Longair, 1984) with an increase of the dispersion at redshifts 2 (Eales et al., 1997; Lacy et al., 2000). McCarthy et al. (1999) compared the present samples (3CR, 6C and NIRC) to the Molonglo (MRC/1Jy) sample, complete in the sense of containing 99% of all sources above its flux limit (S 0.95 Jy). The authors conclude to the consistency of the 3CR, MRC and 6C samples within 1 at . At higher , Willott et al.(2003) combine the 6C, 6C* samples and the 7C sample, complete above the flux limit (S 0.5 Jy) in three regions of the sky. They confirm the homogeneity of the stellar populations formed at high and following a passive evolution. The variation from =0.05 to 3 is lower than 5%, in agreement with Jarvis et al. (2001). They also found that the interpretation by using two models (no-evolution and =5 ) are not in agreement with the data. We do not study them in the present paper. Their conclusion is that the decrease of radio galaxy masses at high redshifts is small, presuming a very rapid evolution for radio sources at high .
-
•
Regarding the debate on the IMF as the explanation for divergences between observables and models, we confirm that magnitudes are faintly sensitive to the IMF (Tinsley, 1972). However a reasonable value of the lower mass is essential since the bulk of stars appearing in the -band at =0 is made up of low mass stars. The value of 0.1 , adopted for all IMFs, is compatible with the data and with theoretical star formation principles. By respecting this constraint on the lower star limit, changing the IMF (including top-heavy) slope will not significantly modify our conclusions within the error bars.
-
•
Remarks about the comparison of dissipative collapse and hierarchical merging scenarios are still preliminary. However, some general ideas may be derived from our conclusions. Stellar masses predicted at for ellipticals and spirals (respectively 55 and 45 of the initial cloud of mass ) are in agreement with typical values for nearby field galaxies. They range from 10 for dwarf to 10 for giant galaxies. Field galaxies correspond to long time-scales ( 10 Gyr) of less massive clouds, which may reach by hierarchical merging a final mass of , the fragmentation limit. The time-scales of mass accumulation, gas depletion and star formation of massive ellipticals at high are, however, incompatible with building blocks of 10, proposed by the CDM model. Our results cannot exclude some merging process of massive (a few 10) blocks in the dense environment of radio galaxies or proto-clusters.
-
•
Is the presence of black holes in radio sources linked to host elliptical formation? To interpret massive elliptical galaxies at high requires the accumulation of the dynamical mass on a short time-scale. It was suggested that the embedded black hole is associated with a rapid mass accumulation and star formation process. The more massive the black hole, the deeper the potential wall; this does not necessarily favor short time-scales for accumulation of baryonic and stellar mass in the environment of the potential wall. In the absence of a magnetic flux, a massive cloud evolves as a single unit, after having shed its angular momentum via instabilities. The dense environment may favor the apparition of a black hole (Silk & Rees, 1998). The high density of galaxy companions within the ionized halos of distant radio galaxies (of critical size 150 kpc) has been shown by integral field spectroscopy (Rocca-Volmerange et al., 1994), and narrow-band imaging of the Ly line (Kurk et al., 2003). Moreover the interactive rôle of a radio jet to trigger star formation is still a debated subject. Such an hypothesis is favored by the observational relations between black hole masses and absolute blue luminosities or velocity dispersion (Ferrarese & Merritt, 2000; Gebhardt et al. 2000; Magorrian et al. 1988). However it is too early to identify the nature of the relation between stellar and black hole masses (McLure & Dunlop, 2002). The bulk of star formation could happen during the free-fall time while the active nucleus is fueled. The black hole and the stellar mass would then simultaneously grow; details of such processes would, however, need clarification.
Recent deep X-ray surveys which follow the evolution of accretion onto supermassive black holes confirm two modes of accretion and of black hole growth. While the rare, high luminosity QSOs could form rather early in the universe, a late evolution of low-luminosity Seyfert populations is required by observations (Hasinger et al., 2003). Because high luminosity QSOs are embedded in massive elliptical galaxies while low-luminosity Seyfert galaxies are preferentially found in spiral galaxies, the two modes of star formation derived from the -band Hubble diagram can be related to the two accretion modes derived from X-rays. Moreover the -band Hubble diagram of sub-mm and hyperluminous galaxies (Serjeant et al. , 2003) recently confirms that the location of galaxies on the - relation may be related to the presence of the most massive AGNs, in perfect agreement with our conclusions.
A new factor of uncertainty could be the ultra-violet continuum of radio sources. However because galaxies are observed in the band, only radio galaxies at 4 will be affected by this effect.
Complementary constraints are awaited from improved spatial resolution (morphology, surface brightness, velocity fields). The surface brightness fading biases high observations towards bulges rather than disks. This may explain why, at 4, field galaxies appear on lower Mbar sequences (109 to 10) than radio galaxies of high surface brightnesses. We may also evoke the high density of galaxies within their diameter-limited sample to explain massive 10 radio sources at high redshift. Only a better spatial resolution, as given by integral field units on the new generation of telescopes, will clarify the spatial confusion of the central radio galaxy and its galaxy companions.
The baryonic mass predicted by our modeling of luminosity evolution is a minimal value. From Fig. 3 at 0 (14 Gyr), a mass fraction (35 % for ellipticals, 10% for spirals) is still in the halo. The galaxy halo could also contain another baryonic component (such as hot gas), not taken into account in our mass budget.
8 Conclusion
The main results of this analysis are the following:
i) Stellar masses of galaxies, and the corresponding baryonic masses of their progenitor clouds, are estimated from the luminosities at any using robust scenarios of star formation evolution.
ii) The brightest luminosity limit of the Hubble diagram corresponds to the most massive elliptical galaxies of baryonic masses M 10 (about 55 % is in stellar mass at =0). These are the typical hosts of powerful radio galaxies.
iii) The maximum limit of baryonic mass M 10 , estimated from the stellar luminosity in the -band, corresponds to the dynamical parameter Mcrit, the fragmentation limit of the cooling-gravitation balance of a self-gravitating cloud. This confirms the validity of the mass estimates from evolution scenarios.
iv) Radio galaxies of 10 are found at 4 with star formation and mass accumulation time-scales shorter than 1Gyr. The radius of the ionized cocoon is about =75kpc. Such extreme time-scales in powerful radio galaxies suggest that the formation of a massive black hole embedded in the host galaxy is not independent of the star formation process.
v) The choice of the IMF slope is not crucial but the lower star mass needs to be 0.1 to form the bulk of low mass stars observed in templates of elliptical galaxies at =0.
vi) Galaxy deep surveys are covered by sequences of lower baryonic masses from Mbar= 109 to 10 in which the evolution by hierarchical merging, if it is proven, remains however mass limited by fragmentation.
For the future, we will need to apply such a method of mass determination
to the galaxy populations of large surveys, in particular discovered
either by
SIRTF or by the ground-based 10m telescopes in the stellar infra-red
to follow the evolution processes of galaxies.
Acknowledgements.
We would like to warmly thank the referee Carol Lonsdale for her constructive and detailed comments. European Community programmes (Marie-Curie fellowship for CdB and TMR POE fellowship for EM) helped significantly to achieve the present work.References
- (1) Baron, E., White, S., 1987, ApJ, 322, 585
- (2) Chokshi, A., 1997, ApJ, 491, 78
- (3) Cohen, J., Hogg, D., Blandford, R. D., et al., 2000, ApJ, 538, 29
- (4) Cowie, L. L., Songaila, A., Barger, A.J, 1999, ApJ, 118, 603
- (5) De Breuck, C., 2000, PhD thesis, Leiden University
- (6) De Breuck, C., van Breugel, W., Stanford, S.A., et al., 2002, AJ, 123, 637
- (7) Dey, A., Spinrad, H., 1996, ApJ, 459, 133
- (8) Dickinson, M., Papovich, C., Ferguson, H.C. et al., 2003, ApJ, 587, 25
- (9) Eales, S., Rawlings, S., 1996, ApJ, 460, 68
- (10) Eales, S., Rawlings, S., Law-Green, D., Cotter, G., Lacy, M., 1997, MNRAS, 291, 593
- (11) Egami, E., Armus, L., Neugebauer, G. et al., 2003, AJ, 125, 1038
- (12) Fernández-Soto, A., Lanzetta, K., Yahil, A., 1999, ApJ, 513,34
- (13) Ferrarese, L., Merritt, D., 2000, ApJ, 539, L9
- (14) Fioc, M., 1997, Thèse de l’Université Paris-Sud, Orsay
- (15) Fioc, M., Rocca-Volmerange, B., 1997, A&A, 326, 950
- (16) Fioc, M., Rocca-Volmerange, B., 1999a, A&A, 344, 393
- (17) Fioc, M., Rocca-Volmerange, B., 1999b, A&A, 351, 869
- (18) Fioc, M., Rocca-Volmerange, B., 1999c, astro-ph/9912179
- (19) Gebhardt, K. et al., 2000, ApJ, 539, L13
- (20) Genzel, R., Baker, A., Tacconi, L., et al., 2003, ApJ, 584, 633
- (21) Gibson, B. K., Matteucci, F., 1997, MNRAS, 291, L8
- (22) Hasinger, G., et al. , 2003, AIP Conf.Proc. 666, 227
- (23) Hu, E., et al., 2002, ApJ, 568, L75 c
- (24) Jarvis, M., et al., 2001, MNRAS, 326, 1585
- (25) Inskip, K., Best, P., Longair, M., et al., 2002, MNRAS, 329, 277
- (26) Kodaira, K., et al., 2003, astro-ph/0301096
- (27) Kukula, M. J., Dunlop, J. S., McLure, R. J., 2002, NewAR, 46, 171
- (28) Kurk, J., Venemans, B., Rottgering, H., Miley, G., Pentericci, L., astroph/0309675
- (29) Lacy, M., Bunker, A. J., Ridgway, S. E., 2000, ApJ, 120, L68
- (30) Laing, R., Riley, J., Longair, M., 1983, MNRAS, 204, 151
- (31) Le Borgne, D., Rocca-Volmerange, B., 2002, A&A, 386, 446
- (32) Longair, M. S., Lilly, S.J., 1984, JApA, 5, 349
- (33) McLure, R.J., Dunlop, J., 2002, MNRAS, 331, 795
- (34) McCarthy, P., 1999, “The most distant radio galaxies”, Eds H. Röttgering, P. Best, M. Lehnert, Amsterdam, VNE 49, p.5
- (35) Magorrian, J., et al., 1998, AJ, 115, 2285
- (36) Papovich, C., Dickinson, M. Ferguson, H., 2001, ApJ, 559, 620
- (37) Pentericci, L., McCarthy, P., Röttgering, H., et al., 2001, ApJS, 135, 63
- (38) Rana, N. C., Basu, S., 1992, A&A, 265, 499
- (39) Rees, M., Ostriker, J., 1977, MNRAS, 179, 541
- (40) Ridgway, S.E., Heckman, T.M., Calzetti, D., Lehnert, M., 2001, ApJ, 550, 122
- (41) Rocca-Volmerange, B., 2001, “The mass of galaxies at low and high redshifts”, Bender, R., Renzini, A. Eds, Springer, p. 246
- (42) Rocca-Volmerange, B., Adam, G., Ferruit, P., Bacon, R., 1994, A&A, 292, 20
- (43) Salpeter, E. E., 1959, ApJ, 129, 608
- (44) Saracco, P., Longhetti, M., Giallongo, et al., 2003, astro-ph/0310131
- (45) Serjeant, S., Farrah, D., Geach, J. et al., astroph-0310661
- (46) Silk, J., 1977, ApJ, 211, 638
- (47) Silk, J., Rees, M.J., 1998, A & A, 331, L1
- (48) Songaila, A., Cowie, L., Hu, E., et al., 1994, ApJS, 94, 461
- (49) Tinsley, B.M., 1972, ApJ, 178, 319
- (50) van Breugel, W., Stanford, S., Spinrad, H., et al., 1998, ApJ, 502, 614
- (51) van Ojik, R., et al., 1996, A&A, 313, 25
- (52) Venemans, B. P., et al., 2002, ApJ, 569, 11
- (53) Williams, R.E., et al., 1996, AJ, 112, 1335
- (54) Willott, C., Rawlings, S., Jarvis, M., et al., 2003, MNRAS, 339, 173
- (55) Zirm, A. W., Dickinson, M., Dey, A., 2003, ApJ, 585, 90