A Face–On Tully-Fisher Relation
Abstract
We construct the first “face-on” Tully-Fisher (TF) relation for 24 galaxies with inclinations between 16∘ and 41∘. The enabling measurements are integral-field, echelle spectroscopy from the WIYN 3.5m telescope, which yield accurate kinematic estimates of disk inclination to . Kinematic inclinations are of sufficient accuracy that our measured TF scatter of 0.42 mag is comparable to other surveys even without internal-absorption corrections. Three of four galaxies with significant kinematic and photometric asymmetries also have the largest deviations from our TF relation, suggesting that asymmetries make an important contribution to TF scatter. By measuring inclinations below 40∘, we establish a direct path to linking this scatter to the unprojected structure of disks and making non-degenerate dynamical mass-decompositions of spiral galaxies.
1 Introduction
One common characteristic of Tully-Fisher (TF; Tully & Fisher 1977) studies of the relation between luminosity and rotation speed is the selection of spiral galaxies with inclinations () above , and typically with . The inability to determine accurate and precise inclinations for galaxies with has limited studies attempting to link structural parameters, such as lopsidedness and ellipticity, to TF scatter (Franx & de Zeeuw 1992, Zaritsky & Rix 1997). Likewise, combining vertical stellar velocity dispersions and disk rotation speeds has been thwarted for lack of precise inclinations for nearly face-on galaxies (e.g., Bottema 1997). Hence, non-degenerate dynamical mass-decompositions of galaxies have not yet been made.
One solution to the above problems is to use nearly face-on galaxies to study the TF relation. Here the detailed planar structure of the disk can be studied unprojected, while the vertical component of the disk stellar velocity dispersion is favorably projected. The problem is now observational: How can accurate and precise inclinations be measured for small inclination angles?
For most TF studies, inclinations are calculated from photometric axis-ratios, assuming circular disks, and correcting for a constant, intrinsic flattening (e.g. Tully & Fouqué 1985; Courteau 1996). Bars, spiral structure, and intrinsic ellipticity cause systematic errors in photometric inclination and position angles (PA), dominate the apparent ellipticity at low inclination, and skew apparent inclinations to larger values (Andersen et al. 2001; Courteau et al. 2003). Hence there is a triple penalty at low inclinations for TF studies: (1) Erroneously large inclinations lead to under-correcting the velocity projection. (2) Random errors diverge since photometric disk axis ratio measurements have constant errors as a function of axis ratio. (3) For long-slit studies, PA-mismatch will always yield systematic underestimates of the projected rotation speed.
These pitfalls can be mitigated if kinematic inclinations are derived from two-dimensional velocity fields (e.g., Schommer et al. 1993; Verheijen 2001) because disk scale heights are irrelevant, and velocity fields between 1 and 3 scale lengths are typically less aberrated than the light distribution by spiral structure, bars or warps (Courteau et al. 2003; Briggs 1990). A limit of had been set on the minimum derived kinematic inclinations for nearby galaxies from HI maps (Begeman 1989), but this minimum value is not fundamental; it is notionally adopted as such.
We have discovered that kinematic inclinations, derived from high-quality, optical kinematic data collected with integral field units, are sufficiently accurate and precise to construct a TF relation at inclinations as low as 15∘. In this letter we present an analysis of the first TF relation for a sample of nearly face-on galaxies.
2 The Photometric and Kinematic Data Set
We obtained and -band images and H velocity fields of 39 spiral galaxies meeting the criteria of Andersen et al. (2001): Galaxies appear nearly face-on (), are of intermediate type (Sab-Sd), with no clear signs of interactions, bars or rings, and are in regions of low Galactic extinction. Our sample and observations are described in Andersen (2001).
CCD images were acquired over 17 nights between May, 1998 and January, 2001 at the WIYN 3.5m111The WIYN Observatory is a joint facility of the U. of Wisconsin-Madison, Indiana U., Yale, and NOAO., the KPNO 2.1m, and the McDonald Observatory 2.7m telescopes. Total magnitudes are defined as asymptotic fluxes, as measured from growth curves, calibrated on the Kron-Cousins system using Landolt (1983) standards observed on four photometric nights. Zeropoints for other nights are internally boot-strapped, where possible, from repeat observations. We use km s-1 Mpc-1 and correct magnitudes for Galactic absorption (Schlegel, Finkbeiner & Davis 1998). (Virgo in-fall affects recession velocities by 1%; Paturel et al. 1997.) We use the mean color of mag for our calibrated sample to estimate the magnitude for several galaxies with only accurate -band photometry, and add the 0.08 mag range in in quadrature as an additional uncertainty for these sources.
H velocity fields were obtained at an instrumental resolution of using the DensePak integral field unit (Barden, Sawyer & Honeycutt 1998) on the WIYN 3.5m telescope over 11 nights between May, 1998 and January, 2000. [PGC 56010, a low surface-brightness galaxy, was re-observed using SparsePak (Bershady et al. 2003) in May, 2001.] The H emission lines were resolved, with typical signal-to-noise levels of and centroid precision of km s-1. DensePak observations yield velocity centroids for independent positions within each galaxy out to 2.2 to 5.8 disk scale lengths (typically 3.3).
3 Measuring Inclinations Below
The most critical measurement required to construct a “face-on” TF (FOTF) relation is the derivation of accurate and precise disk inclinations. As we have argued, there are fundamental reasons why two-dimensional kinematic maps provide the only viable data for measuring these inclinations. Using a method similar to that described in Andersen et al. (2001), we fit the DensePak data with a single, hyperbolic-tangent velocity-field model. From these fits, we derive measurements of kinematic inclinations, rotation speeds (), and recession velocities for our sample.
Of the 39 galaxies in our sample we measure reliable deprojected rotation velocities, , for 26 (see Table 1; two galaxies lacking calibrated and -band magnitudes are excluded). This subsample has km s-1 with inclinations and errors from 16∘ to 41∘. Ten additional galaxies have measured, deprojected rotation velocities, but kinematic inclinations consistent with zero within 68% confidence intervals. Their mean inclination is . Three remaining galaxies have no projected circular velocity field; they appear truly face-on. Our results paint a consistent picture of being able to measure inclinations reliably down to .
Why can we measure accurate inclinations for nearly face-on galaxies? For disks with inclinations between and , the peak difference in projected velocity is only 2 to 3 km s-1 between disks with inclinations differing by 5∘. To measure this difference requires km s-1 centroiding precision per fiber, or many samples of the velocity field at a precision at least comparable to this difference. The latter, which we achieve, is preferable because of random motions. We find typically 3 km s-1 rms variations between our model and the data (Andersen 2001).
Historically, HI data have been claimed to be of insufficient quality for deriving galaxy inclinations below 40∘ (Begeman 1989). One aspect of the problem has been that tilted ring models include a weighting scheme which, when typically implemented, minimizes the importance of velocity measurements at azimuthal angles which are most influenced by changes in inclination. For example, Begeman’s simulations use a weighting scheme, where is the angle from the major axis in the galaxy plane. This weighting is done to minimize the effects of warps, but in so doing over half of the signal is thrown out. For the same reason, data are often not considered beyond of 30∘ or 45∘, throwing out yet more of the signal.
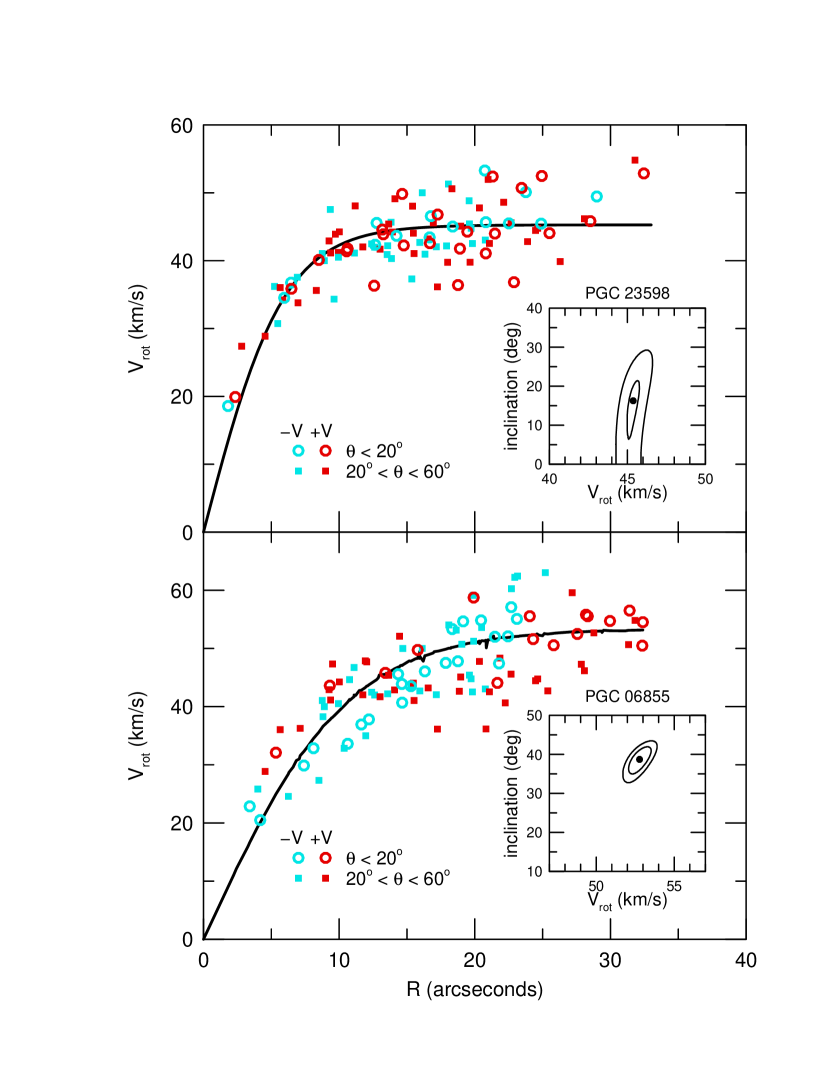
Our DensePak observations sample the inner disks of galaxies, where warps tend to be negligible. Hence we can use the entire velocity field to maximize the influence of inclination in the model velocity fields. Figure 1 shows deprojected position-velocity diagrams for two representative galaxies in different bins of . Excellent agreement between azimuthal bins indicates a good model fit and lack of systematics. We find bidimensional echelle spectroscopy to be of sufficient quality to yield deprojected rotation velocities, at precisions better than 10% at inclinations above 28∘; a 20% precision on is reached for inclinations of .
4 FOTF vs Conventional TF Relations
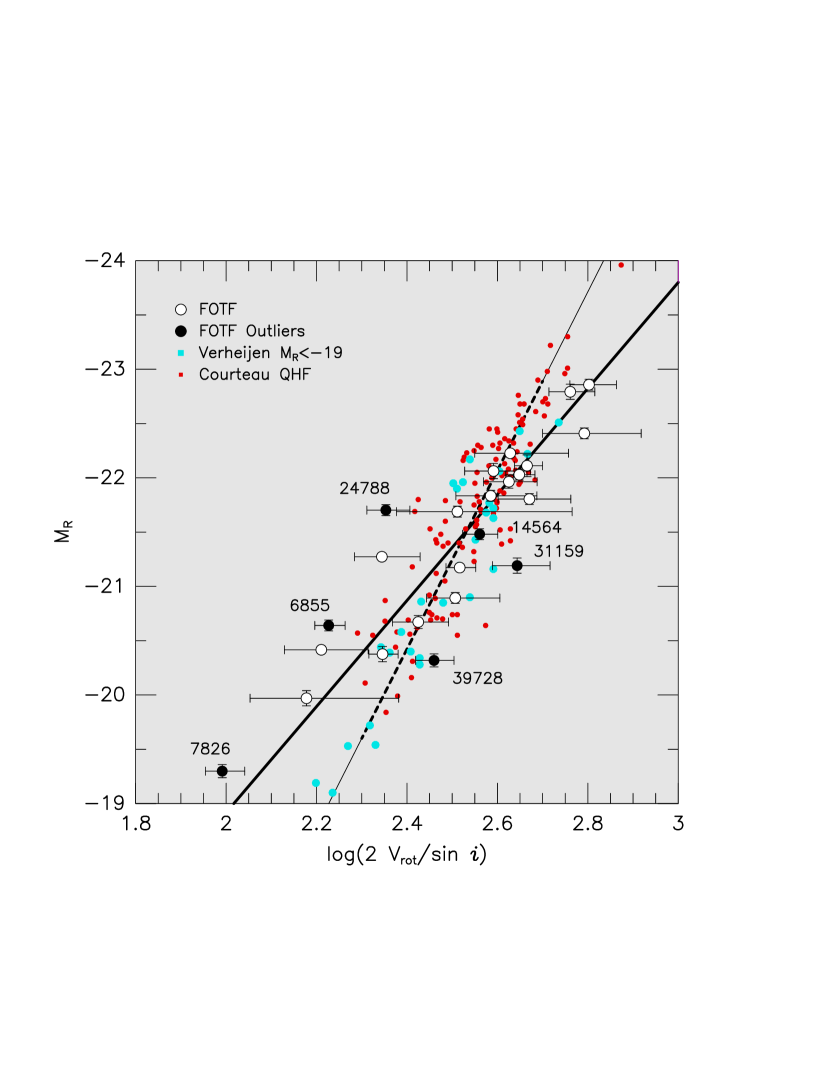
To evaluate our FOTF data, we compare to the TF samples of Courteau (1997) and Verheijen (2001). The salient difference between our sample versus Courteau’s and Verheijen’s is that their galaxies have and . Courteau’s sample shares comparable scale lengths, colors, surface brightnesses, distances and uses spatially-resolved H long-slit emission as the kinematic tracer. We use the cleaner “Quiet Hubble Flow” (QHF) subset of Courteau’s sample and convert Courteau’s Lick -band photometry to Cousins -band using (Fukugita et al. 1995). Verheijen collected multi-band (including Cousins -band) photometry and HI synthesis maps for a volume-limited sample from the nearby Ursa Major cluster. We select the Ursa Major subsample with , corresponding to the faint end of the FOTF and Courteau samples, and adopt the HST Key Project distance (Sakai et al. 2000). Both Courteau and Verheijen use an internal-absorption correction of the form which minimizes the apparent TF scatter. (We have subtracted from Courteau’s data his zeropoint correction of 0.40 mag, which corresponds to his absorption correction at .) Since our sample is nearly face-on, we apply no internal-absorption corrections to our photometry.
An inspection of the three samples in versus of Figure 2 highlights the differences and similarities in their TF relations. There is excellent agreement between the Courteau and Verheijen TF slopes and zeropoints. There is also an excellent agreement in the zeropoint of the FOTF with Verheijen and Courteau TF relations near L* at , but the shallower slope of the FOTF appears striking. However, slopes vary between and for both the Courteau and Verheijen samples depending on the method of velocity measurement, the extinction correction prescription and the sample selection. Verheijen (2001) notes the above absorption corrections steepen TF slopes. However, these corrections do not alter the slope of the FOTF relation. While empirical corrections (e.g., Giovanelli et al. 1994, Tully et al. 1998) work well for galaxies with , the corrections for galaxies with are small ( mag). Since in practice one can systematize velocity measurements, a larger FOTF spanning a broader range in luminosity may provide a new test of the veracity of TF-based internal-extinction corrections.
When we restrict our sample by luminosity or , we find slopes between -5 and -8; a FOTF subsample with shares the same slopes and zeropoints as the Courteau and Verheijen culled samples (Figure 1). This implies that only the extreme rotators, fast and slow, differ. This may be due to luminosity-dependent extinction corrections discussed above. It is more difficult to present a plausible systematic error whereby the high luminosity objects rotate faster and the low luminosity objects rotate slower, and the intermediate objects are unaffected. However, with only six galaxies in these regimes, the discrepancy between slopes may be influenced by our small-number statistics coupled with relatively large errors on .
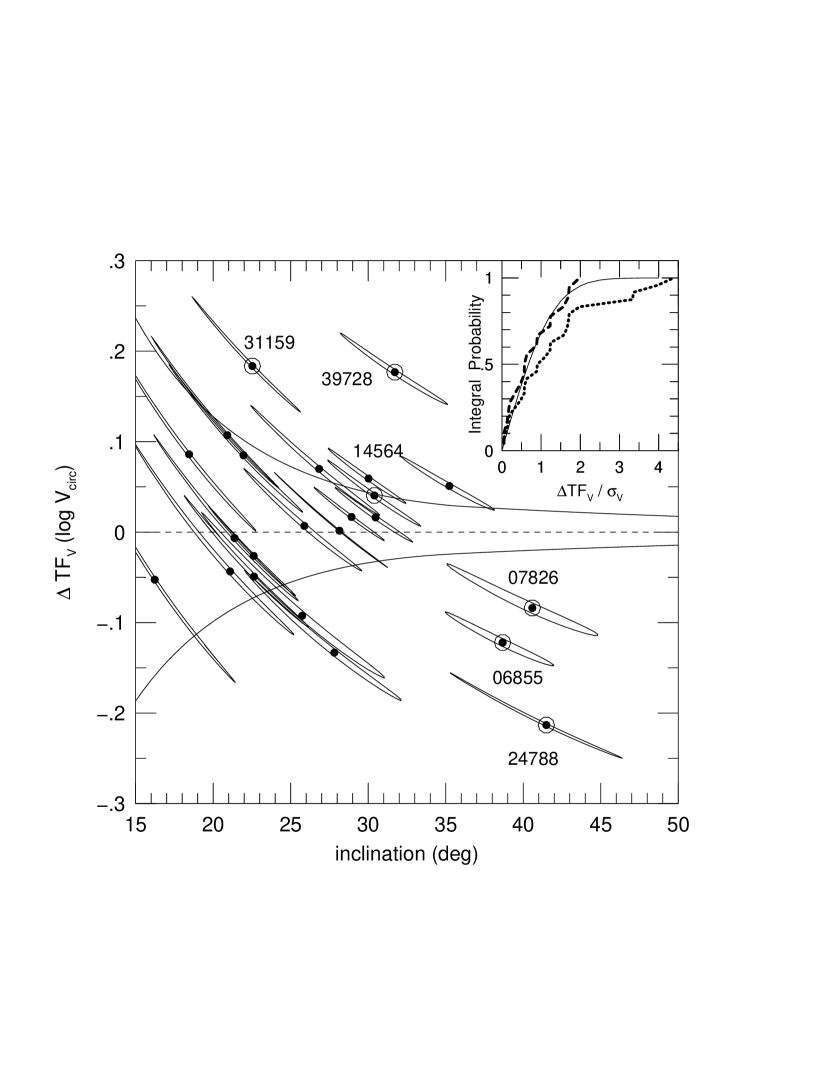
If the FOTF is to be a useful tool for studying internal extinction or, e.g., correlations of galaxy properties to TF scatter, the impact of inclination measurements on TF residuals needs to be examined. Figure 3 shows the relation between TF residuals and inclination along with the predicted envelope of TF residuals introduced by inclination error. We find the scatter for our sample is comparable to the scatter in the culled Courteau and Verheijen samples: 0.42 mag for ours versus 0.38 mag for the Verheijen and Courteau samples used here, each about their respective regressions (Figure 2). Six galaxies labeled in Figures 2 and 3 are noted in Table 1 as either being photometrically or kinematically asymmetric, or having small recession velocities (hence uncertain distances). Inclination errors alone aren’t the cause of their large TF residuals. Removing these six galaxies, the scatter for our face-on sample about its shallow regression drops significantly to 0.3 mag, and is consistent with our measurement errors.
5 SUMMARY AND DISCUSSION
We have presented a TF relationship for 24 galaxies with a mean inclination of 26∘ – the first time the TF relation has been measured for a sample of galaxies with inclinations less than . Accurate and precise kinematic inclinations are the key to studying TF relation at low inclination, and velocity fields are the essential ingredient for their measurement. We are able to construct this FOTF relation from integral-field H velocity fields for four primary reasons: (1) DensePak and SparsePak are efficient for gathering H velocity fields with moderately high spatial resolution and medium spectral resolution at high signal to noise. (2) H velocity fields generally extend out to disk scale-lengths so that warping, which dominates the outer radii of some galaxy disks, is unimportant. (3) Instead of using multiple tilted rings, we successfully fit galaxy disks with a single velocity-field model, simultaneously using data at all radii and phase angles. (4) We equally-weight all data, making our fits sensitive to the signal constraining inclination, which peaks in the velocity field at from the major axis.
The FOTF relation measured from our data has a zeropoint and scatter comparable to conventional TF relations but possibly a shallower slope. The bulk of the FOTF scatter is consistent with measurement errors, as found by Verheijen (2001). Of the four galaxies which show large kinematic and photometric asymmetries, three fall well off the TF relation. While our statistics are small, this is consistent with the claim by Barton et al. (2000) that kinematic asymmetries are an important source of TF scatter.
The FOTF can play an important role in understanding the nature and interpretation of the TF slope, zeropoint and scatter in three ways. First, internal extinction is less important for face-on galaxies minimizing inclination-dependent effects. For inclined TF samples, if correlated errors exist between de-reddened luminosities and de-projected rotation-speeds, TF scatter will be increased. If extinction depends on luminosity or velocity (mass), the corrected TF slopes may differ from their true values.
Second, measurements of asymmetry, ellipticity, and lopsidedness ideally are made at low inclinations. Several studies have suggested non-axisymmetric dark halo mass distributions such as lopsidedness (Zaritsky & Rix 1997; Swaters et al. 1999) or ellipticity (Franx & de Zeeuw 1992; Andersen et al. 2001) could be sources of TF scatter. However, without access to inclination measurements for face-on systems, these claims could not be directly evaluated. Our small FOTF sample suggests such links are possible, and show that such studies can now be pursued wholesale.
Finally, the mass-to-light ratio of spiral disks is an essential ingredient for interpreting the TF zeropoint, slope, and scatter. Only limits can be placed on mass decompositions (Bell & de Jong 2001) without direct dynamical estimates of total and disk mass. This can be accomplished via rotation curves and vertical stellar velocity dispersions of disks. The latter are best measured in face-on systems, and hence the FOTF unlocks the door for determining the fundamental mass-budget of spiral galaxies.
References
- (1) Akritas, M.G. & Bershady, M.A. 1996, ApJ, 470, 706
- (2) Andersen, D. R. 2001, Ph.D. thesis, Penn State University
- (3) Andersen, D.R., Bershady, M.A., Sparke, L.S., Gallagher, J.S. & Wilcots, E.M. 2001, ApJ, 551, 131
- Barden et al. (1998) Barden, S. C., Sawyer, D. G., & Honeycutt, R. K. 1998, SPIE, 3355, 892
- (5) Barton, E.J., Geller, M.J., Bromley, B.C., van Zee, L., Kenyon, S.J. 2001, AJ, 121, 625
- (6) Begeman, K. 1989, A&A, 223, 47
- (7) Bell, E.F. & de Jong, R.S. 2001, ApJ, 550, 212
- (8) Bershady, M.A., Andersen, D.R., Verheijen, M.A.W., W, K.B., Crawford, S.M., & Swaters, R.A. 2003, ApJS submitted
- (9) Bottema, R. 1997, A& A, 328, 517
- (10) Briggs, F.H. 1990, ApJ, 352, 15
- (11) Courteau, S. 1996, ApJS, 103, 363
- (12) Courteau, S. 1997, AJ, 114, 2402
- (13) Courteau, S., Andersen, D.R., Bershady, M.A., MacArthur, L.A., Rix, H.-W. 2003, ApJ, 594
- Franx & de Zeeuw (1992) Franx, M. & De Zeeuw, T. 1992, ApJ, 392, L47
- (15) Fukugita, M., Shimasaku, K. & Ichikawa, T. 1995, PASP, 107, 945
- (16) Giovanelli, R., Haynes, M.P., Salzer, J.J, Wegner, G., da Costa, L.N., Freudling, W. 1994, AJ, 107, 2036
- (17) Landolt, A.U. 1983, AJ, 88, 853
- (18) Paturel, G. et al. 1997, A&AS, 124, 109
- (19) Sakai, S., et al. 2000, ApJ, 529, 698
- (20) Schlegel, D.J., Finkbeiner, D.P., Davis, M. 1998, ApJ, 500, 525
- (21) Schommer, R.A., Bothun, G.D., Williams, T.B. & Mould, J.R. 1993, AJ, 105, 97
- (22) Swaters, R.A., Schoenmakers, R.H.M., Sancisi, R., van Albada, T.S. 1999, MNRAS, 304, 330
- Tully & Fisher (1977) Tully, R.B. & Fisher, J.R. 1977, A&A, 54, 661
- (24) Tully, R.B. & Fouqué, P. 1985, ApJS, 58, 67
- (25) Tully, R.B., Pierce, M.J., Huang, J.-S., Saunders, W., Verheijen, M.A.W., Witchalls, P.L. 1998, AJ, 115, 2264
- (26) Verheijen, M.A.W. 2001, ApJ, 563, 694
- Zaritsky & Rix (1997) Zaritsky, D. & Rix, H.-W. 1997, ApJ, 477, 118
| PGC | (deg) | (km s-1) | (mag) |
|---|---|---|---|
| 2162 | 25.8 | 81.2 | -20.42 |
| 3512 | 30.1 | 164.3 | -21.17 |
| 5673 | 21.0 | 160.6 | -20.89 |
| 6855a | 38.8 | 84.3 | -20.64 |
| 7826b | 40.7 | 49.0 | -19.30 |
| 14564a | 30.5 | 181.8 | -21.48 |
| 16274 | 30.6 | 222.4 | -22.03 |
| 23333 | 26.9 | 133.0 | -20.67 |
| 23598 | 16.2 | 162.3 | -21.69 |
| 24788a | 41.5 | 112.8 | -21.70 |
| 26140 | 28.2 | 317.3 | -22.86 |
| 28310 | 35.3 | 110.9 | -20.38 |
| 31159a | 22.6 | 220.1 | -21.19 |
| 32638 | 22.0 | 234.25 | -21.80 |
| 33465 | 18.6 | 309.8 | -22.41 |
| 36925 | 22.6 | 195.2 | -22.06 |
| 38908 | 26.0 | 211.0 | -21.96 |
| 39728b | 31.8 | 144.2 | -20.32 |
| 46767 | 22.7 | 288.2 | -22.79 |
| 56010 | 26.7 | 75.3 | -19.97 |
| 57931 | 21.5 | 192.4 | -21.83 |
| 58410 | 29.0 | 231.4 | -22.11 |
| 72144 | 27.9 | 110.6 | -21.27 |
| 72453 | 21.2 | 212.4 | -22.23 |