Early results from the VIMOS VLT Deep Survey
Abstract
The VIMOS VLT Deep Survey (VVDS) is underway to study the evolution of galaxies, large scale structures and AGNs, from the measurement of more than 100000 spectra of faint objects. We present here the results from the first epoch observations of more than 20000 spectra. The main challenge of the program, the redshift measurements, is described, in particular entering the “redshift desert” in the range for which only very weak features are observed in the observed wavelength range. The redshift distribution of a magnitude limited sample brighter than is presented for the first time, showing a peak at a low redshift , and a tail extending all the way above . The evolution of the luminosity function out to is presented, with the LF of blue star forming galaxies carrying most of the evolution, with L* changing by more than two magnitudes for this sub-sample.
1Laboratoire d’Astrophysique de Marseille - France, 2Istituto di Radio-Astronomia - CNR, Bologna - Italy, 3IASF - INAF, Milano - Italy, 4Laboratoire d’Astrophysique - Observatoire Midi-Pyrénées, 5Osservatorio Astronomico di Capodimonte, Naples, Italy 6Institut d’Astrophysique de Paris, Paris, France, 7Max Planck fur Astrophysik, Garching, Germany 8Osservatorio Astronomico di Brera, Milan, Italy, 9Osservatorio Astronomico di Roma, Italy, 10Osservatorio Astronomico di Bologna, Bologna, Italy
1. Introduction
Understanding how galaxies and large scale structures formed and evolved is one of the major goals of modern cosmology. In order to identify the relative contributions of the various physical processes at play and the associated timescales, a comprehensive picture of the evolutionary properties of the constituents of the universe is needed over a large volume and a large time base. Samples of high redshift galaxies known today reach less than a few thousand at redshifts , and statistical analysis suffer from small number statistics, small explored volumes, selection biases, which prevent detailed analysis. In the local universe, large surveys like the 2dFGRS and the SDSS, will contain from up to galaxies to reach a high level of accuracy in measuring the fundamental parameters of the galaxies and AGNs populations. Similarly, we need to gather large numbers of galaxies at high redshifts to accurately describe the various populations in environments ranging from low density to the dense cluster cores, and relate the properties observed at different redshifts to identify the main processes driving evolution.
This goal can only be achieved through massive observational programs assembling galaxies and QSO samples representative of the universe at the various look-back times explored. As the observed galaxies are at large distances and therefore very faint, instruments have to be conceived to combine wide field, high throughput, and high multiplex gain in order to efficiently observe large samples. Multi-object spectrographs are routinely in operation since 15 years, and the new generation now in place on the m telescopes, like DEIMOS on the Keck-10m or VIMOS on the VLT-8m, allows to explore large volumes of the distant universe through the observations of many tens of thousand of objects.
Because of this leap forward in instrument performances, several large deep surveys are now in progress. We are presenting here the VIMOS VLT Deep Survey (VVDS). It is combining a common observing strategy to assemble more than 100000 redshifts in 3 large galaxy datasets observed over more than 16deg2 in 5 equatorial fields, selected in magnitude from to . The general strategy of the survey has been presented in e.g. Le Fèvre et al. (2001).
2. Survey observations status
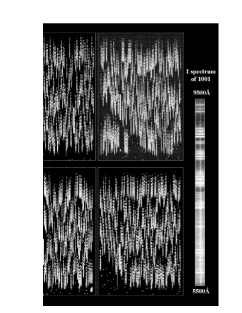
The first survey observations have been conducted during the dark time of November and December 2002. A total of 29 nights have been allocated from the garanteed time, out of which 18 have been clear. The survey priority was set to accumulate as much observations as possible on the VVDS-0226-04 deep field, to a depth . The remaining time was spend on the 2217+00 and the 1002+03 fields, as part of the VVDS-wide survey. Targets have been selected from the deep imaging survey we have conducted in these fields (Le Fèvre et al., 2003). The VIMOS observations have been performed using 1 arcseconds wide slits and the LRRed grism. This provides a spectral resolution of . The length of spectra at this resolution allows to pack on average 350–400 spectra for the “wide” survey on the 4 VIMOS detectors, and 500 to 600 spectra (figure 1) for the “faint” , a key factor to accumulate redshifts in a very efficient way.
For a magnitude limited sample potentialy going to redshifts up to , the choice of the observed wavelength range is difficult: too blue and the rest frame domain around OII-4000 break which contains strong features, disappears from the band already for , too red and the UV domain comes into the band for quite high redshifts. We have compromised with a wavelength domain , which allows to follow [OII] up to , at the expense of having to deal with the faint absorption features present in the rest frame domain corresponding to the redshift range .
A total of 49 pointings (one pointing is a set of 4 masks in each of the 4 VIMOS quadrants) have been observed, and a total of 20741 spectra have been obtained, some objects being observed in two different pointings to measure the redshift measurement errors associated to the observational process.
3. Data processing and redshift measurement
The data processing is conducted in two steps. First the large number of raw data frames are organised in the object data and various calibration categories. This is followed by 2D spectra extraction, sky correction, sum/combine, and then by 1D optimal spectra extraction, wavelength and flux calibration. This is performed very efficiently with the VVDS consortium pipeline VIPGI with a minimum of human interaction (Scodeggio et al., in preparation).
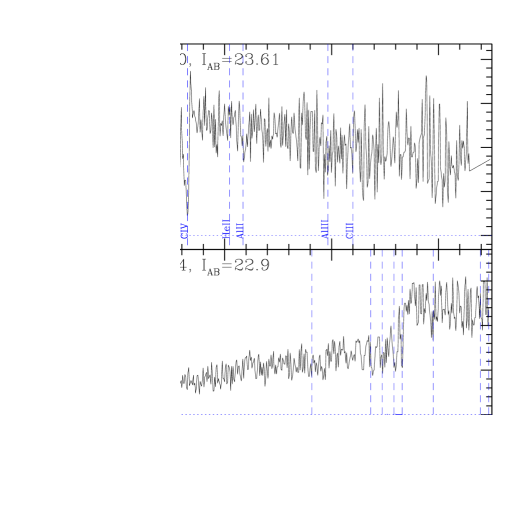
The KBRED environment developed under IDL is then used to compute redshifts (Scaramella et al., in preparation). KBRED is run automatically on the whole sample, followed by systematic examination of each single spectrum by eye in the VIPGI environment. KBRED basically works by cross-correlation of observed spectra with a set of library template spectra followed by a reconstruction of each spectrum on a base of template vectors (Principal Component Analysis, PCA). There are two main limitations for this process to be fully automated. Because the range of possible redshift solutions to explore is large, with objects as diverse as stars, galaxies with redshifts possibly up to z=5 or more, or AGNs, it is essential to assemble as complete as possible a set of star templates, galaxies and AGN templates covering the full rest frame wavelength range from Ly to H, for early to late spectral types. Because of the lack of observed template spectra in the literature in the range between CIV-1548 and OII-3727, critical for redshifts given our wavelength range, we had to devise a scheme to go through this so called “redshift desert”, which is obviously only produced by the observational bias of spectroscopy set-ups. We have taken an iterative approach, creating templates from VIMOS spectra, and updating them along the reduction process as new galaxies are identified at redshifts . This process is helping to significantly reduce the first-pass incompletness, and we are identifying several hundred galaxies beyond z=1.5 (Le Fèvre et al., in preparation). The second limitation is linked to the residuals of the sky subtraction and fringing correction still present in the reduced spectra which produce a noise pattern highly non linear, variable from spectra to spectra. Eye examination of both the 2D and 1D spectra are therefore sometimes required to validate a redshift proposed by KBRED. We are currently working at computing a two 2D noise model in each slit to help reduce this limitation.
Example spectra processed through VIPGI and KBRED are shown in Figures 6 and 7.
4. Redshift distribution to and
The redshift distribution of the sample is presented in Figure 2, the first time such a distribution is observed to this depth. At the time of this writing, this distribution is affected by incompletness above , waiting for a complete treatment of the as yet unidentified spectra as described in the previous section. However, there are two main features to be noted: the mean redshift is , and there is a small but significant high redshift tail of galaxies identified up to z=5. In comparison, our sample shows a mean redshift of (Figure 2). Most semi-analytic models make predictions for a higher mean redshift and a more numerous high redshift tail above z=1.5 for a limited sample. While our current incompletness is most probably caused by objects at as identified from photometric redshifts estimates, unidentified objects cannot significantly affect the mean redshift of the full sample. This is dicussed in more details in Le Fèvre et al. (in preparation).


5. Evolution of the luminosity function
With the current sample, we can compute the luminosity function out to although our current incompletness starts to kick in at . Figure 3 shows the luminosity function of a sample of 4015 galaxies, as a function of redshift out to z=1.5. There is an overall brightening of the luminosity by about 1 magnitude at , with a strong steepening of the faint end slope clearly identified (see Zucca et al., in preparation).

Since we have sufficient number statistics, we can for the first time break up the evolution of the LF by galaxy spectral types with the current data set reliably up to redshifts and . Each galaxy can be assigned a spectral type based on the SED model fitting of the photometric data (covering a larger wavelength base than the spectra themselves). With all galaxies classified in 4 types, the LF build for the two extreme types of the sample, early types and blue star forming spectral types is shown in Figure 4 & 5. While the LF of the early type population seems not to be evolving my more than 0.5 mag., the LF of the blue star forming galaxies is strongly evolving with redshift, with the L* luminosity measured from the Schechter function fit increasing by more than two magnitudes by redshift . This strong differential evolution vs. spectral type is discussed in Ilbert et al., in preparation.
We will aim to describe the evolution of the population vs. type as well as vs. local galaxy density when the processing of the current sample is complete.
6. Other VVDS products
The luminosity density and the star formation rate history are being produced from the luminosity functions. We will be computing the correlation function and projections for the full sample as well as per each galaxy spectral type to map the evolution of the clustering vs. redshift.
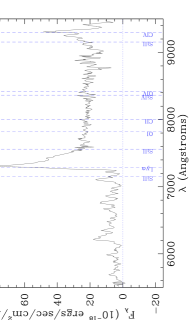
Several other data products are directly available from the VVDS because it is a magnitude limited survey. About 100 type 1 AGNs have been identified in the current sample, the highest redshift QSO being at (Figure 5), this faint AGN sample is highly complementary to other surveys to date since it is surveying AGNs magnitudes deeper. Several clusters of galaxies are being identified and their properties studied.
The high redshift population observed in the VVDS is a unique sample assembled from a purely magnitude selected photometric sample. This galaxy census, when complete, will enable to derive evolution out to from within the same, large, homogeneous sample.
The VVDS is extending to multiwavelength observations: we have been conducting a deep radio survey (Bondi et al., 2003), and are associated with other teams conducting observations at other wavelengths: Galex, XMM, SIRTF. Furthermore, the VVDS-10h field is now the target of the COSMOS program with a 640 orbits HST-ACS coverage of 2 deg2, with extensive multi-wavelength coverage (P.I.: N. Scoville).


7. Summary
The VVDS is on-going. The preliminary first epoch results show:
– a mean redshift lower than anticipated for a
sample, despite a high redshift tail reaching .
– a strong evolution of the global LF out to ,
with the blue star forming galaxies identified as the population
carrying most of the evolution, while the LF of the early
type (“redder”) galaxies does not seem to evolve much.
Many different properties of the sample are being currently being explored.
References
Bondi, M., Ciliegi, P., et al., 2003, A&A, 403, 857
Le Fèvre, O., Vettolani, G., et al., 2001, ESO Astrophysics Symposia Series “Deep Fields”, Cristiani, Renzini, Williams, Eds, Springer, p.231
Le Fèvre, O., Mellier, Y., McCracken, H.J., et al., 2003, A&A, in press