Abstract
This paper considers some effects of foreground Galactic gas on radiation received from extragalactic objects, with an emphasis on the use of the 21cm line to determine the total . In general, the opacity of the 21cm line makes it impossible to derive an accurate value of by simply applying a formula to the observed emission, except in directions where there is very little interstellar matter. The 21cm line can be used to estimate the likelihood that there is significant in a particular direction, but carries little or no information on the amount of ionized gas, which can be a major source of foreground effects. Considerable discussion is devoted to the importance of small-scale angular structure in HI, with the conclusion that it will rarely contribute significantly to the total error compared to other factors (such as the effects of ionized gas) for extragalactic sight lines at high Galactic latitude. The direction of the Hubble/Chandra Deep Field North is used as an example of the complexities that might occur even in the absence of opacity or molecular gas.
[]Peering Through the Muck: Notes on the Influence of the Galactic Interstellar Medium on Extragalactic Observations
1 Introduction
The Interstellar Medium (ISM) regulates the evolution of the Galaxy. It is the source of material for new stars and the repository of the products of stellar evolution. But it is a damned nuisance to astronomers seeking to peer beyond the local gas. In this article I treat the ISM as if it were simply an impediment to knowledge, and suggest ways that one might estimate its effects. This topic has taken on increasing importance in recent years as more and more experiments are requiring correction for the “Galactic foreground” (e.g., Hauser 2001). Here the emphasis will be on the use of the 21cm line to determine a total , for the 21cm line is our most general tool, and is an important quantity which can be used to estimate , E(B–V) and , as well as the likelihood that there is molecular hydrogen along the line of sight. Some of the points treated here are discussed in more detail in reviews by Kulkarni & Heiles (1987), Dickey & Lockman (1990; hereafter DL90), Dickey (2002), and Lockman (2002).
2 General Considerations
Figure 1 shows the amount of neutral interstellar gas, expressed as an equivalent HI column density, needed to produce unity opacity given normal abundances. Below the C-band edge at 0.25 KeV the opacity results almost entirely from photoelectric absorption by hydrogen and helium, which contribute about equally to (Balucinska-Church & McCammon, 1992).
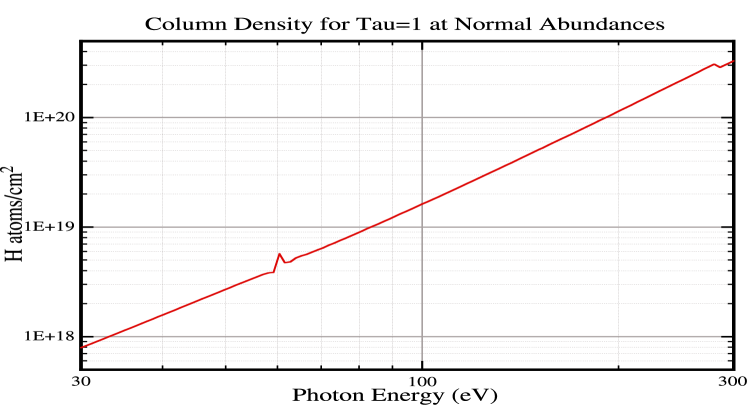
Surveys of the sky in the 21cm line find cm-2 where b is the Galactic latitude (DL90). Thus, most sight-lines through the Milky Way have for eV, even without taking into account any contribution to the opacity from molecular hydrogen, . Luckily, there are large areas of the sky over which is a factor of several below the average, but even so, the lowest in any known direction is cm-2 (Lockman, Jahoda & McCammon 1986; Jahoda, Lockman & McCammon 1990), so observations at eV must always involve substantial corrections for the Galactic ISM.
Except in directions where it is possible to make a direct measurement of in UV absorption lines, every attempt to determine the effect of the ISM on extragalactic observations should begin with the 21cm line. The Leiden-Dwingeloo (LD) 21cm survey covering at angular resolution (Hartmann & Burton 1997) supersedes all previous general surveys because of its angular and velocity resolution, and high quality of data. A southern extension will be completed soon. Some parts of the sky of special interest have been mapped at higher angular resolution (e.g., Elvis et al. 1994; Miville-Deschênes et al. 2002; Barnes & Nulsen 2003). The brighter emission near the Galactic plane is now being measured at resolution by a consortium who employ three different synthesis arrays (Knee 2002; McClure-Griffiths 2002; Taylor et al. 2002).
3 Estimating from 21cm HI Data
Radio telescopes measure an HI brightness temperature, , as a function of velocity, but in general, there is no single formula that can be applied to derive from the observed . The solution to the equation of transfer for 21cm emission from a uniform medium is simple enough:
| (1) |
where for a Gaussian profile from a uniform cloud of linewidth (FWHM) in km s-1. is the excitation temperature of the transition, which is often, but not always, equal to the gas kinetic temperature (e.g., Liszt 2001). But the real interstellar medium is not uniform, and the typical 21cm profile consists of several blended components formed in regions of different temperature. If the line is optically thin at all velocities there is no dependence of on and cm-2. The optically thin assumption always gives a lower limit on .
In directions where part of the line has the concept of a meaningful becomes ambiguous and there is no unique solution for from 21cm emission data alone (e.g., Kalberla et al. 1985; DL90; Dickey 2002). An HI cloud at 100 K with km s-1 has for cm-2, so the 21cm line in an average direction (see Fig. 2) should be treated as if it has components which are not optically thin.
Digression: The Two-phase ISM
Theory tells us that under some conditions HI can exist in two stable phases at a single pressure: a warm phase whose temperature is thousands of Kelvins, and a cool phase whose temperature is K (e.g., Field, Goldsmith, & Habing 1969; Wolfire et al. 2003). Observations suggest that reality is not so bimodal (e.g., Liszt 1983), but the generalization is still useful — the ISM does contain cool HI with a high 21cm line opacity and warm HI with a low opacity (e.g., Heiles & Troland 2003). In the Solar neighborhood there is more mass in the warm HI than the cold (Liszt, 1983; Dickey & Brinks, 1993). The cold phase fills a much smaller volume than the warm phase and has a smaller scale-height as well, so at high Galactic latitudes many sight lines skirt the clouds and intersect predominantly “intercloud” medium, which has a low opacity because of its high temperature and turbulence. In these directions can be determined quite well.

Deriving In Practice
A 21cm profile should always be evaluated for several excitation temperatures, e.g., K and K. If the resulting values of differ significantly, where “significantly” depends on the accuracy one needs, it is likely that a thorough investigation of the direction of interest must be made by measuring in absorption against nearby radio continuum sources ( DL90; Dickey 2002). A sense of how often this might be required is given in Figure 2, where is plotted against the peak in the line, , for a sample of spectra from the LD survey. The line at cm-2 labeled marks, very approximately, the below which the 21cm line is most likely optically thin. Conversely, Fig. 2 suggests that any profile with K should be tested for possible opacity. This applies to about of the directions in the Figure.
4 Angular Structure
The Mississippi [river] is remarkable in still another way — its disposition to make prodigious jumps by cutting through narrow necks of land, and thus straightening and shortening itself… In the space of 176 years the Lower Mississippi has shortened itself 242 miles. That is an average of a trifle over one mile and a third per year. Therefore, any calm person, who is not blind or idiotic, can see that in the Old Oolitic Silurian Period, just a million years ago next November, the Lower Mississippi River was upwards of 1,300,000 miles long, and stuck out over the Gulf of Mexico like a fishing-rod. And by the same token any person can see that 742 years from now the Lower Mississippi will be only a mile and three quarters long, and Cairo [Illinois] and New Orleans will have joined their streets together, and be plodding comfortably along under a single mayor and a mutual board of aldermen. There is something fascinating about science. One gets such wholesale returns of conjecture out of such a trifling investment of fact.
— Mark Twain (1883), in Life on the Mississippi
Use of 21cm data to determine the ISM toward an extragalactic object often requires extrapolation over orders of magnitude in solid angle: from the area covered by the radio antenna beam, to the often infinitesimal area of the object under study. The highest angular resolution typically obtainable for a Galactic 21cm HI emission spectrum (with good sensitivity) is , and this is very much larger than the size of an AGN. Hence the need for extrapolation.
This is a vexing subject which causes some quite respectable scientists to loose their heads (I won’t give explicit references, you know who you are). A few take the situation as license to rearrange the ISM into whatever preposterous filigree of structure simplifies their work — contriving an ISM which appears smooth on scales constrained by the data, but which goes crazy in finer detail. They ignore the wealth of data on the real small-scale structure of interstellar hydrogen. The situation has been further confused by the reported discovery of an anomalous population of tiny, dense HI clouds, whose significance, not to say reality, is now known to have been exaggerated. Twain’s warning against thoughtless extrapolation is especially appropriate to this topic.
The Galactic ISM is not a free parameter! Is there structure in the total Galactic on all angular scales? Yes! Does this introduce errors when extrapolating to small angles? Yes. Are the errors important? Usually not! From point to point across the sky HI clouds come and go, and line components shift shape and velocity, but the dominant changes in total are usually on the largest linear scales, and do not cause large fractional fluctuations over small angles ().
Most structure in interstellar HI results from turbulence, characterized by a power-law spectrum with an exponent always less than ; this has been determined experimentally and is understood theoretically (e.g., Green 1993; Lazarian & Pogosyan 2000; Deshpande, Dwarakanath, & Goss 2000; Dickey et al. 2001 and references therein). Small angles in nearby gas (e.g., at high Galactic latitude) correspond to small linear scales where there is relatively little structure. If the sight line intersects a distant high-velocity cloud then small angles may correspond to large spatial scales and the variations in that spectral component will be larger, but this is usually a problem for the total only in directions dominated by distant gas (see ). Cold HI may have more structure than warm HI, and molecular clouds even more, but as a practical matter, the extrapolation to small angles introduces large errors only when a significant part of the gas in a particular direction is molecular or of anomalous origin, e.g., comes from a high-velocity cloud. Examination of 21cm spectra around the position of interest should give adequate warning of possible structure which then would require higher resolution observations to measure.
A lack of appreciation for the effects of power-law turbulence at small angles was one reason why the early, high-resolution, VLBI studies were interpreted as evidence for an anomalous population of extremely dense HI clouds with sizes of tens of AU. This in turn led some to assume that there must be extreme fluctuations in the total on very small angular scales. Somewhere Mark Train was chuckling. But with more complete observations (Faison 2002, Johnston et al. 2003) and a better understanding of how to interpret them (Deshpande 2000) the anomaly has disappeared almost entirely. The measured small-scale fluctuations in are likely to be entirely consistent with the known power laws (Deshpande 2000). Recent observations of 21cm absorption toward pulsars probing linear scales of 0.005–25 AU find no evidence of spatial structure at the level of (Minter, Balser & Karlteltepe 2003), and other careful observations toward pulsars suggest that some of the initial claims of small-angle fluctuations in HI absorption might be in error (Stanimirovic et al. 2003). The issue of small-scale structure in the ISM is interesting, and there are anomalous directions, e.g., toward 3C 138, where clumping in cold gas appears to be significant (Faison 2002), though here the total is cm-2 and not a typical extragalactic sight-line.
Recently Barnes & Nulsen (2003) combined interferometric and single-dish data to measure 21cm emission toward three high-latitude clusters of galaxies and found limits on fluctuations in on scales of – of to (). DL90 had suggested that on these angular scales , an estimate which has been controversial, but now appears somewhat conservative. I believe that, as concluded in DL90, directions without significant , and without significant anomalous-velocity HI, are unlikely to contain small-scale angular structure in HI that is a major source of error in estimates of the effects of the Galaxy on extragalactic observations.
5 Molecular Hydrogen and Helium
Molecular Hydrogen
The 21cm data can be used to predict the likelihood that there is molecular gas along the line of sight, because there is usually cool HI associated with molecular clouds (though the converse may not necessarily be true, see Gibson 2002). Direct observations of show that of the neutral ISM is in molecular form when a sight line has a reddening , equivalent to (Bohlin, Savage & Drake 1978; Rachford et al. 2003). This line is marked in Figure 2. About half of the directions in the Fig. 2 sample lie above the line. This suggests that for K there may be molecular gas somewhere along the path, an unfortunate circumstance, for an accurate will then be quite difficult to obtain in the absence of bright UV targets in these directions.
Helium
Interstellar and both contribute to the opacity at eV but their abundance cannot be determined by simply scaling and , for a large fraction of the ISM is ionized (Reynolds et al. 1999). Near the Sun, the mass in ionized gas is about one-third the mass of HI, with substantial variations in different directions (Reynolds 1989). The fractional He ionization in the medium seems low (Reynolds & Tufte 1995). Maps of the sky in show the location of the brighter ionized regions, but the intensity is proportional to , not to . The dispersion measure of pulsars gives exactly, but there are not enough pulsars to map out the Galactic to sufficient precision. Kappes, Kerp and Richter (2003) studied the X-ray absorbing properties of a large area of the high-latitude sky and conclude that 20–50% of the X-ray absorbing material is ionized and not traced by HI (see also Boulanger et al. 2001 and references therein). Unlike molecular gas, whose effects can be neglected in directions of low , the ionized component appears to cover the sky. Because we know so little about the detailed structure of the ionized component of the ISM, it probably contributes the most significant uncertainties in our understanding of Galactic foregrounds at high Galactic latitude.

6 The Chandra Deep Field North (CDFN)
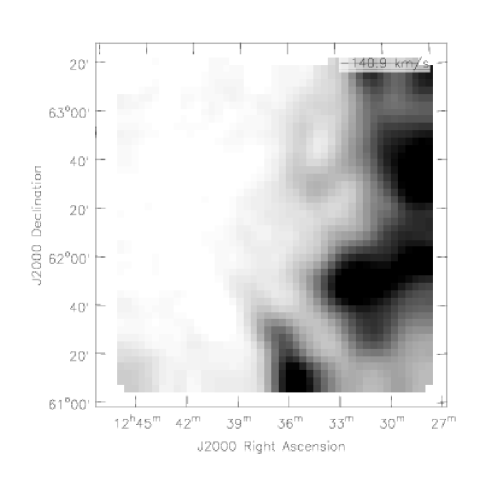
The Chandra Deep Field North is an example of a direction which lacks dense gas, and thus one set of complexities, but has other features of interest (this direction is also the Hubble Deep Field, but as my comments are probably of more interest to X-ray than optical astronomers, I will keep the X-ray name). Figure 3 shows a 21cm spectrum from the LD survey at resolution toward the CDFN (). As a Galactic astronomer I find this sight-line fascinating because it intersects a high-velocity cloud, an intermediate velocity cloud, and low-velocity “disk” gas, (from left to right in the spectrum), containing, respectively, 20%, 50% and 30% of the total . This gas is almost certainly optically thin in the 21cm line. The low-velocity gas further shows evidence of two components, one warm and one cool. It is uncommon to find a sight line where anomalous-velocity gas dominates the total , but that is the case for the CDFN and nearby areas of the sky.
Observations of the CDFN with the 100 meter Green Bank Telescope (GBT) of the NRAO at resolution show a spectrum similar to Figure 3 at the low and intermediate velocities, but only as bright toward the high-velocity cloud. Figure 4 shows why: the high-velocity cloud has a gradient of nearly two orders of magnitude in near the CDFN. It becomes the brightest component in the entire spectrum to the west, contributing nearly cm-2 or more than of the total column density, while to the east it is almost undetectable. This high degree of angular structure is typical of high-velocity clouds, which lie far beyond the local disk gas (Wakker & van Woerden 1997). The intermediate velocity gas over this field has a smaller dependence on angle, with a factor change in and most structure to the south and east.
In a direction (like the CDFN) where much of the hydrogen is in a high-velocity cloud, the total is likely to be a poor predictor of many interesting quantities like and . For example, high-velocity clouds have a lower emissivity per H atom at than disk and intermediate-velocity gas because they lack of dust and/or have low heating (Wakker & Boulanger 1986). The particular high-velocity cloud that crosses the CDFN has an abundance of metals only about that of solar (Richter et al. 2001). The intermediate velocity HI component also probably has different properties than disk gas at some wavelengths because of its different dynamical history. Thus, unlike most directions on the sky, where the kinematics of Galactic HI is irrelevant to its effects on extragalactic observations, the direction of the CDFN may be an exception, and require a specific HI component analysis. In contrast to the CDFN, preliminary GBT observations of the Chandra Deep Field South show that it has a HI spectrum dominated by a single, weak, low-velocity line. Quite boring compared to the CDFN.
7 Concluding Comments
The 21cm line can be a powerful tool for estimating the influence of the Galactic ISM on extragalactic observations, but it must be used with some thought, and it does not give the complete picture. Unresolved angular structure in the 21cm data is unlikely to dominate the error budget in most directions. For cm-2 it is probable that there is some molecular hydrogen along the sight line and the total will be difficult to determine. But in my opinion, it is the poorly-understood ionized component of the ISM which introduces the most serious uncertainties for directions with little molecular gas, and it affects observations in all directions. We are entering an era when highly accurate 21cm data will be available over the entire sky, and then, (though likely even now) the limits on understanding the influence of the ISM on extragalactic observations will lie not in the uncertainties in , but in and , and in the relationship between the dust and the gas. Every observation of an extragalactic object is an opportunity to learn something about the ISM. We should not let such opportunities go to waste.
Acknowledgements.
I thank J.M. Dickey, M. Elvis, C.E. Heiles, A.H. Minter, and R.J. Reynolds for comments on the manuscript, and D. McCammon for supplying Figure 1.1
References
- [] Balucinska-Church, M., & McCammon, D. 1992, ApJ, 400, 699
- [] Barnes, D.G., & Nulsen, P.E.J. 2003, MNRAS, 343, 315
- [] Bohlin, R.C., Savage, B.D., & Drake, J.F. 1978, ApJ, 224, 132
- [] Boulanger, F., Bernard, J-P., Lagache, G., & Stepnik, B., 2001, ”The Extragalactic Infrared Background and its Cosmological Implications”, IAU Symp. 204, ed. M. Harwit & M.G. Hauser, ASP, p. 47
- [] Deshpande, A.A. 2000, MNRAS, 317, 199
- [] Deshpande, A.A., Dwarakanath, K.S., & Goss, W.M. 2000, ApJ, 543, 227
- [] Dickey, J.M., & Brinks, E., 1993, ApJ, 405, 153
- [] Dickey, J.M., & Lockman, F.J., 1990, ARAA, 28, 215 (DL90)
- [] Dickey, J.M., McClure-Griffiths, N.M., Stanimirovic, S., Gaensler, B.M., & Green, A.J. 2001, ApJ, 561, 264
- [] Dickey, J.M. 2002, in “Seeing Through the Dust”, ASP Conf. Ser. Vol. 276, ed. A.R. Taylor, T.L. Landecker, & A.G. Willis, p. 248
- [] Elvis, M., Lockman, F.J., & Fassnacht, C. 1994, ApJS, 95, 413
- [] Faison, M.D. 2002, in “Seeing Through the Dust”, ASP Conf. Ser. Vol. 276, ed. A.R. Taylor, T.L. Landecker, & A.G. Willis, p. 324
- [] Field, G.B., Goldsmith, D.W., & Habing, H.J. 1969, ApJ, 155, L149
- [] Gibson, S.J. 2002, in “Seeing Through the Dust”, ASP Conf. Ser. Vol. 276, ed. A.R. Taylor, T.L. Landecker, & A.G. Willis, p. 235
- [] Green, D.A. 1993, MNRAS, 262, 328
- [] Hartmann, D. & Burton, W.B. 1997, “Atlas of Galactic Neutral Hydrogen” (Cambridge Univ. Press) (The LD survey)
- [] Hauser, M.G. 2001, ”The Extragalactic Infrared Background and its Cosmological Implications”, IAU Symp. 204, ed. M. Harwit & M.G. Hauser, ASP, p. 101
- [] Heiles, C. & Troland, T.H. 2003, ApJ, 586, 1067
- [] Jahoda, K., Lockman, F.J., & McCammon, D. 1990, ApJ, 354, 184
- [] Johnston, S., Koribalski, B., Wilson, W., & Walker, M. 2003, MNRAS, 341, 941
- [] Kalberla, P.M.W., Schwarz, U.J., & Goss, W.M. 1985, A&A, 144, 27
- [] Kappes, M., Kerp, J., & Richter, P. 2003, A&A, 405, 607
- [] Knee, L.B.G. 2002, in “Seeing Through the Dust”, ASP Conf. Ser. Vol. 276, ed. A.R. Taylor, T.L. Landecker, & A.G. Willis, p. 50
- [] Kulkarni, S.R., & Heiles, C. 1987, in “Interstellar Processes”, ed. D.J. Hollenbach & H.A. Thronson, Jr., Reidel, p. 87
- [] Lazarian, A., & Pogosyan, D. 2000, ApJ, 537, 720
- [] Liszt, H.S. 1983, ApJ, 275, 163
- [] Liszt, H.S. 2001, A&A, 371, 698
- [] Lockman, F.J., Jahoda, K., & McCammon, D. 1986, ApJ, 302, 432
- [] Lockman, F.J. 2002 in “Seeing Through the Dust”, ASP Conf. Ser. Vol. 276, ed. A.R. Taylor, T.L. Landecker, & A.G. Willis, p. 107
- [] McClure-Griffiths, N.M. 2002, in “Seeing Through the Dust”, ASP Conf. Ser. Vol. 276, ed. A.R. Taylor, T.L. Landecker, & A.G. Willis, p. 58
- [] Minter, A.H., Balser, D.S., & Karlteltepe, J. 2004, ApJ (in press)
- [] Miville-Deschênes, M-A., Boulanger, F., Joncas, G., & Falgarone, E. 2002, A&A, 381, 209
- [] Rachford, B.L., Snow, T.P., Tumlinson, J., Shull, J.M., et al. (2002), ApJ, 577, 221
- [] Reynolds, R.J. 1989, ApJ, 339, L29
- [] Reynolds, R.J., Haffner, L.M., & Tufte, S.L. 1999, in “New Perspectives on the Interstellar Medium”, ASP Conf. Ser. Vol. 168, eds. A.R. Taylor, T.L. Landecker, & G. Joncas, p. 149
- [] Reynolds, R.J., & Tufte, S.L. 1995, ApJ, 439, L17
- [] Richter, P. et al. 2001, ApJ, 559, 318
- [] Stanimirovic, S., Weisberg, J.M., Hedden, A., Devine, K.E., & Green, J.T. 2003, ApJL (in press; astro-ph/0310238)
- [] Taylor, A.R. et al. 2002, in “Seeing Through the Dust”, ASP Conf. Ser. Vol. 276, ed. A.R. Taylor, T.L. Landecker, & A.G. Willis, p. 68
- [] Twain, M. 1883, Life on the Mississippi, James R. Osgood & Co.: Boston
- [] Wakker, B.P., & Boulanger, F. 1986, A&A, 170, 84
- [] Wakker, B.P., & van Woerden, H. 1997, ARAA, 35, 217
- [] Wolfire, M.G., McKee, C.F., Hollenbach, D., & Tielens, A.G.G.M. 2003, ApJ, 587, 278