Magnetic Fields in Galaxy Clusters
Abstract
Magnetic fields in galaxy clusters can be investigated using a variety of techniques. Recent studies including radio halos, Inverse Compton hard X-ray emissions and Faraday rotation measure, are briefly outlined. A numerical approach for investigating cluster magnetic fields strength and structure is presented. It consists of producing simulated rotation measure, radio halo images, and radio halo polarization, obtained from 3-dimensional multi-scale cluster magnetic field models, and comparing with observations.
Dip. Astronomia, Univ. Bologna, Via Ranzani 1, Bologna, Italy
Ist. di Radioastronomia del CNR, Via Gobetti 101, Bologna, Italy
1. Magnetic Field Measures
A complete description of the astrophysical processes in
cluster of galaxies requires knowledge of magnetic fields.
The most detailed evidence for this component comes from the
radio observations:
Some clusters of galaxies exhibit diffuse
non-thermal synchrotron radio halos, associated with the intra-cluster
medium, which extend up to Mega-parsec scales.
Using minimum energy assumptions, it is possible to estimate
an equipartition magnetic field strength averaged over the
entire halo volume.
These estimates give equipartition magnetic field strengths of
0.1 to 1 G (e.g. Bacchi et al. 2003).
In a few cases, clusters containing a radio halo
show an hard X-ray excess emission.
This emission could be interpreted in terms of
Inverse Compton scattering of the cosmic microwave background photons with the
relativistic electrons responsible for the radio halo emission. In this case,
the measurements of the magnetic field strength
(e.g. Fusco-Femiano et al. 1999, Rephaeli et al. 1999)
inferred from the ratio of the radio to X-ray luminosities are
consistent with the equipartition estimates.
Indirect measurements of the magnetic field
intensity can also be determined in conjunction with X-ray observations
of the hot gas, through the study of the Faraday Rotation
Measure (RM)
of radio sources located inside or behind clusters.
By using a simple analytical approach, magnetic fields of
G, have been found in cooling flow
clusters (e.g. Allen et al. 2001; Taylor & Perley 1993)
where extremely high RMs have been revealed.
On the other hand, significant magnetic fields have also been
detected in clusters without cooling flows: the RM measurements
of polarized radio sources through the hot intra-cluster medium leads
to a magnetic field of G
which fluctuate on scales as small as kpc.
(e.g. Feretti et al. 1995, Feretti et al. 1999, Clarke et al. 2001,
Govoni et al. 2001, Taylor et al. 2001, Eilek & Owen 2002).
The magnetic field strength obtained by RM studies is therefore higher than the value derived from the radio halo data and from Inverse-Compton X-ray studies. However, as pointed out by Carilli & Taylor (2002) and references therein, all the aforementioned techniques are based on several assumptions. For example, the observed RMs have been interpreted, until now, in terms of simple analytical models which consider single-scale magnetic fields. On the other hand, magneto-hydrodynamic cosmological simulations (Dolag et al. 2002) suggest that cluster magnetic fields may span a wide range of spatial scales with a strength that decreases with distance from the cluster center.
We developed a numerical approach for investigating the strength and structure of cluster magnetic fields. It consists of comparing simulated rotation measure, radio halo images, and radio halo polarization, obtained from 3-dimensional multi-scale cluster magnetic field models, with observations (Murgia et al. 2003, submitted).
2. Simulated Rotation Measures
The RM is related to the thermal electron density, , and magnetic field along the line-of-sight, , through the cluster by the equation:
| (1) |
where is measured in G, in cm-3 and is the depth of the screen in kpc.
We consider a multi-scale magnetic field model with a three-dimensional power spectrum: . Different power spectrum index will generate different magnetic field configurations and therefore will give rise to very different simulated RM images.
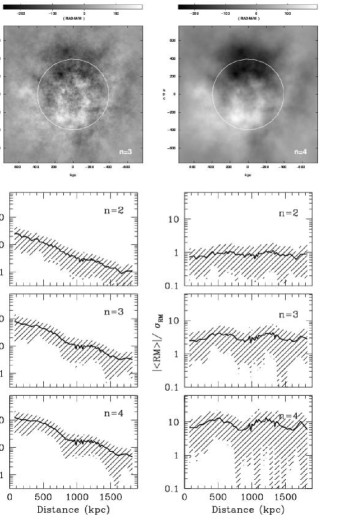
Fig. 1 (top) shows simulated RM images with different values of the index for a typical cluster of galaxies (see caption for more details). RM images, such as those we simulate, cannot be observed for real clusters of galaxies. However, it is relatively easy to measure the RM dispersion and mean ( and ) in limited regions by observing radio sources located at different projected distances from the cluster center. Fig. 1 (bottom) shows the simulated profiles of (left), (center), and / (right), as a function of the distance from the cluster center. While both and increase linearly with the cluster magnetic field strength, the ratio / depends only on the magnetic field power spectrum slope for a given range of fluctuation scales. This means that the comparison of RM data of radiogalaxies embedded in a cluster of galaxies with simulated profiles, can infer the strength and the power spectrum slope of the cluster magnetic field. The comparison of our simulations with data (Murgia et al. 2003, submitted), indicates magnetic fields strength a factor of about 2 lower than that predicted by the single-scale magnetic field approximation widely used in literature and a rather flat spectral index 2.
3. Simulated Radio Halo Images and Radio Halo Polarization
Radio halos observations may provides important information about the cluster magnetic field structure since different values of the power spectrum spectral index will generate very different total intensity and polarization brightness distributions for the radio halo emission.
So far, polarization emission from radio halos has not been detected. The current upper limits to the polarization at 1.4 GHz, for beams of about 45′′, are a few percent (%).
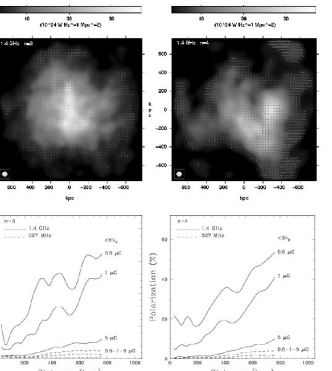
We simulated the expected total intensity and polarization brightness distribution at 1.4 GHz and 327 MHz, as it would be observed with a beam of 45′′, for different values of the magnetic field strength and power spectrum index, by introducing in the 3-dimensional magnetic field an isotropic population of relativistic electrons.
Fig. 2 (top) shows simulated radio halo brightness and polarization percentage distributions at 1.4 GHz (see caption for more details). Fig. 2 (bottom) shows the expected fractional polarization profiles at 1.4 GHz and 327 MHz for the different values of the average magnetic field strength and power spectrum spectral index. Our results indicate that a power spectrum slope steeper than and a magnetic field strength lower than result in a radio halo polarization percentage at a frequency of 1.4 GHz that is far in excess of the current observational upper limits at 45′′ resolution. This means that, in agreement with the RM simulations, either the power spectrum spectral index is flatter than or the magnetic field strength is significantly higher than . The halo depolarization at 327 MHz is particularly severe and the expected polarization percentage at this frequency is always below 1%. Moreover we also found that the magnetic field power spectrum slope has a significant effect in shaping the radio halo. In particular, flat power spectrum indexes () give raise to very smooth radio brightness images (under the assumption that the radiating electrons are uniformly distributed).
4. Conclusions
The numerical approach presented here demonstrates how
the dispersion and mean of the
RM measured in radio galaxies embedded in a cluster of galaxies
can be used to constrain not only the strength but also the
power spectrum slope of the intra-cluster magnetic fields.
Moreover, the study of the polarization properties
of a large scale radio halo, if it is present in a cluster,
can be used to improve the estimates based on the RM analysis.
Acknowledgment. We thank L.Feretti, G.Giovannini, D.Dallacasa, R.Fanti, G.B. Taylor and K.Dolag for their collaboration.
References
Allen S.W., Taylor G.B., Nulsen P.E.J., et al., 2001, MNRAS 324, 842
Bacchi M., Feretti L., Giovannini G., & Govoni, F., 2003, A&A 400, 465
Carilli C.L., Taylor G.B., 2002, ARA&A, 40, 319
Clarke T.E., Kronberg P.P., Böhringer H., 2001, ApJ 547, L111
Dolag K., Bartelmann M., Lesch H., 2002, A&A 387, 383
Eilek J.A., Owen F.N., 2002, ApJ, 567, 2002
Feretti L., Dallacasa D., Giovannini G., Tagliani A., 1995, A&A 302, 680
Feretti L., Dallacasa D., Govoni F., et al., 1999, A&A 344, 472
Fusco-Femiano R., dal Fiume D., Feretti L., et al., 1999, ApJ 513, L21
Govoni F., Taylor G.B., Dallacasa D., et al., 2001b, A&A 379, 807
Rephaeli Y., Gruber D., Blanco P., 1999, ApJ 511, L21
Taylor G.B., Perley R.A., 1993, ApJ, 416, 554
Taylor G.B., Govoni F., Allen S., Fabian A.C., 2001, MNRAS 326, 2