The Inner Density Cusp of Cold Dark Matter Halos
Abstract
I report recent results of numerical simulations designed to study the inner structure of Cold Dark Matter (CDM) halos. This work confirms the proposal of Navarro, Frenk & White (NFW) that the shape of CDM halo mass profiles differs strongly from a power law and is approximately independent of mass. The logarithmic slope of the spherically-averaged density profile, as measured by , decreases monotonically towards the center, becomes shallower than isothermal () inside a characteristic radius, , and shows no evidence for convergence to a well-defined asymptotic value () at the center. The dark mass contained within the innermost radius resolved by the simulations places strong constraints on ; cusps as steep as are clearly ruled out in our highest resolution simulations. A profile where the radial dependence of the slope is a simple power law, , approximates the structure of halos better than the NFW profile and so may minimize errors when extrapolating our results inward to radii not yet reliably probed by numerical simulations. We compare the spherically-averaged circular velocity () profiles to the rotation curves of low surface brightness (LSB) galaxies in the samples of de Blok et al and Swaters et al. The profiles of simulated CDM halos are generally consistent with the rotation curves of LSB galaxies, but there are also some clearly discrepant cases. This disagreement has been interpreted as excluding the presence of cusps, but it may also just reflect the difference between circular velocity and rotation speed likely to arise in gaseous disks embedded within realistic triaxial halos.
Department of Physics and Astronomy, University of Victoria, 3800 Finnerty Road, Victoria, BC, Canada V8P 1A1
1. Introduction
The pioneering efforts of Frenk et al (1988), Dubinski and Carlberg (1991), and Crone et al (1994), among others, led to the identification of a number of key features of the structure of dark matter halos assembled through hierarchical clustering. One important result of this early work concerns the remarkable similarity (“universality”) in the structure of dark matter halos of widely different mass. This was first proposed by Navarro, Frenk & White (1996, 1997; hereafter NFW), who suggested a simple fitting formula to describe the spherically-averaged density profiles of dark matter halos,
| (1) |
A second result concerns the absence of a well defined central “core” of constant density in virialized CDM halos: the dark matter density grows apparently without bounds toward the center of the halo.
Subsequent work has generally confirmed these trends, but has also highlighted potentially important deviations from the NFW fitting formula. In particular, Fukushige & Makino (2001), as well as Moore and collaborators (Moore et al 1998, 1999), have reported that NFW fits to their simulated halos (of much higher mass and spatial resolution than the original NFW work) underestimate the dark matter density in the inner regions (). These authors interpreted the disagreement as indicative of inner density “cusps” steeper than the NFW profile and advocated a simple modification to the NFW formula (referred to hereafter as the M99 profile) with asymptotic central slope .
The actual value of is still being hotly debated in the literature (Jing & Suto 2000, Klypin et al 2001, Taylor & Navarro 2001, Power et al 2003, Fukushige, Kawai & Makino 2003, Hayashi et al 2003, Navarro et al 2003), but there is general consensus that CDM halos are indeed “cuspy”. This has been recognized as an important result, since the rotation curves of many disk galaxies, and in particular of low surface brightness (LSB) systems, appear to indicate the presence of an extended region of constant dark matter density: a dark matter “core” (Flores & Primack 1994, Moore 1994).
Unfortunately, rotation curve constraints are strongest just where numerical simulations are least reliable. Resolving CDM halos down to the kpc scales probed by the innermost points of rotation curves poses a significant computational challenge that has been met in very few of the simulations published to date. Indeed, rotation curves are generally compared with extrapolations of the simulation data that rely heavily on the applicability and accuracy of fitting formulae such as the NFW profile to regions that may be compromised by numerical artifact.
The theoretical debate on the asymptotic central slope of the dark matter density profile, , has also led at times to unwarranted emphasis on the very inner region of the rotation curve datasets, rather than on an proper appraisal of the data over its full radial extent. De Block et al (2001), for example, attempt to derive constraints on from the innermost few points of their rotation curves, and conclude that for most galaxies in their sample. However, their analysis focuses on the regions most severely affected by non-circular motions, seeing, misalignments and slit offsets, and other effects that limit the accuracy of circular velocity estimates. It is perhaps not surprising, then, that other studies (van den Bosch et al 2000, Swaters et al 2003) have disputed the conclusiveness of these findings. The disagreement is compounded by the results of the latest cosmological N-body simulations (Power et al 2003, Hayashi et al 2003, Navarro et al 2003), which find scant evidence for a well defined value of in simulated CDM halos. Given these difficulties, focusing the theoretical or observational analysis on seems unwise. We shall try here to improve upon previous work by comparing directly the results of our simulations with the full radial extent of the rotation curves of LSB galaxies.
I report here results from a major computational effort pursued by an international collaboration bringing together computational cosmology groups in Victoria (Canada), Seattle (USA), Durham (UK), and Garching (Germany). We have now completed a series of about 20 simulations of CDM halos spanning roughly five decades in mass, from dwarf galaxies with circular velocities km s-1 to galaxy cluster systems with km s-1. This series follows a thorough convergence study where the role of all relevant numerical parameters has been assessed in detail (Power et al 2003). As a result, we are able to identify in each simulated halo a minimum convergence radius () beyond which the mass profile is reliably reproduced: circular velocity estimates are accurate to better than for . Each of the simulated halos has several million particles within the virial radius, allowing for the mass profiles to be traced reliably down to within of the virial radius.
2. CDM Halo Density Profiles: Universality and Cusp Structure
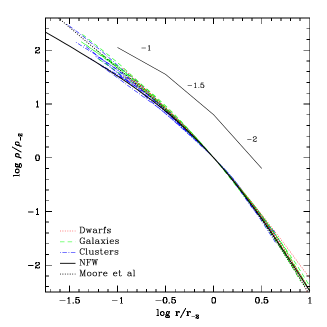
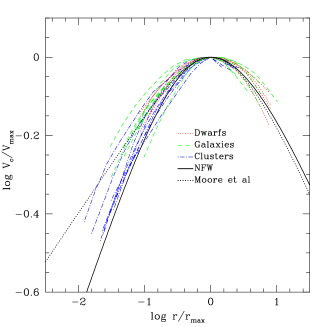
Figure 1 shows the density and circular velocity profiles of nineteen CDM halos simulated in our series. The “universality” in the density profile shape is displayed by scaling each profile to , the radius where the logarithmic slope is . The left panel of Figure 1 shows that there is little difference in the scaled density profiles of CDM halos differing by up to five decades in mass. The same applies to the profiles, which in the right panel of Figure 1 have been scaled to the peak in the circular velocity curve. The fitting formulae proposed by NFW or M99 are fixed curves in these scaled units, and are seen to more or less “bracket” the most extreme shapes of the mass profiles of the simulated halos.
Figure 2a shows the radial dependence of in the simulated halos, and confirms that neither the NFW profile nor the M99 profile capture fully the structural diversity of CDM halos. The profiles are clearly shallower near the center than the asymptotic value of proposed by M99. At the same time, deviates from the NFW prediction inside : density profiles become shallower less rapidly than expected from the NFW formula. Thus, NFW fits tend to underestimate systematically the density just inside (see Figure 1a). Fitting formulae with steeper cusps (such as the M99 profile) might indeed do better in that region; however, so will any other modification of the NFW formula where the logarithmic slope inside depends more weakly on radius than NFW’s , regardless of .
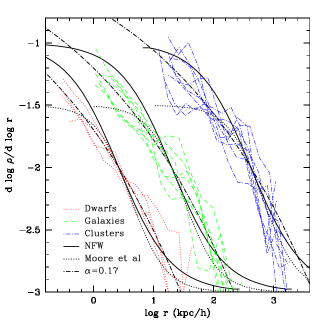
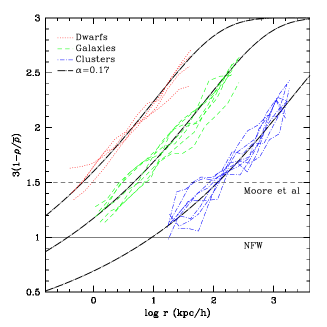
Conclusive proof that the cusps cannot diverge as steeply as is provided by the total mass inside the innermost resolved radius, (the minimum radius plotted for all profiles shown in this paper). This is because the mean density interior to any radius, , together with the local density at that radius, , provide a robust limit to the asymptotic central slope, (under the plausible assumption that is monotonic with radius). The radial dependence of is shown in figure 2b, and shows that, except for possibly one dwarf system, no simulated halo can have a cusp as steeply divergent as .
Actually, there is no indication in the profiles for a well defined value for , as profiles keep getting shallower down to the smallest resolved radius. A simple power law approximates the radial dependence of better than the NFW or M99 profiles;
| (2) |
which corresponds to a density profile of the form,
| (3) |
The thick dot-dashed curves in Figure 2 show that eq.2 (with ) does indeed reproduce fairly well the radial dependence of and in simulated halos. Furthermore, adjusting the parameter allows the profile to be tailored to each individual halo, resulting in much improved fits over those obtained with the NFW or M99 formulae. The best-fit values of (in the range - ) show no obvious dependence on halo mass: the average is and the dispersion about the mean is for the nineteen halos in our series (see Navarro et al 2003 for further details).
3. CDM halos and LSB rotation curves
A number of authors have reported disagreements between the shape of rotation curves of low surface brightness (LSB) galaxies and the circular velocity profiles implied by fitting formulae such as that proposed by NFW (Moore 1994, Flores & Primack 1994, McGaugh & de Blok 1998, de Blok et al 2001). Many of these galaxies are better fit by circular velocity curves arising from density profiles with a well defined constant density “core” rather than the cuspy ones inferred from simulations, a result that has prompted calls for a radical revision of the CDM paradigm on small scales (see, e.g., Spergel & Steinhardt 2000). However, before accepting the need for radical modifications to CDM it is important to note a couple of caveats that apply to the LSB rotation curve problem.
-
•
Strictly speaking, the observational disagreement is with the fitting formulae, rather than with the actual structure of simulated CDM halos. As noted in the previous section, there are small but systematic differences between them, so it is important to confirm that the disagreement persists when LSB rotation curves are contrasted directly with simulations.
-
•
It must be emphasized that the rotation curve problem arises when comparing rotation speeds of LSB disks to spherically-averaged circular velocities of dark matter halos. Given that CDM halos are expected to be significantly non-spherical, some differences between the two are to be expected. It is therefore important to use the full 3D structure of CDM halos to make predictions regarding the rotation curves of gaseous disks that may be compared directly to observation.
Figure 3a illustrates the LSB rotation curve problem highlighted above. This figure shows the rotation curves of four LSB galaxies (points with error bars) selected from the sample of McGaugh et al (2001). The data points have been fitted using a simple formula, (Courteau 1997). Here and are dimensional scaling parameters, whereas is a dimensionless parameter that characterizes the shape of the rotation curve. This three-parameter formula provides excellent fits to all galaxies, as witnessed by the quality of the (solid line) fits shown in figure 3a.
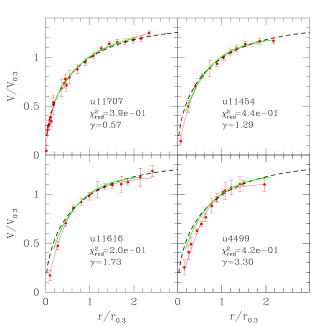
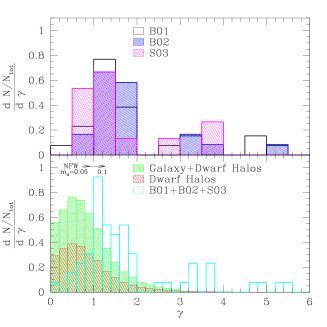
To emphasize visually the shape discrepancy, the rotation curves in figure 3a have been scaled to and : the radius and velocity, respectively, where the slope of the curve is dln/dln. The four galaxies have different values of , and have been chosen to illustrate to whole range of rotation curve shapes in the McGaugh et al and Swaters et al datasets. Roughly two-thirds of their LSBs have ; the rest have (see top panel of Fig.3b).
The dashed lines in figure 3 show the profile of an NFW halo, which is fixed in these scaled units. Clearly, as increases, the difference in shape between the NFW profile and the rotation curve becomes more acute. Galaxies with are roughly consistent with NFW, whereas rotation curves are clearly inconsistent. Can the deviations from NFW discussed in figures 1 and 2 be responsible for this discrepancy?
To address this question we have fitted all simulated halos with the same () formula used for the observational data. Each halo is fitted at various times during its late evolution so as not to impose any restrictions on the dynamical state of the halo; temporary departures from equilibrium associated with recent accretion events are thus taken into account ‘naturally” in this procedure. The distribution of halos peaks at about and is restricted to values that rarely exceed (see bottom panel of Fig.3b). Halos whose fitted best match each of the galaxies in Figure 3a are shown with faint solid lines in that figure.
Full details of this exercise are presented in Hayashi et al (2003), but the main conclusion is that it is possible to find halos whose curves match all galaxies with , with scaling parameters and in reasonable agreement with observed values. CDM halos are thus actually consistent with the majority of LSB rotation curve data. Indeed, the rotation curve problem may be thought of as restricted to the few galaxies with ; these rotation curves rise and turn too sharply to be consistent with the profiles of simulated halos (see the bottom right panel of figure 3a).
Do these galaxies rule out the presence of a cusp in the dark matter density profile? As noted above, before concluding so we must take into account possible systematic differences between rotation speed and circular velocity in gaseous disks embedded within realistic, triaxial halos. This is a complex issue that involves a number of parameters, such as the degree of triaxiality, the role of the disk’s self-gravity, size, and orientation, etc.
For the sake of simplicity, we have decided to begin addressing this issue by evolving a massless, isothermal gaseous disk at the center of mildly triaxial (1:0.9:0.8) halos (Hayashi et al, in preparation). The triaxiality in the potential induces a radially-dependent inclination which may fluctuate, in the case we consider here, by to degrees from one radius to another. The effect on rotation curves of departures from circular symmetry and from coplanar orbits derived from long-slit spectra is complex, but the shape of the rotation curve, in particular, is affected. On some projections, rotation curves appear to rise and turn rapidly, and they would be (erroneously) taken to imply the existence of a constant-density core in simple models that impose spherical symmetry. Fits to the rotation curves using the () formula often have , consistent with galaxies where NFW profiles provide a particularly poor fit to the rotation curve data. This suggests that deviations from spherical symmetry in the mass structure of CDM halos might reconcile rotation curve shapes that seem to favor the presence of constant density cores with cusps in the dark matter density profiles.
4. Concluding Remarks
Although it appears possible to reconcile dark matter cusps with LSBs by appealing to asphericity in CDM halos, it would be premature to argue that the problem has been fully solved. After all, it may come as no surprise that one is able to reproduce LSB rotation curves, given the number of extra “free” parameters afforded by relaxing the assumption of spherical symmetry. It is therefore important to build a more compelling case for this interpretation of rotation curve data, so as to render it falsifiable. We are in the process of identifying corroborating trends that may be used either to support or to rule out this interpretation, as the case may be. In particular, we would like to characterize better the systems: are such rotation curves in general asymmetric? Is rotation around the minor axis expected? Can one verify the triaxial-halo interpretation in full velocity maps? In this sense, identifying a “make or break” prediction will be as important as the success of aspherical halos in reproducing the rich variety of shapes of LSB rotation curves. Only once this is accomplished shall we be able to conclude that LSB rotation curves do not preclude the presence of dark matter density cusps, freeing the CDM paradigm of one of its most vexing challenges on small scales.
Acknowledgments.
I am grateful to my collaborators, Eric Hayashi; Adrian Jenkins; Carlos Frenk; Simon White; Volker Springel; Chris Power; Thomas Quinn; and Joachim Stadel, for allowing me to report some of our results in advance of publication. This work has been supported by the Alexander von Humboldt Foundation, NSERC and CFI, and by fellowships from CIAR and from the J.S.Guggenheim Memorial Foundation.
References
Courteau, S. 1997, AJ, 114, 2402
Crone, M., Evrard, A.E., & Richstone, D.O. 1994, ApJ, 434, 402.
de Blok, W. J. G. et al 2001, ApJL, 552, L23
de Blok, W. J. G, Bosma, A. 2002, AAP, 122, 385, 816.
Dubinski, J. & Carlberg, R. 1991, ApJ, 378, 496.
Flores, R., & Primack, J.R. 1994, ApJL, 427, L1.
Frenk, C.S., et al 1988, ApJ, 327, 507.
Fukushige, T. & Makino, J. 2001, ApJ, 557, 533
Fukushige, T. , Kawai, A. & Makino, J. 2003 (astro-ph/0306203)
Jing, Y. P. & Suto, Y. 2000, ApJL, 529, L69
Hayashi, E. et al 2003, MNRAS, submitted (astro-ph/0310576)
Klypin, A.A. et al 2001, ApJ, 554, 903.
McGaugh, S.S., De Block, W.J.G. 1998, ApJ, 499, 41.
McGaugh, S. S., Rubin, V. C., de Blok, W.J.G., 2001, AJ, 122, 2381. 552, L23
Moore, B. 1994, Nature, 370, 629.
Moore B., Governato F., Quinn T., Stadel J., Lake G., 1998, ApJ, 499, L5
Moore, B. et al, 1999, ApJL, 524, L19
Navarro, J. F., Frenk, C. S. & White, S. D. M. 1996, ApJ, 462, 563
Navarro, J. F., Frenk, C. S. & White, S. D. M. 1997, ApJ, 490, 493
Navarro, J.F. et al 2003, MNRAS, submitted (astro-ph/0311231)
Power, C., et al. 2003, MNRAS, 338, 14.
Spergel, D., Steinhardt, P., 2000, PRL, 84, 3760.
Swaters, R.A. et al 2003, ApJ 583, 732.
Taylor, J.E., & Navarro, J.F. 2001, ApJ, 563, 483.
van den Bosch, F. et al 2000, AJ 119, 1579.