An X-ray Selected AGN at z=4.6 Discovered by the CYDER Survey111Partly based on observations collected at the European Southern Observatory, Chile, under program 72.A-0509
Abstract
We present the discovery of a high redshift, X-ray selected AGN by the Calan-Yale Deep Extragalactic Research (CYDER) survey: CXOCY J033716.7-050153, located at , the second high redshift AGN discovered by this survey. Here, we present its optical, near-IR and X-ray properties and compare it with other optical and X-ray selected high redshift AGN. The optical luminosity of this object is significantly lower than most optically selected high redshift quasars. It also has a lower rest frame UV to X-ray emission ratio than most known quasars at this redshift. This mild deviation can be explained either by dust obscuring the UV radiation of a normal radio quiet AGN emitting at of its Eddington luminosity or because this is intrinsically a low luminosity radio loud AGN, with a super-massive Black Hole of emitting at 1% of its Eddington luminosity. Deep radio observations can discriminate between these two hypotheses.
1 Introduction
Due to its large intrinsic luminosity, an AGN (Active Galactic Nucleus) can be observed up to very high redshifts, and AGNs can therefore be used to probe the early epochs of the universe when the formation of large structures began. Recent observations have found a considerable number of quasars at high redshift (Anderson et al., 2001; Schneider et al., 2002), with some of them at redshift (Fan et al., 2003), when the universe was about 1 Gyr old.
While AGNs were first noticed to be a class of objects worthy of detailed follow-up in other bands on the basis of their radio emission, e.g. (Schmidt, 1963), more recent work has focused on surveys at shorter wavelengths. Due to their low spatial density, most AGNs at high redshift (defined here to be ) were discovered by large area, shallow optical surveys. An example of this is the Sloan Digital Sky Survey (SDSS; York et al. 2000), which in its first data release (Schneider et al., 2003) presented 238 high redshift quasars. However, these quasars were selected based on their optical properties, and optical surveys are subject to bias against the discovery of quasars which are either intrinsically dim at these wavelengths or are obscured by dust like the type 2 AGN that are believed to comprise most of the AGN background (Hasinger, 2002).
The other main AGN selection technique is X-ray detection, as X-ray emission appears to be a universal characteristic of AGNs at all observed redshifts (Kaspi et al., 2000). However, given the relative faintness of the majority of the sources, X-ray surveys need to rely on optical spectroscopy for most of the identifications. With new X-ray missions like the Chandra X-ray Observatory and its superb angular resolution, the identification of X-ray sources at other wavelengths has become much easier, allowing for successful multiwavelength follow-up of X-ray sources. The nature of the X-ray emission also ensures that the optical selection bias due to obscuration is strongly reduced (although the X-ray selection may introduce other biases). This is especially true at high redshift, where the observed X-ray photons were emitted at higher energies and can penetrate even considerable amounts of obscuring material.
According to a recent review by Brandt et al. (2003) only seven of the high redshift AGNs known were discovered by their X-ray emission. Three of them were found with ROSAT (Henry et al., 1994; Zickgraf et al., 1997; Schneider et al., 1998), while the other four were detected by Chandra (Silverman et al., 2002; Barger et al., 2002; Castander et al., 2003a). One of them was detected in the radio and classified as radio loud (Zickgraf et al., 1997).
In this paper, we present the discovery of the eighth high redshift X-ray selected AGN, and the second discovered by the Calan Yale Deep Extragalactic Research (CYDER) survey, at a redshift . The CYDER survey is a collaborative effort between Universidad de Chile and Yale University to study faint stellar and extragalactic populations in detail. One of the key aims is the characterization of the population of faint X-ray sources. In order to do this, some of the fields of the survey were selected to overlap with moderately deep ( 50 ks) Chandra pointings. Multiwavelength follow-up in these fields includes optical imaging using the CTIO 4m telescope, near IR images obtained using the DuPont telescope at Las Campanas Observatory (LCO) and optical spectroscopy from VLT at Cerro Paranal and Magellan at LCO. A more complete review of the optical and spectroscopic properties of the X-ray sources in the first two fields can be found in Castander et al. (2003b).
In §2 we describe the X-ray, optical and near-IR observations that led to the discovery of the AGN presented here. In §3 we discuss its observed properties and compare it with other high redshift quasars, both optical and X-ray selected. We present our conclusions in §4. Throughout this paper we assume km s -1 Mpc-1, and . These cosmological parameters are consistent with the recent findings by Spergel et al. (2003). We define the photon index as the exponent giving a photon flux density X-ray spectrum in photons cm-2 s-1 keV-1.
2 Observations and Data Analysis
2.1 X-Ray Data
As part of the CYDER Survey, five fields observed by Chandra and currently available in the archive were downloaded and analyzed using standard techniques with the CIAO package. In this paper we discuss the results for the source CXOCY J033716.7-050153 found in the SBS 0335-05 field. This field was observed by Chandra on September 7th, 2000 for 60.51 ks (PI: Thuan) and retrieved from the archive by our group. A detailed analysis of the whole sample of X-ray sources detected in these fields will be presented in Treister et al. (2003).
Reduction of the data included the removal of bad columns and pixels using the guidelines specified on the “ACIS Recipes: Clean the Data” web page and the removal of flaring pixels using the FLAGFLARE routine. We used the full set of standard event grades (0,2,3,4,6) and created two images, one from 0.5 to 2.0 keV and one from 2.0 to 8.0 keV. Then, we used the WAVDETECT routine from the CIAO package to identify the point sources within these images, checking wavelet scales 1,2,4,8 and 16.
CXOCY J033716.7-050153 was detected in the I2 ACIS CCD. We extract an X-ray spectrum using a minimum of 5 counts per channel from 0.5 to 3.5 keV (i.e. the 20 lowest energy photons), using the PSEXTRACT script. We then fitted the spectrum within XSPEC 11.0, with a power law model and absorption constrained to the Galactic value of from the tool. This is relatively unconstraining, yielding a spectral index of , and observed fluxes of ergs/sec/cm2 and ergs/sec/cm2, from 0.5-2 and 0.5-8 keV, respectively. The fit to the X-ray spectrum did not depend on whether the or the C-statistic was used, so it is unlikely that large errors were induced by fitting with an insufficient number of photons per bin. The unabsorbed fluxes are approximately and ergs/sec/cm2, respectively. The errors should be about 30% due to the statistical error in the count rate and the uncertainties in the best-fitting spectral models. The cumulative histogram of detected X-ray photons is presented on Figure 1.
2.2 Optical Imaging Data
The field of the AGN was observed with the CTIO 4 meter Blanco telescope, using the MOSAIC-II camera, that provides a field of view of 36′x36′. Images were taken using the ,, and filters on the nights of October 8th and 10th, 2002, centered on the Chandra archival image central coordinates. Exposure times were 2 hours under 1.3′′ seeing conditions in the filter, 50 minutes under 1.1′′ seeing in , 50 minutes under 1.1′′ seeing in and 20 minutes under 1.0′′ seeing in .
A second image in the band was taken with the UT4 VLT telescope at Cerro Paranal, Chile using the FORS2 instrument. This image was taken on the night of September 19 2003 in service mode. Total exposure time was 14 minutes under 0.7′′ seeing conditions.
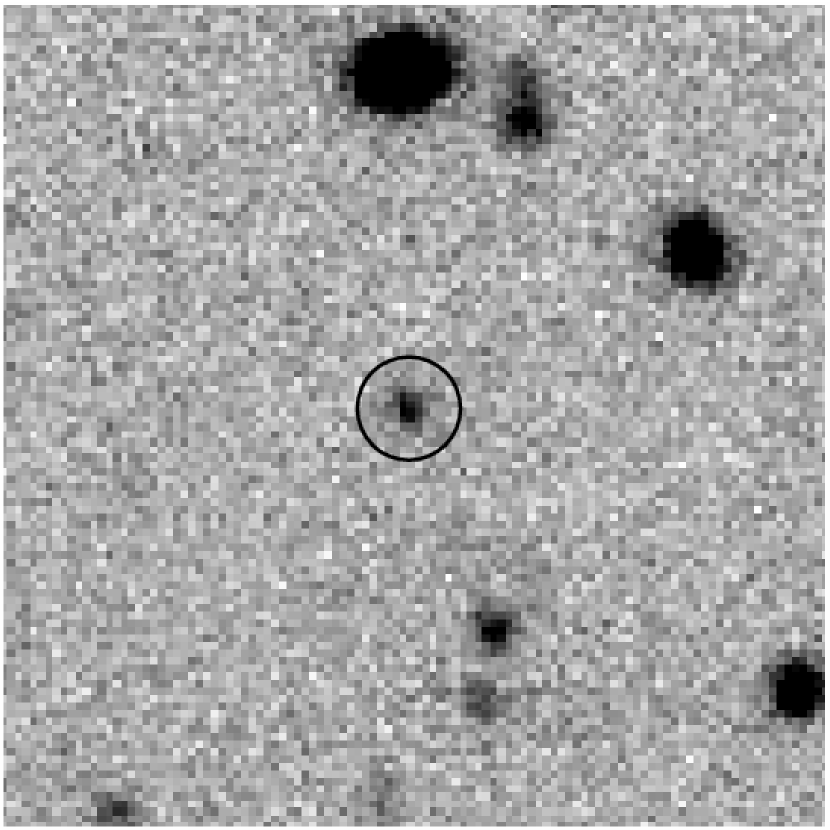
Images were reduced using standard techniques with the IRAF/MSCRED package. Identification of the optical counterpart of the X-ray source was straightforward given the superb spatial resolution of the Chandra Observatory. Indeed, only one optical source can be found in a 3′′ circle around the X-ray emission centroid. The offset between the X-ray and optical positions was in RA and in Dec. In order to calculate the received flux in each band, we performed aperture photometry using an aperture of FWHM of each image, centered on the centroid of the band source, the band in which the signal to noise is highest. The observed magnitudes in each band can be found in Table 1. Figure 2 shows the optical finding chart, based on the band image.
2.3 Optical Spectroscopy
Multislit spectroscopy of X-ray sources detected by Chandra in the field of the AGN was obtained at Las Campanas Observatory with the Magellan I (Baade) telescope, using the LDSS-2 instrument. The observations were taken on the night of October 4th, 2002. The field of the high redshift AGN CXOCY J033716.7-050153 was observed for 2 hours in 0.75′′ seeing conditions. The Med/Blue grism was used, giving a dispersion of 5.3Å per pixel at a central wavelength of 5500Å. The obtained spectrum was reduced using standard IRAF tasks called by a customized version of the BOGUS code222Available at http://zwolfkinder.jpl.nasa.gov/stern/homepage/bogus.html .We calibrated the wavelength of the spectrum using the He-Ar comparison lamp and the night sky lines. Rough flux calibration of the spectrum was performed using the spectrum of the LTT9239 spectrophotometric standard.
Figure 3 shows the final, reduced spectrum together with the mean spectrum of quasars at observed by the SDSS. Ly and NV are clearly distinguishable in the spectrum. The measured redshift using these emission lines is .
3 Discussion
With an absolute magnitude of (Vega), calculated extrapolating the band magnitude using the SDSS QSO composite spectrum (Vanden Berk et al., 2001), CXOCY J033716.7-050153 is a faint AGN. Indeed, there are only two AGNs known at high redshift that are fainter in the optical, VLA J1236+6213 at (Brandt et al., 2001) and CXOHDFN J123719.0+621025 at (Barger et al., 2002), both located in the HDF-N/CDF-N. In X-rays, this quasar shows a luminosity in the [0.5-2.0] keV band of ergs s-1. This is a large X-ray luminosity for an AGN that is faint in the optical bands. In order to quantify this statement, we can calculate the effective optical to X-ray power-law spectral slope which is given by
| (1) |
where is the flux density per unit of frequency and is the frequency of the given wavelength or energy. For this AGN, we measure a value of . The average value for the known sample of AGNs detected in X-rays333This sample can be found in the Web site http://www.astro.psu.edu/user/niel/papers/highz-xray-detected.dat maintained by Niel Brandt and Christian Vignali is from a total of 71 sources, so this new AGN is a deviation. With the data available now we cannot calculate the contribution from the host galaxy to the optical luminosity, but it can only be significant if its luminosity is . Furthermore, a significant contribution from the host galaxy will only make the optical luminosity of the AGN to be smaller, therefore increasing the value of and making the deviation from a typical AGN at this redshift to be even larger.
A plot of as a function of redshift for all the high redshift AGNs detected in X-rays can be found in Figure 4 and the relation for these objects is presented in Figure 5. In Figure 4 we can see that the X-ray selected sources have systematically higher values of than optically selected AGNs. This correlation is expected from selection effects; however, it should be noted that the optical luminosities of all the X-ray selected sources are fainter than that of the least luminous optically-selected quasar (with the exception of the one X-ray selected blazar), see Figure 5.
Recents results presented by Vignali et al. (2003b) show that there is a good correlation between the UV flux characterized by the flux density at 2500Å and the soft X-ray flux measured at 2 keV. This correlation can be expressed as . A similar result was reported in (Castander et al., 2003a), in this case . This relation implies that should also be correlated with the UV flux (or luminosity). Figure 5 shows that optically selected AGNs are more luminous, both in the optical and the X-ray, than the X-ray selected ones. The value of optically selected AGN are therefore expected to be lower as can be seen in Figure 4.
In Figure 5, we can also see that without correcting for the possible optical obscuration CXOCY J033716.7-050153 is a significant deviant from the relation. There are two possible explanations for this deviation: either there is significant obscuration of the optical light by dust or this a radio loud AGN with enhanced by a second component, probably coronal, contributing to the X-ray emission. Strong optical variability can be ruled out using the two optical observations separated by year in the observed frame, in which the band magnitude remained almost unchanged given the error bars.
If this AGN is relatively unobscured, then its anomalous value of , as well is its relative optical faintess compared with other high redshift AGN may be explained if the source is at the bright end of the low luminosity AGN (LLAGN) category. Such sources are typically seen to have X-ray luminosities below about 1% of the Eddington limit, e.g. Ho (2002); Maccarone et al. (2003). The mass of the central black hole would then have to be at least about . Applying the black hole fundamental plane relation from Merloni et al. (2003),
| (2) |
where is the radio luminosity at 5 GHz, is the 2-10 keV X-ray luminosity and M is the mass of the black hole in units of , we find that the radio power is expected to be at least Jy. Now, if we assume instead that this is a typical AGN radiating at about 10% of its Eddington luminosity then using the Merloni relation we get a radio flux of Jy. Moreover it seems that the radio emission is quenched in AGN accreting at about 10% of the Eddington rate (Maccarone et al., 2003), so an even lower radio flux would be expected.
Following the standard definition of radio to optical flux ratio given by Kellermann et al. (1989), where optical flux is defined as the flux at 4400Å in the rest frame and radio flux is calculated at a rest frame frequency of 5 GHz (6 cm), radio loud sources have values in the range 10-1000, while for radio quiet AGNs 0.11. With the assumption that the Eddington ratio is 1% for this AGN we get that , making it a radio loud AGN. However, given the low optical luminosity, we cannot neglect the contribution of star light from the host galaxy, in which case the value of computed is simply the lower limit of the radio to optical flux ratio for the AGN emission alone. Assuming an Eddington ratio of 10% then , which makes it a radio quiet AGN.
According to an alternate definition of radio loudness often used for high redshift quasars (Stern et al., 2000), to be considered radio loud an AGN has to have a minimum 1.4 GHz specific luminosity of ergs s-1 Hz-1 (Schneider et al., 1992), which at corresponds to a specific flux of mJy, very close to the detection limit of the VLA FIRST survey. Unfortunately, the field of CXOCY J033716.7-050153 was not observed by the FIRST survey. Using the NVSS survey (Condon et al., 1998) catalog, there were no detectable sources within a 1 arcminute radius. Considering that the completeness limit is 2.5 mJy, we can use this as an upper limit to the 1.4 GHz continuum emission. Then, this AGN could be at most marginally classified as radio loud.
In order to determine the amount of obscuration affecting the optical spectrum of this AGN we can compare its optical colors with a typical AGN spectrum at this redshift. The optical colors of this AGN are: and . Using the composite SDSS QSO spectrum (Vanden Berk et al., 2001) and redshifting it to we obtain the following colors: and accounting for the IGM absorption using the description given in Madau (1995). If instead we use an average of all SDSS QSOs at the results are very similar, finding differences . The fact that CXOCY J033716.7-050153 is slightly redder than the average QSO at that redshift suggests that the optical spectrum is subject to some obscuration in the line of sight. In order to investigate this hypothesis, we added dust obscuration to the average spectrum following the prescription given in Cardelli et al. (1989). Given that the observed band flux is affected by the Ly emission line, whose strength is highly variable from AGN to AGN, we will base our reddening estimate only on the color. If order to obtain a color of 2.1 for the redshifted composite SDSS quasar, similar to the observed value we need to add an extinction contribution of in the rest frame. Therefore, we will adopt this value to correct the observed optical fluxes for intrinsic dust extinction. It is also worth noting that the accretion disk may become cooler at lower luminosities, which would also yield redder colors.
Another typical way to calculate the amount of obscuration in the line of sight is using the X-ray spectrum. In this case, however, we do not have enough counts in the X-ray spectrum to calculate absorption directly. Also, since the observed soft X-ray band [0.5-2.0] keV translates into [2.8-11.22] keV in the rest frame, the observed X-ray spectrum is insensitive to moderate amounts of neutral hydrogen absorption ( cm-2). Using the standard dust to gas ratio, we can convert the optical extinction to a neutral hydrogen column density, given by cm-2 (Granato & Danese, 1994). Then, we obtain in this case that cm-2, implying that the X-ray spectrum is not affected by absorption in the observed energy range.
Now, correcting for the optical obscuration we compute an unobscured magnitude of 22.52. Using this value, we calculate the unobscured optical to X-ray power law slope , which is now similar to the average value found for high redshift AGN.
As we can see in Figure 5 and already presented in Castander et al. (2003a), is a better fit to the data if the low UV luminosity X-ray selected AGNs are included. The values for CXOCY J033716.7-050153 are consistent with this correlation if optical obscuration is taken into account.
4 Conclusions
We present the discovery of the CXOCY J033716.7-050153, the second high redshift X-ray selected AGN discovered by the CYDER survey. This is a faint object in the optical. In fact there are only two AGNs fainter at these high redshifts. The X-ray flux relative to its optical emission is unusual, having a larger value of than the typical AGN at high redshift. There are two effects that could bring this object into better accordance with the observed correlations for the general high redshift population:
The first possibility is that this is a radio loud low luminosity AGN with a Black Hole of , emitting at of its Eddington Luminosity. In this case the accretion disk is cooler than a typical AGN at high redshift, making the optical colors look redder. Also, the high value of , even taking into account the correlation with optical luminosity, can be explained by the presence of second emission component, probably coronal, which contributes to the X-ray flux measurement.
A second possibility is that this is a radio quiet AGN emitting at an Eddington ratio of , in which the optical emisssion is obscured by a moderate amount of dust which would imply a neutral hydrogen column density of cm-2, causing the observed optical colors to be redder than the normal AGN. If this is the case, the observed value of is affected by the obscuration of the optical light, and after correcting for it, the corrected value agrees very well with the measurements for other high redshift AGNs, including the observed correlation between and .
Detection of a flat radio spectrum in this source above about 10 Jy would confirm the Low Luminosity AGN hypothesis, while a non-detection in the radio with a sensitivity limit of a few Jy would strongly support the radio quiet, mildly obscured AGN hypothesis.
References
- Anderson et al. (2001) Anderson, S. F., et al., 2001, AJ,122, 503
- Barger et al. (2002) Barger, A. J., et al., 2002, AJ,124, 1839
- Brandt et al. (2001) Brandt, W.N., et al., 2001, AJ, 122, 1
- Brandt et al. (2003) Brandt, W.N., et al., 2003, astro-ph/0212082
- Cardelli et al. (1989) Cardelli, J.A., Clayton, G.C., Mathis, J.S., 1989, ApJ,345, 245
- Castander et al. (2003a) Castander, F.J, et al., 2003a, AJ, 125, 1689
- Castander et al. (2003b) Castander, F.J, et al., 2003b, AN, 324, 40
- Condon et al. (1998) Condon, J. J., Cotton, W. D., Greisen, E. W., Yin, Q. F., Perley, R. A., Taylor, G. B., & Broderick, J. J. 1998, AJ, 115, 1693
- Fan et al. (2003) Fan X., et al., 2003, AJ, 125, 1649
- Granato & Danese (1994) Granato, G.L., & Danese, L., 1994, MNRAS, 268, 235
- Hasinger (2002) Hasinger G., astro-ph/0202430
- Henry et al. (1994) Henry, P.J., et al., 1994, AJ,107,1270
- Ho (2002) Ho, L., 2002, ApJ,564,120H
- Kaspi et al. (2000) Kaspi, S., et al., 2000, AJ, 119, 2031
- Kellermann et al. (1989) Kellermann, K.I., Sramek, R., Schmidt, M., Schaffer, D.B., & Green, R., 1989, AJ, 98, 1195
- Maccarone et al. (2003) Maccarone, T.J., Gallo, E. & Fender, R., 2003, MNRAS, 345L, 19
- Madau (1995) Madau P., 1995, ApJ, 441, 18
- Merloni et al. (2003) Merloni, A., Heinz, S., & Di Matteo, T., 2003, MNRAS, 345, 1057
- Schneider et al. (1992) Schneider, D.P.; van Gorkom, J. H.; Schmidt, M.; Gunn, J. E., 1992, AJ, 103, 1451
- Schneider et al. (1998) Schneider D.P, et al., 1998, AJ, 115, 1230
- Schneider et al. (2002) Schneider D.P, et al., 2002, AJ, 123, 567
- Schneider et al. (2003) Schneider D.P, et al., 2003, AJin press, astro-ph/0308443
- Silverman et al. (2002) Silverman, J. D., et al., 2002, ApJ, 569, L1
- Schmidt (1963) Schmidt, M.,1963, Nature, 197, 1040
- Spergel et al. (2003) Spergel, D.N., et al., 2003, ApJS, 148, 175
- Stern et al. (2000) Stern, D., Djorgovski, S.G., Perley, R.A., De Carvalho, R.R. & Wall, J.V., 2000, AJ, 119, 1526
- Treister et al. (2003) Treister, E., et al., 2003, in preparation
- Vanden Berk et al. (2001) Vanden Berk, D.E., et al., 2001, AJ, 122, 549
- Vignali et al. (2003a) Vignali, C., Brandt, W.N., Schneider, D.P., Garmire, G.P., & Kaspi, S. 2003,AJ,125,418
- Vignali et al. (2003b) Vignali, C., Brandt, W.N., & Schneider, D.P., 2003, AJ, 125, 433
- York et al. (2000) York, D. G., et al., 2000, AJ, 120, 1579
- Zickgraf et al. (1997) Zickgraf, F.J., et al., 1997, A&A, 323, L21


| Parameter | Value |
|---|---|
| RA (J2000) (X-ray) | |
| Dec (J2000)(X-ray) | |
| RA (J2000) (optical) | |
| Dec (J2000)(optical) | |
| Galactic NHaacalculated using HEASARC tool nh | cm-2 |
| B magbbAB magnitudes in a FWHM aperture | |
| V magbbAB magnitudes in a FWHM aperture | 25.76 |
| R magbbAB magnitudes in a FWHM aperture | 24.01 |
| I mag (CTIO)bbAB magnitudes in a FWHM aperture | 23.95 |
| I mag (VLT)bbAB magnitudes in a FWHM aperture | 23.66 |
| ccRest Frame band AB magnitude, assuming the SDSS average quasar spectrum | -22.14 |
| 23.82 | |
| -22.45 | |
| (0.5-8 keV) | ergs s-1 cm-2 |
| (0.5-2 keV) | ergs s-1 cm-2 |
| (0.5-2 keV) | ergs s-1 |