Cosmological evolution of heavy element and H2 abundances
Abstract
Spectroscopic observations of distant quasars have resulted in the detection of molecular hydrogen in intervening damped Lyman- absorption clouds (DLAs). We use observations compiled from different experimental groups to show that the molecular hydrogen abundance exhibits a dramatic increase over a cosmological time period corresponding to 13% to 24% of the age of the universe. We also tentatively show that the heavy element abundances in the same gas clouds exhibit a faster and more well-defined cosmological evolution compared to the general DLA population over the same time baseline. We argue that this latter point is unsurprising, because the general DLA population arises in a wide variety of galaxy types and environments, and thus a spans broad range of ISM gas-phases and abundances at the same cosmic time. DLAs exhibiting H2 absorption may therefore circumvent this problem, efficiently identifying a narrower class of objects, and provide a more sensitive probe of cosmological chemical evolution.
keywords:
line: identification – ISM: molecules – Galaxy: abundances – intergalactic medium – quasars: absorption lines – ultraviolet: general1 Introduction
The detection of cosmological chemical evolution is a cornerstone of modern cosmology, providing empirical details about galaxy formation and evolution, and independent supporting evidence of the big bang. High-precision measurements of chemical abundances at early cosmological epochs come from damped Lyman- absorption systems (DLAs), arising in distant galaxies which intersect the lines of sight to high-redshift quasars. DLAs are easily detected in quasar spectra due to their particularly high neutral hydrogen column densities [H i by definition, though Voigt profile damping wings are seen at lower H i]. Generally, they comprise a clumpy distribution of clouds, spread typically over a few hundred . Detection levels for heavy element transitions in DLAs are 7 orders of magnitude below that for H i. High resolution optical spectra reveal transitions from many redshifted UV species, allowing detailed heavy element abundance patterns to be studied. The metallicity of DLAs – defined as the heavy element abundance with respect to hydrogen, relative to that of the solar neighbourhood: – ranges over 2 orders of magnitude and is usually 0.1 solar or lower. The presence of dust in DLAs is revealed by the relative depletion of refractory elements (e.g. Fe) with respect to those thought not to readily deplete onto dust grains (e.g. Zn; Pettini et al., 1997), and by the suppression of blue light from the background quasar (e.g. Fall et al., 1989). These spectroscopic observations demonstrate that DLAs arise along lines of sight through distant galaxies but they do not disclose details such as the galaxy’s morphology, luminosity, mass or age.
Evidence for an increase in DLA metallicity with cosmic time has emerged only gradually over the past few years from a number of different studies (Pettini et al., 1995; Lu et al., 1996; Vladilo et al., 2000; Kulkarni & Fall, 2002; Prochaska et al., 2003). The latter reference provides the most compelling statistical evidence so far since, using the full sample of 125 DLAs, one sees a strong anti-correlation between [M/H] and absorption redshift, : Kendall’s is with an associated probability of . The need for such a large sample is due to the 2 dex scatter in [M/H] at a given epoch.
The types of galaxies responsible for DLAs can be investigated using direct imaging methods or comparison of spectroscopic data with models. The kinematics of optical resonance absorption transitions in low redshift DLAs appear consistent with 2-component models: a rotating disk plus an extended halo (Briggs et al., 1985). A recent detailed radio study of one particular DLA at clearly shows that at least some DLAs arise in the rotating disks of ordinary spiral galaxies (Briggs et al., 2001). High redshift () DLAs have been interpreted similarly, using detailed kinematic modelling to argue that they are rotating ensembles of clouds with further evidence for this interpretation coming from comparison of abundance ratios in DLAs and the thick component of our Galaxy’s disk (Prochaska & Wolfe, 1997; Wolfe, 2001).
On the other hand, direct imaging of DLAs at reveals the hosts to be a mix of irregulars, spirals and low surface-brightness galaxies (LSBs; e.g. Le Brun et al., 1997; Rao et al., 2003), a result further borne out by a blind 21-cm emission survey at (Ryan-Weber et al., 2003). The observed number of DLAs per unit redshift interval and the H i distribution suggest that DLAs at are a roughly equal mix of LSBs and spirals; at higher redshift they are more likely to be dwarfs (that subsequently merge) since there are too few precursors of present-day disk galaxies to explain the data (Boissier, 2003; Boissier et al., 2003). Fitting simple chemical evolution models to an observed H i–[Zn/H] distribution suggests that at redshifts , about half of all DLAs are due to dwarf galaxies, while at , giant galaxies may dominate the population (Baker et al., 2000). H i 21-cm absorption measurements also hint that dwarfs could dominate at high- (Kanekar & Chengalur, 2003).
Further work is clearly needed to generate an accurate inventory of DLA host galaxy types as a function of cosmic epoch. Nevertheless, the evidence for a broad mix of galaxy types is already compelling, if not conclusive.
2 Our Conjecture
It is well established from studies of local galaxies that chemical abundances depend on morphology, luminosity and location within a galaxy. The diversity and evolution of the DLA host population will further complicate and distort estimates of chemical evolution over cosmological timescales. The DLA data themselves thus suggest that we may derive greater insight by attempting to disentangle these different galaxy types of DLA absorbers, rather than assuming all DLAs can be classified into one sample. A more sensitive test, or at least complementary test, for chemical evolution may be arrived at if we can select a subset of DLAs which arise in a narrow range of physical conditions.
One possibility, which we suggest here, is to target those DLAs which exhibit molecular hydrogen absorption. There are currently 8 examples of such H2-bearing DLAs at redshifts . None of the absorbing galaxies have been identified directly through imaging, though hints at the galaxy types come from a comparison with our own Galaxy and its satellites. The mean molecular hydrogen fraction, H i, seen along lines of sight through our the Galaxy is , and for the SMC and LMC it is . DLA detections lie in the range from (upper limits on non-detections are , Ledoux, Petitjean & Srianand 2003, hereafter LPS03) but 2/3 of the detections are in the range . As discussed in LPS03, 90% of the sightlines through our Galaxy (and through the SMC) intercept H2 clouds. For the LMC, only 50% of sight-lines contain H2 at the same strength. DLAs exhibit H2 absorption 20% of the time (LPS03), and in this respect are more similar to the LMC. It is therefore possible that H2-bearing DLAs may arise predominantly in dwarf galaxies rather than massive spirals. However, given the rapid apparent molecular fraction evolution in Fig. 1, this interpretation is speculative.
3 Current observational evidence
| QSO | Mag. | S/N (H2) | [Fe/H] | [M/H] | M | |||||
|---|---|---|---|---|---|---|---|---|---|---|
| 0000263 | Zn | |||||||||
| 0013004 | Zn | |||||||||
| 0347383 | Zn | |||||||||
| 0405443 | Zn | |||||||||
| 0528250 | Zn | |||||||||
| 0551366 | Zn | |||||||||
| 1232082 | Si | |||||||||
| 1444014 | Zn |
Notes: 1A value for Q0528250 is not available in LPS03 but reasonably high S/N is expected from the QSO magnitude, exposure time and .
3.1 The data
Table 1 summarizes the properties of the 8 H2-bearing DLAs studied here. H2 is detected in DLAs via the Lyman and Werner–band UV lines and H i is detected via the Lyman series. Observed transitions fall in the visible region for larger than . Column densities are measured from Voigt profile fits to absorption lines from each species. A compilation of results from H2 searches in DLAs is given in Table 8 of LPS03, for which 7 DLAs have confirmed H2 detections and metallicity measurements: 0013004 (), 0347383, 0405443 (), 0528250, 0551366, 1232082 and 1444014. The DLA towards 0013004 has been studied in detail by Petitjean et al. (2002): it comprises several absorbing components, of which 2 are dominant (their components and ). These 2 components are distinguishable in H2 but not in the saturated H i Lyman series. H i has thus been measured at the mean redshift of these 2 components and we use the mean (H2) in computing for this DLA. The error we use for is derived from the range in (H2) given in LPS03. We use the value and error for (H2) in the DLA towards 1232082 from Srianand et al. (2000).
We include one further DLA, 0000263. The H2 detection is regarded as only tentative in LPS03 but has been carefully scrutinised in Levshakov et al. (2000, 2001) and relies on two H2 absorption features, the L(4-0)R1 and W(2-0)Q(1) lines, the former appearing relatively free from Lyman- forest blending. Since this is the highest redshift H2-bearing DLA, the [M/H]– and – correlations derived below rely on this point relatively heavily. Further confirmation or refutation of this H2 detection is therefore desirable. A tentative H2 detection at towards 0841129 has also been reported (Petitjean et al., 2000), though confirmation requires future data and/or analyses.
Here we omit the recent detection towards 05154414 (Reimers et al., 2003) since the local ionizing UV background may be relatively intense. See Murphy, Curran & Webb (2004) for an analysis including this system.
All metallicities are based on elements where depletion onto grains is expected to be small: 7 measurements are derived from [Zn/H], while the metallicity for 1232082 is derived from [Si/H]. In most DLAs Si is observed to be slightly dust-depleted with respect to Zn so one might expect our conclusions below to be slightly strengthened if [Zn/H] could be used as a metallicity indicator for 1232082.
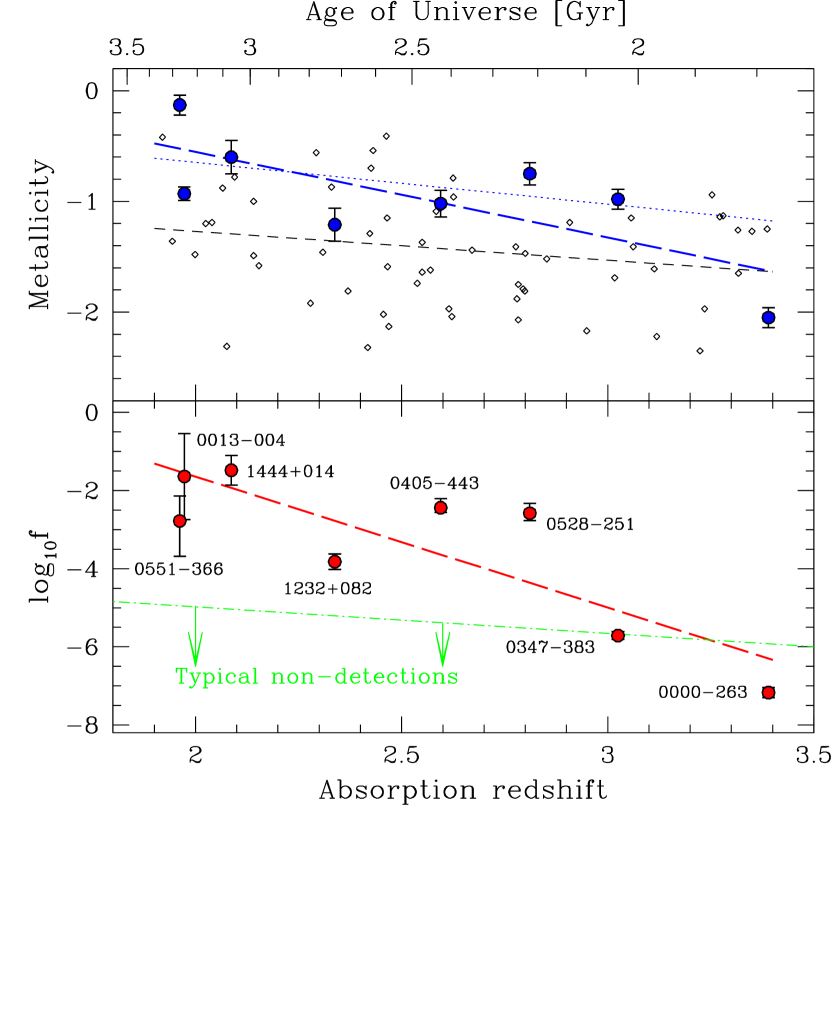
Fig. 1 illustrates the distribution of [M/H] and for the 8 DLAs with detected H2. The metallicity appears to change by over the range , while the molecular hydrogen fraction appears to change by . The scatter about the straight line fits is clearly larger than the statistical (1 ) errors in both panels. The validity of any simple parametric fit is thus dubious. Straight-line fits were nevertheless derived by quadrature addition of the same constant to each statistical error such that the normalised . Least-squares fits give similar slopes and -intercepts but our procedure results in reasonable error estimates for these quantities.
3.2 Metallicity vs. Redshift
With this procedure, a fit of the form to the 8 [M/H] points in Fig. 1 gives and . Using Kendall’s as a non-parametric correlation estimate gives and . That is, [M/H] and are anti-correlated with 92% confidence. Compare these statistics with those derived using the 60 DLAs from Prochaska et al. (2003) in the redshift range which have Zn, O, S or Si metallicities: , , and . The slope, , also compares well with that derived by Prochaska et al. for the overall 125 DLA sample, i.e. .
Visually, the [M/H]– distribution suggests two further results: (i) As discussed in Ledoux et al. (2002, 2003), the H2-bearing DLAs have systematically higher [M/H] than the general DLA population. A Kolmogorov-Smirnov (KS) test reveals the two [M/H] distributions to have only 2% probability of being drawn from the same parent distribution. Removing the lowest and highest redshift H2-bearing DLAs, which are also the extreme [M/H] points, would give good agreement between the slope for the remaining 6 points and the general DLA population, but the metallicity agreement would be somewhat worse (KS probability reduces to 0.8%). (ii) The [M/H]– correlation appears to be tighter for the H2-bearing DLAs compared to the general DLA population. To test this we subtract the linear fit to the data in each case and use an F-test to compare the variances of the residuals. The variance for the 60 general DLAs is 1.9 times that for the H2-bearing DLAs, although the probability of this happening by chance is 39% given the sample sizes.
In summary, the H2-bearing DLAs display a faster increase in metallicity with cosmic time compared to the general DLA population. Furthermore, this increase is more well-defined in the H2-bearing sample and these DLAs seem to be chemically distinct from the general DLA population.
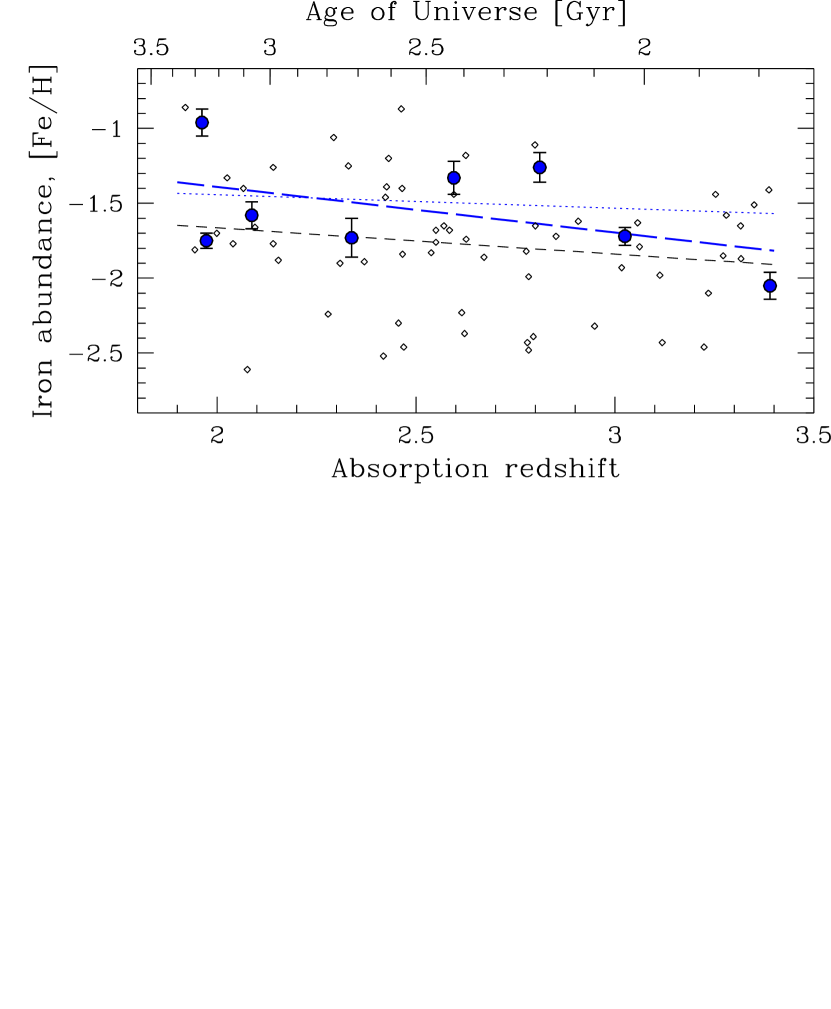
These latter two results are also supported by the distribution of relative iron abundances, [Fe/H], as shown in Fig. 2. Using [Fe/H] for the same 60 general DLAs from Prochaska et al. (2003) as before, the KS probability for the two samples being drawn from the same parent distribution is only 0.01%. The F-test reveals that the variance of the general DLA population is 2.1 times that of the H2-bearing sample but, again, this has reasonably low statistical significance since we would expect a larger variance ratio 29% of the time by chance alone. Therefore, the H2-bearing DLAs do seem to form a chemically distinct sub-class of the DLA population which may encompass a narrower range of physical conditions and environments. We note in passing that the slope of the [Fe/H]– relation for the H2-bearing DLAs, in contrast to the [M/H]– relation, is not significantly steeper than for the general DLA population. With the same fitting procedure above we find and the slope with Kendall’s and for the H2-bearing DLAs. The general DLA population gives , , and . These shallower slopes are expected if dust depletion increases in importance with decreasing redshift, as implied by the – relation discussed below (Section 3.3). We explicitly treat the evolution of the dust depletion factor in Murphy et al. (2004).
Finally, it was earlier mentioned that the above conclusions rely relatively heavily on the highest redshift H2 detection towards 0000263. If we remove this point, the straight-line fits to the [M/H]– relation give and the slope with a non-parametric correlation estimate given by Kendall’s with . Thus, the negative [M/H]– correlation is not as steep, nor as robust when the 0000263 data point is removed. However, note that the evidence supporting the hypothesis that the H2-bearing DLAs form a chemically distinct population with a potentially narrower range of physical conditions is relatively independent of the 0000263 H2 detection. Comparing the 7 remaining H2-bearing DLAs with the 49 general DLAs between from Prochaska et al. (2003) gives a KS probability of and the F-test gives a ratio of variances of 2.6 which occurs 23% of the time by chance alone.
3.3 Molecular fraction vs. Redshift
Turning to the lower panel of Fig. 1, we proceed as above and derive a straight-line fit for the – relation: , . Kendall’s is with . Thus, there is reasonable statistical evidence that the molecular hydrogen fraction increases dramatically with cosmic time. Previous studies do not explicitly identify this trend. In particular, although LPS03 plot versus for their sample of DLAs (their figure 16) they do not point out this apparently rapid evolution of with .
Again, removing 0000263 from consideration weakens the statistical significance of the – correlation but the slope remains quite steep: the new fits with 0000263 removed give , with Kendall’s and . However, we again stress the apparent reliability of the H2 detection towards 0000263 made by Levshakov et al. (2000); Levshakov et al. (2001) and point out that H2 systems with high- and high- (or, indeed, low- and low-) will need to be detected to show this correlation to be spurious.
Below we consider possible interpretations of the – trend but first discuss some systematic effects and biases.
4 Observational biases and possible systematic effects
Could the strikingly steep apparent evolution of with be significantly affected by observational selection effects? We consider some possibilities for both the [M/H]– and – correlations below.
Firstly, the H2 sample is inhomogeneous since the quasar spectra do not all have similar S/N and since the H2 detection methods and criteria were not uniform. Indeed, the weak H2 lines detected towards 0000263 and 0347383 are at the same level as the many non-detections listed by LPS03 (their figure 16). Typically, these fall in the region illustrated in Fig. 1 by the light dot-dash line. The – correlation we report is therefore only tentative. However, it seems surprising that no high-/high- or low-/low- detections of H2 have been made. Secondly, the H2 detection limit will change with redshift: observed line widths increase as , making higher- lines more detectable, but the Lyman- forest density increases roughly as , making higher- lines harder to detect due to increased blending. This will be further complicated by higher order Lyman series forest lines for DLAs at low redshift compared to their corresponding QSO. Quantification of these competing effects requires numerical simulations which mimic the (unknown and, likely, non-uniform) techniques used to detect the 8 H2 systems studied in Fig. 1.
The [M/H] and values in Fig. 1 are not specific to the H2-bearing components because H i is determined from the damped Lyman- line profile. The relative abundances of refractory (e.g. Fe) and non-refractory (e.g. Si) elements are generally found to be uniform across the absorption profiles of most DLAs (Prochaska, 2003), indicating that [M/H] is also likely to be uniform. The notable exceptions to this rule are the H2-bearing components where large dust depletion factors are found (e.g. LPS03 and the [Si/Fe] profile of 0347383 in Prochaska 2003). These components usually dominate the non-refractory metal-line profiles and so, although the derived [M/H] and measurements will be systematically underestimated, the effect will not be large. Though the fitted slopes in Fig. 1 are likely to be reasonably robust against this effect, a larger sample and more detailed study of the metal-line and Lyman series profiles is required.
Selection effects related to dust obscuration of quasars may also be present. In the H2 systems, is somewhat correlated with dust depletion factor [Zn/Fe] (LPS03), providing evidence that the H2 is formed on dust grains, a view supported by theory (Cazaux & Tielens 2002; Glover 2003, cf. Liszt 2002). However, DLAs containing large amounts of dust (i.e. those with high ) could suppress detection of their background quasars and may therefore be ‘missing’ from our sample (Fall et al., 1989). Since metallicity and dust depletion are also strongly correlated (LPS03), this effect is likely to suppress, rather than create, the correlations in Fig. 1. Further to this, Boisse et al. (1998) and Prantzos & Boissier (2000) found an anti-correlation between [Zn/H] and H i in DLAs. For the 8 H2 systems studied here, there exists a mild correlation between H i and . If the latter is not simply fortuitous, it should have resulted in a correlation between and , opposite to that observed.
The above implies that dust obscuration bias may somewhat suppress the observed – correlation. However, several empirical studies suggest this bias is small. For example, DLA surveys using radio-selected quasars should not be subject to this bias. Recent work (Ellison et al., 2001) indicates that the number of DLAs per unit redshift interval found in previous optical DLA surveys is not significantly biased, suggesting the number of ‘missing’ DLAs is at most a factor of 2 below the radio-selected result. Nevertheless, we note 2 studies which tentatively suggest strong enhancements in the incidence of absorption towards radio-loud BL Lac objects (Stocke & Rector, 1997) and optically red quasars (Carilli et al., 1998). In the former case, many of the emission redshifts are not known and so, if intrinsic absorption occurs more frequently in BL Lacs, the comparison with Ellison et al. (2001) is not useful. For the red quasars of Carilli et al. (1998), only absorption close to the quasar redshifts was searched for and so, again, the comparison with Ellison et al. (2001) is tentative. Clearly these possible discrepancies should be resolved observationally in future work.
5 Interpretations
By selecting those DLAs exhibiting H2 absorption, one may focus on systems with a narrower range of physical conditions than the general DLA population. Tentative support for this conjecture lies in the tighter metallicity– anti-correlation observed for the 8 H2 DLAs studied here. Hou et al. (2001) recently presented detailed chemical evolution models which give a slope for the metallicity– relation of . They correct this predicted slope for various observational biases to achieve the shallower slope observed for the general DLA population. However, the steep slope observed for 8 H2 systems may be less affected by these biases and may therefore be more comparable to the uncorrected model slopes. H2-bearing DLAs could therefore provide an important probe of cosmological chemical evolution.
That there exists such a large range () in the values of in Fig. 1 may not be surprising. For example, Schaye (2001) describes a photo-ionization model for clouds in local hydrostatic equilibrium with a representative incident UV background flux, [M/H] and dust-to-metals ratio. The molecular fraction in this model shows a sudden increase of for only a small increase in the total hydrogen density. Therefore, the very steep – correlation in Fig. 1 could be achieved with a modest increase in dust content at lower redshifts, consistent with the [M/H]– correlation. Within the Schaye model, one also expects an anti-correlation between the intensity of the UV background and . However, the behaviour of the UV background flux with redshift over the range –3 is still a matter of considerable uncertainty. The strong decrease in at high may also be consistent with recent H i 21-cm absorption measurements in DLAs (Kanekar & Chengalur, 2003), where a generally higher spin temperature is found at . With an increased sample size and more detailed analyses, the – correlation, if real, may provide complementary constraints on these problems.
Acknowledgments
We enjoyed and benefitted from discussions with Ed Jenkins, Charley Lineweaver, Mark Whittle and Max Pettini. We thank the anonymous referee for critical comments which improved the manuscript. SJC gratefully acknowledges receipt of a UNSW NS Global Fellowship and MTM is grateful to PPARC for support at the IoA under the observational rolling grant. This research has made use of the NASA/IPAC Extragalactic Database (NED) which is operated by the Jet Propulsion Laboratory, California Institute of Technology, under contract with the National Aeronautics and Space Administration.
References
- Baker et al. (2000) Baker A. C., Mathlin G. P., Churches D. K., Edmunds M. G., 2000, in Favata F., Kaas A., Wilson A., eds, ESA SP Vol. 445, Star Formation from the Small to the Large Scale. European Space Agency, Noordwijk, The Netherlands, p. 21
- Boisse et al. (1998) Boisse P., Le Brun V., Bergeron J., Deharveng J., 1998, A&A, 333, 841
- Boissier (2003) Boissier S., 2003, in McWilliam A., Rauch M., eds, Carnegie Observatories Astrophysics Series Vol. 4, Origin and Evolution of the Elements. Carnegie Observatories, Pasadena, USA
- Boissier et al. (2003) Boissier S., Péroux C., Pettini M., 2003, MNRAS, 338, 131
- Briggs et al. (2001) Briggs F. H., de Bruyn A. G., Vermeulen R. C., 2001, A&A, 373, 113
- Briggs et al. (1985) Briggs F. H., Wolfe A. M., Turnshek D. A., Schaeffer J., 1985, ApJ, 293, 387
- Carilli et al. (1998) Carilli C. L., Menten K. M., Reid M. J., Rupen M. P., Yun M. S., 1998, ApJ, 494, 175
- Cazaux & Tielens (2002) Cazaux S., Tielens A. G. G. M., 2002, ApJ, 575, L29
- Ellison et al. (2001) Ellison S. L., Yan L., Hook I. M., Pettini M., Wall J. V., Shaver P., 2001, A&A, 379, 393
- Fall et al. (1989) Fall S. M., Pei Y. C., McMahon R. G., 1989, ApJ, 341, L5
- Glover (2003) Glover S. C. O., 2003, ApJ, 584, 331
- Hou et al. (2001) Hou J. L., Boissier S., Prantzos N., 2001, A&A, 370, 23
- Kanekar & Chengalur (2003) Kanekar N., Chengalur J. N., 2003, A&A, 399, 857
- Kulkarni & Fall (2002) Kulkarni V. P., Fall S. M., 2002, ApJ, 580, 732
- Le Brun et al. (1997) Le Brun V., Bergeron J., Boisse P., Deharveng J. M., 1997, A&A, 321, 733
- Ledoux et al. (2003) Ledoux C., Petitjean P., Srianand R., 2003, MNRAS, 346, 209
- Ledoux et al. (2002) Ledoux C., Srianand R., Petitjean P., 2002, A&A, 392, 781
- Levshakov et al. (2001) Levshakov S. A., Kegel W. H., Agafonova I. I., 2001, A&A, 373, 836
- Levshakov et al. (2000) Levshakov S. A., Molaro P., Centurión M., D’Odorico S., Bonifacio P., Vladilo G., 2000, A&A, 361, 803
- Levshakov et al. (2001) Levshakov S. A., Molaro P., Centurión M., D’Odorico S., Bonifacio P., Vladilo G., 2001, in Cristiani S., Renzini A., Williams R., eds, Deep Fields. Springer, Berlin, Germany, p. 334
- Liszt (2002) Liszt H., 2002, A&A, 389, 393
- Lu et al. (1996) Lu L., Sargent W. L. W., Barlow T. A., Churchill C. W., Vogt S. S., 1996, ApJS, 107, 475
- Molaro et al. (2000) Molaro P., Bonifacio P., Centurión M., D’Odorico S., Vladilo G., Santin P., Di Marcantonio P., 2000, ApJ, 541, 54
- Murphy et al. (2004) Murphy M. T., Curran S. J., Webb J. K., 2004, in Duc P.-A., Braine J., Brinks E., eds, IAU Symp. Ser. Vol. 217, Recycling intergalactic and interstellar matter. Astron. Soc. Pac., San Francisco, CA, U.S.A
- Petitjean et al. (2000) Petitjean P., Srianand R., Ledoux C., 2000, A&A, 364, L26
- Petitjean et al. (2002) Petitjean P., Srianand R., Ledoux C., 2002, MNRAS, 332, 383
- Pettini et al. (1995) Pettini M., King D. L., Smith L. J., Hunstead R. W., 1995, in Meylan G., ed., QSO Absorption Lines. Springer-Verlag, Berlin, Germany, p. 71
- Pettini et al. (1997) Pettini M., King D. L., Smith L. J., Hunstead R. W., 1997, ApJ, 478, 536
- Prantzos & Boissier (2000) Prantzos N., Boissier S., 2000, MNRAS, 315, 82
- Prochaska (2003) Prochaska J. X., 2003, ApJ, 582, 49
- Prochaska et al. (2003) Prochaska J. X., Gawiser E., Wolfe A. M., Castro S., Djorgovski S. G., 2003, ApJ, 595, L9
- Prochaska & Wolfe (1997) Prochaska J. X., Wolfe A. M., 1997, ApJ, 487, 73
- Rao et al. (2003) Rao S. M., Nestor D. B., Turnshek D. A., Lane W. M., Monier E. M., Bergeron J., 2003, ApJ, 595, 94
- Reimers et al. (2003) Reimers D., Baade R., Quast R., Levshakov S. A., 2003, A&A, 410, 785
- Ryan-Weber et al. (2003) Ryan-Weber E. V., Webster R. L., Staveley-Smith L., 2003, MNRAS, 343, 1195
- Schaye (2001) Schaye J., 2001, ApJ, 562, L95
- Srianand et al. (2000) Srianand R., Petitjean P., Ledoux C., 2000, Nat, 408, 931
- Stocke & Rector (1997) Stocke J. T., Rector T. A., 1997, ApJ, 489, L17
- Vladilo et al. (2000) Vladilo G., Bonifacio P., Centurión M., Molaro P., 2000, ApJ, 543, 24
- Wolfe (2001) Wolfe A. M., 2001, in Funes José G. S. J., Corsini E. M., eds, ASP Conference Series Vol. 230, Galaxy Disks and Disk Galaxies. Astron. Soc. Pac., San Francisco, CA, U.S.A, p. 619
This paper has been typeset from a TeX/ LaTeX file prepared by the author.