The Proximity Effect Around High Redshift Galaxies
Abstract
Recent observations have shown that the intergalactic medium (IGM) is more transparent to Ly photons close to Lyman Break Galaxies (LBGs) than at large distance from them, i.e. a proximity effect. Cosmological simulations including winds from LBGs have been so far unable to explain this trend. By coupling such simulations with the radiative transfer code CRASH, we investigate whether the addition of the ionizing radiation emitted by LBGs can increase the transmissivity by decreasing the neutral hydrogen fraction in the inner Mpc of the galaxy halo. The transmissivity as a function of distance is roughly reproduced only if LBGs are identified with dwarf galaxies (with masses ) which are undergoing a vigorous ( yr-1) burst of star formation. Similar star formation rates in larger galaxies are not sufficient to overwhelm the large recombination rates associated with their denser environment. If so, photoionization partly reconciles theory with observations, although we discuss a number of uncertainties affecting both approaches.
keywords:
cosmology: theory - radiative transfer - cosmological simulations - intergalactic medium - quasar spectra1 Introduction
In a recent study, Adelberger et al (2003, hereafter A03) have analyzed
a sample composed of 8 high-resolution QSOs spectra at and
spectroscopic redshifts for 431 Lyman-break galaxies (LBGs) at slightly lower
, to study the intergalactic medium (IGM) close to high- galaxies and
detect imprints of galaxy-IGM interplay.
Comparing the location of galaxies to the absorption lines in QSOs spectra,
the authors found that the mean Ly transmitted flux generally
increases with the line-of-sight impact parameter between the foreground galaxies
and the background QSOs (), reaching the mean transmissivity of 0.67
at comoving Mpc; hovever, the trend is reversed
within about comoving Mpc of the galaxy.
This result indicates that the IGM contains less neutral hydrogen close
to LBGs, and hence is more transparent to Ly photons, than at large
distance from them.
Similar observations at lower redshift show an opposite behavior. Lanzetta
et al (1995), Chen et al (1998) and Pascarelle et al (2001)
find that galaxies, at , with an impact parameter comoving kpc are much more often associated with Ly
absorption lines than those at larger impact parameters. Furthermore the
result of VLT/UVES study of the Ly forest in the vicinity of the
LBG MS1521-cB58 at (Savaglio, Panagia & Padovani 2002) shows
an absorption excess close to the galaxy.
A03 suggest that the relative lack of neutral hydrogen at small distances from LBGs is possibly due to the dynamical feedback from supernova-driven winds, which may be able to accelerate the surrounding gas up to velocities exceeding the escape velocity of the galaxy potential well, driving plausibly the intergalactic material out to a distance comoving Mpc.
This scenario has been investigated with numerical simulations by different groups: Croft et al (2002), Bruscoli et al (2003), and Kollmeier et al (2003). Despite the completely independent prescriptions adopted to model supernova-driven winds in these studies, none of them were able to reproduce A03 results on the entire distance range. Unless feedback schemes are still far too crude in SPH simulations, the discrepancy indicates that the energy injection from supernova explosions is not able to displace the IGM around galaxies to distances comoving Mpc. The most likely explanation is that the ram-pressure of the accreting/infalling gas slows down and effectively confines winds to relatively modest distances from the explosion sites (Bruscoli et al. 2003).
Local photoionization by galaxies themselves provide the only known alternative mechanism able to decrease the neutral hydrogen fraction in the LBG environment. The first attempts to account for local photo-ionization in numerical simulations have been performed using simplified analytical techniques and/or ad-hoc prescriptions (A03, Kollmeier et al. 2002, Croft et al. 2002); these studies have lead to conclude that this process cannot account for the observed IGM transparency. However, fully self-consistent and detailed radiative transfer calculations are required before a final conclusion is drawn.
In this Letter we investigate the role of local photoionization using high resolution numerical simulations performed with the radiative transfer code CRASH ; the full description of the code and of the tests made are given in Maselli, Ferrara & Ciardi (2003).
2 Simulations
We have performed radiative transfer simulations in order to evaluate self-consistently the proximity effect due to the ionizing radiation emitted by high redshift galaxies on the surrounding IGM. We use the numerical code CRASH (Maselli et al. 2003) which allows to calculate the effects of ionizing radiation on a precomputed cosmological density field, specifically obtained from SPH simulations fully described elsewhere (Marri et al. 2003) and already used by Bruscoli et al. (2003). In the following we give the details of the two simulations.
2.1 Hydrodynamics
The simulation has been carried out with an improved version of the SPH code GADGET2 (Springel et al. 2001), designed for the detailed study of galaxy formation (Marri & White 2002). Such multi-phase (MSPH) scheme is based on an explicit separation of protogalactic gas into diffuse and dense (star forming) components and includes new prescriptions for a realistic treatment of stellar feedbacks. With respect to the standard GADGET2 version, this new implementation is able to suppress star formation, to reheat cold gas and to drive outflows from galactic disks. The presence of a UV background (UVB) produced by QSOs and filtered through the IGM is also included. The shape and amplitude of the UVB are taken from Haardt & Madau (1996) and its impact on the IGM temperature and ionization structure is calculated as in Katz et al. (1996).
The simulation uses particles in a 10.5 comoving Mpc box and assumes a CDM cosmological model with , , and ; the initial density perturbations power spectrum is cluster-normalized () and periodic boundary conditions are assumed. Galaxies are identified by applying the HOP group finding algorithm (Eisenstein & Hut 1998) to the baryonic components of the simulation. Each galaxy is assigned a star formation rate (SFR) calculated by considering the properties of all particles within the group. For each of them we first check if the conditions under which a gas particle can form stars are satisfied and we calculate the rate at which its gas is converted into stars. For more details we defer the reader to Marri & White (2002).
For consistency sake, we use the same output as in Bruscoli et al. (2003). There we showed that, although on large scales the simulation reproduces a number of statistical properties of the IGM, it does not match the transmitted Ly flux inside 1 comoving Mpc as measured by A03. Such an output has now been post-processed using CRASH to self-consistently include the effects of local photoionization produced by the galaxies identified in the computational volume.
2.2 Radiative Transfer
The radiative tranfer (RT) simulation has been performed on the outputs at of the MSPH simulation above, to allow a direct comparison to the observational data available around this redshift (A03).
The RT is simulated running the 3-D RT code CRASH , whose description is fully reported in Maselli et al. (2003). The code works on precomputed H/He density fields assigned in a 3-D cartesian grid, and calculates the time evolution of the temperature and of the ionization structure.
To include the effect of local photoionization on the
cosmological configuration obtained from the MSPH simulation, it is necessary to
map the particle data on a 3-D cartesian grid. We choose a grid composed of
1283 cells, which corresponds to a spatial resolution of
kpc comoving.
At each grid point we assign a value for the mass density (),
temperature (), neutral hydrogen fraction
() and free electrons fraction
(), performing a standard SPH
smoothing using the 32 neighbour SPH particles closer to the grid point.
We next locate the 398 galaxies identified
inside the simulation box on the cartesian grid, converting the
lagrangian spatial coordinates into cartesian coordinates.
The emission properties of the galaxies have been derived using
the Starburst99 code (Leitherer et al. 1999), a web based
software and data package designed to model spectrophotometric and related
properties of star-forming galaxies. We have assumed a continuous star
formation law and a Salpeter IMF with , normalized in a mass
range [1,100]; we also take Z⊙/5 as a characteristic
metallicity for all the sample.
These values are suggested by the analysis
of the LBGs UV continuum and the Hα and Hβ emission lines by
Pettini et al. (2001). As the physical connection of LBGs with galaxy type/mass
is unclear (Primack et al. 2003), we assume for all galaxies in the box
similar scalings. Running Starburst99 under the above conditions,
we obtain the galaxy SED corresponding to the derived SFR of each galaxy.
We finally assume a value for the ionizing photon escape fraction of
50%.
This value represents the upper limit of the allowed range (see discussion in
Ciardi, Bianchi & Ferrara 2002) from a set of observational data.
The computed grid data are assigned as initial conditions for the CRASH run. The number densities of hydrogen and helium nuclei are calculated assuming mass fractional abundances =0.76 and =0.24, respectively. Temperature and hydrogen ionization fractions are initialized as in the MSPH simulation output; for helium we assume ionization fractions and . The physical duration of a simulation run has been set to yrs, i.e. several times the estimated box-crossing-time for the ionization front produced by a typical source in the volume.
Nearby galaxies the mean gas temperature is above 105 K, due to the energy injection into the IGM produced by outflows. The cooling time of such gas in the simulation is longer than , with a minimum value equal to 1.5108 yrs. As the temperature does not change significantly during the RT simulations, its evolution has not been solved for to reduce the computational time.
Two different RT simulations have been run. In the first one only the UVB radiation is included (run A), while in the second one, the radiation from all galaxies in the simulation volume is added to the UVB (run B). In this way it is possible to compare consistenly the two simulations to infer the role of galaxies and distinguish the contribution to the proximity effect due to local photoionization. As considerable uncertainty is present in the determination of SFRs of LBGs, we also studied a case similar to run B in which however SFRs are boosted ad hoc to match the observed values.
The total ionizing energy, injected in the computational volume, is discretized in photon packets for run A and in packets for run B: roughly, this corresponds to photon packets per galaxy and photon packets for the UVB.
3 Results
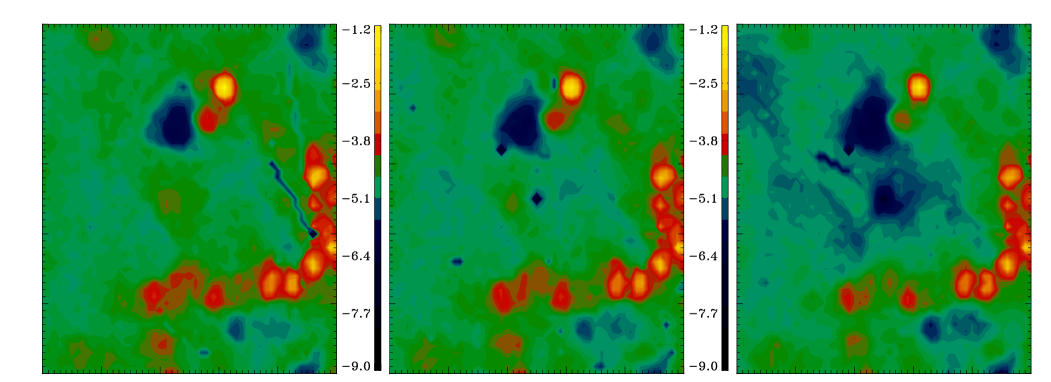
As an example, Fig.1 shows a comparison among the final outputs of run A (left panel) and run B (central and right panels). The slices represent the logarithm of the neutral hydrogen fraction on a slice of a zoomed region of about 4 comoving Mpc by side, centered on the most massive galaxy in the computational volume. The two maps from run B have been derived by assigning to such a galaxy different SFR: in the central panel the SFR is about 30 M⊙ yr-1 as derived from the MSPH simulation, while in the right panel it has been boosted by a factor of 10. The effect of the local photoionization produced by the galaxy is clearly visible in both cases and depends strongly on its luminosity, as expected. In the central panel the imprint of the galaxy on the surrounding gas is feeble and the content of neutral hydrogen in a surrounding region of 0.5 h-1 comoving Mpc by side, is reduced on average by factor of 2. The luminosity associated with a SFR of 30 M⊙ yr-1 is too low to affect significantly the high density environment of such a massive galaxy (M =M). When the SFR is boosted by a factor of 10 (right panel), the region affected by the galaxy UV flux extends up to a distance of about 1 comoving Mpc. In the inner region the neutral hydrogen fraction is depleted at least by an order of magnitude. In the outer regions the effect of the local photoionization is progressively reduced and vanishes at distances Mpc, where the UVB dominates the local UV flux. The decrease in the neutral hydrogen fraction visible in other regions far from the center is produced by other galaxies, included in run B as ionizing sources.
To estimate the radius of the “sphere of influence” produced by the local emission from a typical galaxy we study the distribution of the ratio between the UV flux produced by the galaxies and the UVB flux, , in the box. Fig.2 shows the histogram derived from the final output of run B. The distribution has a mean value and a median value . These values are to be considered as lower limits to the contribution of galaxies to the UVB, as larger boxes would be required to properly estimate such quantity. The volume in which , i.e. where the local emission by galaxies dominates the foreground UVB, is about of the total computational volume. This fraction corresponds to a mean radius of influence for a typical galaxy , given by:
| (1) |
where is the number of cells where , is the volume of a single cell and is the number of galaxies in the simulation box.
To allow a direct comparison of the simulation results with the observational data we construct synthetic Ly spectra as described in Bruscoli et al. , by tracing random LOS through the box. We then estimate the mean Ly transmitted flux as a function of the impact parameter , computing the average on all the pixels at a distance from a galaxy in a given interval centered on . The results are plotted in Fig.3 and compared with the data, represented by the black points.


The three panels show the mean Ly flux computed on different samples of galaxies: all the 398 galaxies (left panel), galaxies with mass above M⊙ (central panel) and those with mass below M⊙ (right panel).
Solid, dotted and dotted-dashed lines are derived from the outputs of run A, run B and from a simulation analogous to run B, but with SFRs boosted ad hoc. The difference between run A and run B in the left panel is marginal: we conclude that the mean effect of the local photoionization on the Ly transmitted flux is negligible when all galaxies are included in the analysis.
Massive galaxies are the best candidates for LBGs due to their high luminosity and clustering properties. The SFR derived for the most massive galaxies in the MSPH simulation are in the range M, the highest values in the simulation. Due to their high luminosity, one would expect them to produce a strong impact on the ionization of the surrounding gas. However this is not the case. Looking at the solid line in the central panel, obtained by neglecting the local emission, we note that the high density characterizing the environment of massive galaxies suppresses the mean transmitted flux with respect to the mean trend obtained for all the galaxies in the simulation (solid line in the left panel). The UV radiation emitted by these galaxies, using the SFR derived from the MSPH simulation (dotted line in central panel), is not strong enough to enhance significantly the transparency of the surrounding IGM, because of the high recombination rate in the denser environment. Higher values of SFR are necessary to produce a significant increase of the transmitted flux nearby massive galaxies. This can be seen from the boosted case, i.e. with SFR in the range M⊙ yr-1. Although on the high side, the values are still plausible according to observations (Shapley et al. , 2001). Despite the sharp increase in the mean Ly transmitted flux, yet this simulation does not match the A03 data. This result suggests that the mean transmissivity strongly depends on the galactic enviroment. The right panel shows the trend for the Ly transmitted flux obtained selecting galaxies with mass M⊙. In this case the transmissivity of the gas at Mpc has an opposite trend with respect to the mean (left panel), and seems to follow the one observed by A03. The increasing flux at smaller distance from the galaxy reflects the lower density in these regions. Here the UVB flux can counteract the recombinations which occur on longer time scales. Nevertheless the SFRs associated with these galaxies are too small (of order yr-1) to further increase the transmitted flux. Boosting the SFR up to values around 50 M⊙ yr-1 (dashed-dotted line), the increase in is significant and closely approches the observed value in the innermost region. By no means though the flux around 1 Mpc can be matched.
4 Conclusions
A recent study on the statistics of the Ly forest in the vicinity of foreground galaxies has revealed an unexpected relative lack of neutral hydrogen in the inner Mpc comoving from LBGs at . High energy supernova-driven winds able to displace the surrounding gas out to distances greater than have been proposed as a viable explanation. However, several numerical studies failed in reproducing the observed effect of such superwinds via (M)SPH cosmological simulations. According to the simulations, the velocity of the gas closest to galaxies varies around a characterisitc value of 40 km s-1 for small objects, and around 150 km s-1 for the biggest ones. These values seem to underestimate the high velocity gas, at 600 km s-1, measured by A03 at a scale of a few kpc from the galaxy center. Nevertheless, the possibility for the wind to break through the galactic halo, and into the IGM up to distances greater than comoving Mpc (even at such high velocity) seems quite unphysical if one takes into account the kinetic energy used to counteract the pressure of the accretion flow.
Motivated by these reasons, we have studied the role of local photoionization in determining the Ly absorbers statistics in the vicinity of galaxies, via numerical radiative transfer simulations. We post-processed an output at of a multiphase SPH simulation, in which a consistent treatment of supernova feedback is implemented, running the code CRASH to account for the impact of the UV flux emitted by galaxies on the simulated IGM. We have derived the synthetic mean Ly transmitted flux, as a function of the distance from a typical galaxy, for different samples of galaxies. We found that on average local photoionization has a negligible impact, i.e. when all the galaxies present in the box are considered in the flux distribution derivation.
Local phoionization can affect significantly the transparency of the surrounding IGM only for particular conditions of the galactic environment. We find that in order to reproduce the trend inferred by A03, the gas around LBGs should be less dense than that surrounding massive galaxies seen in the simulation. The transmissivity as a function of distance is roughly reproduced only if LBGs are identified with dwarf galaxies (with masses ) which are undergoing a vigorous ( yr-1) burst of star formation. Similar and higher star formation rates in larger galaxies are not sufficient to overwhelm the large recombination rates that are occurring in their denser environment. This conclusion is somewhat at odd with the common wisdom that LBGs are predominantly massive systems, although different and equally valid arguments tend to identify them with the bursting population of dwarfs that we find necessary to explain the observed gas transparency. LBGs can be interpreted as outbursting dwarf galaxies (Bullock et al. 1999) if their abundance is due to an increased collision rate at high redshift; although many of the simulated collisions have relatively small masses (), they tend to cluster about large-mass halos. They therefore exhibit strong clustering, similar to that observed.
The solve the puzzle, more data are needed. The poor statistics of A03 sample at small impact parameters, errors in measured redshifts and galaxy positions make the derived transmitted flux quite uncertain.
References
- [1] Adelberger, K. L., Steidel, C., Shapley, A. E. & Pettini, M. 2003, ApJ, 584, 45
- [2] Bruscoli, M., Ferrara, A., Marri, S., Schneider, R., Maselli, A., Rollinde, E. & Aracil, B. 2002, , MNRAS, 343, L45
- [3] Bianchi, S., Cristiani, S. & Kim, T. S., 2001, A&A, 376, 1
- [4] Bullock, J. S. et al. 1999, After the Dark Ages: When Galaxies were Young (the Universe at 2 ¡ z ¡ 5). 9th Annual October Astrophysics Conference in Maryland, College Park. Eds S. Holt & E. Smith. AIPP, 216
- [5] Chen, H. W., Lanzetta, K. M., Webb, J. R., Barcons, X. 1998, ApJ, 498, 77
- [6] Ciardi, B., Bianchi, S. & Ferrara, A., 2002, MNRAS, 331, 463
- [7] Croft, R. A. C., Hernquist, L., Springel, V., Westover, M., White, M. 2002, ApJ, 570, 634
- [8] Eisenstein, D., J. & Hut, P. 1998, ApJ, 498, 137
- [9] Kollmeier, J. A., Weinberg, D. H., Dave, R., Katz, N. 2003, ApJ, 594, 75
- [10] Lanzetta, K. M.,Bowen, T. Tytler, D, Webb, J. K. 1995, ApJ, 442, 538
- [11] Leitherer, C., Schaerer, D., Goldader, J. D., Delgado, R. M. Gonz lez, Robert, C., Kune, D. F., de Mello, D. F., Devost, D., Heckman, T. M. 1999, ApJ, 123, 3
- [12] Haardt, F. & Madau, P. 1996, ApJ, 461, 20
- [13] Heckman, T. M., Lehnert, M.D., Strickland, D.K., Armus, L. 2000, ApJS, 129, 493
- [14] Marri, S. & White , S. D. M. 2002, astro-ph/0207048
- [15] Marri, S., Ferrara, A., Bruscoli, M., Schneider, R. & Maselli, A. 2003, in preparation
- [16] Maselli, A., Ferrara, A. & Ciardi, B. 2003, 345, 379
- [17] Pascarelle, S. M., Lanzetta, K. M., Chen H. W., Webb, J. K. 2001, ApJ,560, 101
- [18] Pettini, M., Shapley, A. E., Steidel, C. C., Cuby, J., Dickinson, M., Moorwood, A. F. M., Adelberger, K. L., Giavalisco, M. 2001, ApJ, 554, 981
- [19] Primack, J. R., Wechsler, R. H. & Somerville, R. S., 2003, The Mass of Galaxies at Low and High Redshift, Proceedings of the ESO Workshop held in Venice, Italy, 24-26 October 2001, p. 284.
- [20] Shapley, A. E., Steidel, C. C., Adelberger K. L., Dickinson, M., Giavalisco, M., Pettini, M. 2001, ApJ, 562, 95
- [21] Savaglio, S., Panagia, N., Padovani, P. 2002, ApJ, 574, 590
- [22] Springel V., Yoshida, N., White, S.D.M., 2001, New Astronomy, 6,79