Auf dem Hügel 71, 53121 Bonn
cboettne@astro.uni-bonn.de, heith@astro.uni-bonn.de 22institutetext: National Radio Astronomy Observatory, P.O. Box O, Socorro, NM, 87801, USA fwalter@nrao.edu
High-angular resolution HC3N and CS observations of the dense core in the cirrus cloud MCLD123.5+24.9
Abstract: We report on high-angular resolution observations of a dense core in the cirrus cloud MCLD123.5+24.9 obtained with the PdB and the OVRO interferometers. Our maps show substructures down to the scale of the beam ( AU). The chosen molecules CS (2-1) and HC3N (10-9) trace different regions in the core. This can be explained by time-dependent chemical evolution of the cloud and therefore provides constraints on the timescales of the fragmentation and core formation processes. Our data demonstrate that the chemical evolution plays the decisive role in our attempt to interpret observational data of different gas density tracers.
1 Introduction
Galactic cirrus clouds are typically complexes of diffuse gas and dust most easily seen at high galactic latitudes. On large scales they are dominated by turbulent motions, however, on small scales dense cores have been found and there is evidence that these cores are gravitationally bound (Heithausen et al. 2002).
In one core, even the spectral signature of infall motion was discovered (Heithausen 1999).
Core formation constitutes the very first step which leads to star-formation and is still rather poorly understood. The knowledge of how cores form and how they evolve is important for understanding the minimal physical conditions needed for stars to form. Studying the evolution of dense cores in cirrus clouds, which live in a rather quiescent environment and are mainly heated by the interstellar radiation field, may prove to be crucial to interpret observations of star-forming regions correctly.
One of the best studied cirrus cloud cores so far is the one in MCLD123.5+24.9, located in the Polaris Flare, a huge cirrus cloud complex in the direction of the north celestial pole. Its distance is between 130 and 240 pc (cf. Heithausen et al. 1993),
and here we adopt a value of 150 pc. The temperature of the dust was determined to 13 K (Bernard et al. 1999)
and the kinetic temperatures of the gas between 6 and 15 K (e.g. Großmann & Heithausen 1992).
Here we present new high-angular resolution HC3N and CS observations of this core
which allow a much closer insight into the fragmentation and core formation processes.
2 Observations
The observations of the HC3N (10-9) transition at 90.98 GHz were conducted between May and November 2002 with the IRAM Plateau de Bure (PdB) interferometer. The standard CLIC reduction procedure was applied. Phase stability was checked with frequent observations of the quasars 1928+738 and 0716+714 and the amplitude scale was derived from measurements of MWC349 and CRL618.
The CS (2-1) line observations were carried out using the Caltech OVRO millimeter interferometer from January to April 2001. In total, 5 tracks were spent on source in the ’C’ and ’L’ configurations. The nearby source J1803+784 was used for phase calibration. The data for each array were edited and calibrated separately with the MMA and MIRIAD packages. The uv-data were inspected and bad data points due to either interference or shadowing between telescopes were removed, after which the data were calibrated.
We then corrected the data for zero spacing with our dataset obtained with the IRAM 30m telescope. The effective synthesized beam FWHM of is similar in both observations (but with different position angles of and , respectively) equivalent to 900 AU 1200 AU at the distance of 150 pc.
3 Results
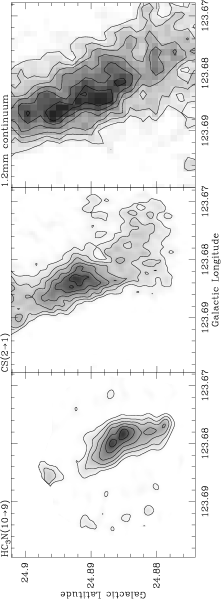
Our maps (see Fig. 1) show substructures down to the scale of the beam and the cores are clearly elongated. Most interesting is the complete misalignment of the HC3N and the CS clumps, which was already suggested by the single dish data. However, the HC3N clump was not resolved at all by the single dish observations and also the CS structures were barely resolved.
The HC3N clump resides at the southern edge of the core, is elongated and divides in substructure, whereas the CS emission is much more extended and the maximum, where the spectral signature of infall motion can be seen (cf. Heithausen 1999),
lies more towards the north of the core. Nevertheless, there is still CS emission seen along with the HC3N, even a small local maximum at the position of the HC3N peak.
Heithausen et al. (2002)
presented a dust continuum emission map of the core obtained with the MAMBO array at the IRAM 30m telescope with a resolution of 11′′, hence roughly comparable to our resolution. The dust shows again a somewhat different behavior than the gas components. The filamentary structure of the whole core can be seen much better and only one elongated dense core, nevertheless with a lot of substructure down to the scale of the beam, is visible. This dust core corresponds well with the CS emission but is even more extended and clearly includes also the HC3N clump. Therefore we can conclude that we are looking at one cirrus cloud core with a lot of substructure due to fragmentation and strong small scale variations in the molecular abundances.
4 Discussion
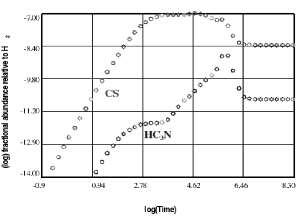
The most likely explanation for this appearance is that it is caused by strong abundance variations of the observed molecules due to time dependent chemical evolution. There are several chemical models in the literature which can account for the observed behavior. One that matches our derived properties of the core quite good is the one of Markwick et al. (2000), constructed for TMC-1, a low-mass star forming region. The initial conditions in this model are a temperature of 10 K, a hydrogen number density , a cosmic ray ionization rate of , and the UMIST Database for Astrochemistry 1995 reaction set (Millar et al. 1995). This model predicts a time delay of HC3N compared to CS in reaching a measurable high abundance of years (see Fig. 2). By this time the CS, which attained its highest abundance very fast after only years, may already start to deplete due to freezing out on dust grains.
This result is further supported by a time-dependent chemical model of core formation by Taylor et al. (1998), which basically comes to the same results with somewhat different initial conditions. Their main conclusion is, that CS can be seen in more or less the whole core, whereas the HC3N on the other hand can only be observed in longer-lasting clumps. This behavior is essentially a result of the cold ( K) gas chemistry where also neutral-neutral reactions play a surprisingly important role.
5 Conclusions
We observed a core in the cirrus cloud MCLD123.5+24.9 with high-angular resolution in the molecules HC3N and CS. Our data show a spatial offset of the maxima of both molecules and substructures down to the scale of 1000 AU. The misalignment can be explained by the interplay of time-dependent chemical evolution and fragmentation. The HC3N traces only the older part of the core, whereas the CS is much closer tracing the density structure of the whole core as seen also in the dust continuum. This provides us with constraints on the timescales of the core formation process of a few years, the time HC3N needs to reach a measurable high abundance.
References
- (1) J.P. Bernard, A. Abergel, I. Ristorcelli, et al.: A&A 347, 640 (1999)
- (2) V. Großmann & A. Heithausen: A&A 264, 195 (1992)
- (3) A. Heithausen, et al: A&A 268, 265 (1993)
- (4) A. Heithausen: A&A 349, L53 (1999)
- (5) A. Heithausen, F. Bertoldi, & F. Bensch: A&A 383, 591 (2002)
- (6) A.J. Markwick, T.J. Millar, & S.B. Charnley: ApJ 535, 256 (2000)
- (7) T.J. Millar, P.R.A. Farquhar, & K. Willacy: A&AS 121, 139 (1995)
- (8) S.D. Taylor, O. Morata, & D.A. Williams: A&A 336, 309 (1998)