email: maraston@mpe.mpg.de 22institutetext: European Southern Observatory, Karl-Schwarzschild-Str. 2, 85748 Garching, Germany 33institutetext: Universitäts-Sternwarte München, Scheinerstr. 1, D-81679 München, Germany 44institutetext: Carnegie Observatories, 813 Santa Barbara Str., Pasadena, CA 91101-1292, USA 55institutetext: Space Telescope Science Institute, 3700 San Martin Drive, Baltimore, MD21218 66institutetext: Astronomical Institute, Utrecht University Princetonplein 5, 3584 CC Utrecht, The Netherlands
The dynamical mass of the young cluster W3 in NGC 7252:
We have determined the dynamical mass of the most luminous stellar cluster known to date, i.e. object W3 in the merger remnant galaxy NGC 7252. The dynamical mass is estimated from the velocity dispersion measured with the high-resolution spectrograph UVES on VLT. Our result is the astonishingly high velocity dispersion of . Combined with the large cluster size , this translates into a dynamical virial mass for W3 of . This mass is in excellent agreement with the value () we previously estimated from the cluster luminosity () by means of stellar ratios predicted by Simple Stellar Population models (with a Salpeter IMF) and confirms the heavy-weight nature of this object. This results points out that the NGC 7252-type of mergers are able to form stellar systems with masses up to . We find that W3, when evolved to 10 Gyr, lies far from the typical Milky Way globular clusters, but appears to be also separated from Cen in the Milky Way and G1 in M31, the most massive old stellar clusters of the Local Group, because it is too extended for a given mass, and from dwarf elliptical galaxies because it is much more compact for its mass. Instead the aged W3 is amazingly close to the compact objects named ultracompact dwarf galaxies (UCDGs) found in the Fornax cluster (Hilker et al. 1999; Drinkwater et al. 2000), and to a miniature version of the compact elliptical M32. These objects start populating a previously deserted region of the fundamental plane.
Key Words.:
galaxies: star clusters - galaxy: individual: NGC 7252 - stars: fundamental parameters1 Introduction
About a decade ago, HST observations (Holtzmann et al. 1992) confirmed the early ground-based discovery (Schweizer 1982) that mergers and merger remnant galaxies host luminous, compact objects. These are believed to be candidate young globular clusters (GCs) on the basis of their blue colours, high luminosities, and compactness as derived from the small radii. They were predicted to form during the (violent) interaction caused by the merger event (Schweizer 1987). The properties of these star clusters, such as their number, masses, ages and metallicities have attracted a number of studies (see review by Schweizer 1998) since they impact on the success of the scenario in which elliptical galaxies form via merging of spirals. Leaving aside pros and cons of this view, comprehensively discussed in Kissler-Patig (2000), the formation of star clusters during mergers is nowadays an accepted fact. Besides helping in exploring the connection to the host galaxy, the properties of young stellar clusters aid in understanding the poorly known process of star cluster formation. Among the various properties, the present paper focuses on the cluster mass. A striking feature of the star clusters detected in galactic mergers and merger remnants are the high stellar masses reached by some of the members, as derived using ratios from stellar population models. For example, in the “Antennae” galaxies, the most luminous objects have masses up to a few (e.g. Zhang & Fall 1999). Such luminous masses are larger than the mean mass of old globular clusters in the Milky Way (, e.g. Harris 1991), but are comparable to the mass of the most massive galactic GCs, like 47 Tuc (, Meylan & Mayor 1986) especially considering that (some) cluster mass will be lost. The percentage of mass loss due to stellar evolution between 30 Myr and 15 Gyr is only (Maraston 1998), but dynamical processes such as evaporation and tidal disruption are also expected to reduce masses of GCs. However the amount is difficult to estimate, since it depends on the exact orbit of the cluster, its number of particles and the potential of the parent galaxy. Recent N-body simulations for potentials appropriate for spiral galaxies (Baumgardt & Makino 2003) indicate values from of dynamical mass-loss, to a negligible amount of dynamical mass loss when the cluster is populous enough (). For the potential of an early-type system similar predictions are not yet available.
This work focuses on the most extreme case of a superluminous star cluster known to date, i.e. object W3 in NGC 7252. Its luminosity-derived mass is in the range (Schweizer & Seitzer 1998; Maraston et al. 2001). These values are more than ten times larger than those of the star clusters in the “Antennae”, in spite of W3 being significantly older (, Schweizer & Seitzer 1998, Maraston et al. 2001). However, the mass determination via population synthesis models is affected by uncertainties in the age determination. As stellar ratios increase with age due to the fading of the light, an overestimation of the cluster age leads to an overestimation of its mass (other effects like metallicity and initial mass function playing a minor rôle).
Given the potential impact of such high masses on the formation of stellar systems, in particular in violent interactions and extreme environments, the light-derived masses have to be checked by comparing them with the values determined dynamically. The first succesful attempt in this direction was by Ho & Filippenko (1996) for the young star clusters of NGC 1569 (see Section 5), and more recently by Mengel et al. (2002) for those in the “Antennae”. Here we have employed the spectrograph UVES on VLT to obtain a high-resolution optical spectrum of W3 in order to measure its velocity dispersion, and hence its virial mass. This paper reports on the (spectacular) results for W3. We will devote a follow-up paper to present the results for the other star clusters measured during the same observing program.
2 Determination of velocity dispersion
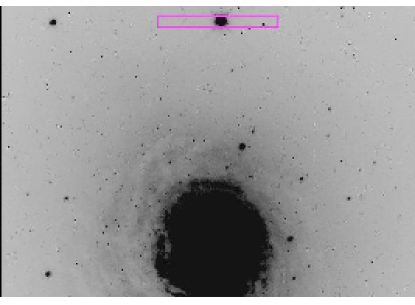
We obtained a high-resolution, high signal-to-noise (S/N per pixel), visual spectrum of W3 using the UltraViolet Echelle Spectrograph (UVES) mounted on the ESO/VLT. The data were acquired during 2001 in service mode. The spectrum covers the wavelength range Å (setup Dichroic mode 1, CD#2+#3)) with a spectral resolution of 2 km/sec. Standard stars of spectral types A to K were acquired with the same setup in order to construct an appropriate stellar template to be used to measure the velocity dispersion (see below). The mean seeing during our runs was about 0.65 arcsecond FWHM at 5000 Angstroems. A narrow slit () was employed in order to minimize the background contamination. The slit lenght was , the position angle was and the slit was centered on the object within less than 1 pixel, or . Figure 1 shows the portion of the WFPC2 image of NGC 7252 that contains W3, with the UVES slit superimposed on the object. The data were reduced by means of the UVES pipeline. The UVES pipeline includes a standard procedure for the subtraction of the background light, that applies well in case of a standard setting, like that adopted by us. To strenghten our confidence concerning the background contamination, we evaluate the surface brightness of the unresolved light around W3 in a series of apertures around it from 15 to 20 pixels, and we found . Thus the galaxy is much fainter than W3 () and the contamination is clearly insignificant.
We determined the line-of-sight velocity dispersion of W3 using an adapted version of the Fourier Correlation Quotient (FCQ, Bender 1990) method as implemented by Bender, Saglia and Gerhard (1994). Following Gerhard et al. (1998), the optimal order for the polynomial fitting of the continuum was determined from Monte Carlo simulations, as well as the statistical errors of the derived parameters. The wavelength range was chosen to avoid intrinsically broadened lines (e.g., the Balmer series), thus excluding the blue ( Å) section of the UVES spectrum. In the reddest section ( Å) no strong lines are available for kinematical analysis. The final results were obtained using the region redwards of (see Figure 1, where the spectrum of W3 has been blue-shifted to zero-redshift), comprising the Mg and Fe lines.
| Template | Sp | (km/s) |
|---|---|---|
| HD 204943 | A7V | 37 |
| HD 3229 | F5IV | 60.2 |
| HD 8048 | F3V | 54 |
| HD 8462 | F0V | 48 |
| Composite | – | 45 |
When spectra of stars as hot as the ones present in W3 are considered, even for these metallic lines the intrinsic broadenings are much larger than the UVES instrumental resolution ( km/s for the A7V star, see Table 1). Therefore, it is important to test the effects of various templates. We considered: i) different individual stellar templates; and ii) a composite stellar template. The latter template aims at reproducing the photometric properties of the cluster as close as possible and was obtained by coadding individual stellar spectra with weights determined via the best-fitting stellar population model for W3. Following Maraston et al. (2001), such a model is a Simple Stellar Population (SSP, i.e. a single metallicity instantaneous burst) with age of 300 Myr and metallicity , and it is shown to reproduce both the optical and near-IR light extremely well. From this model we determine the contributions to the visual spectrum (i.e. the region of application of FCQ) of the various stellar temperature bins. These are: for the main sequence stars around the turnoff (), with other main sequence stars contributing roughly ; for helium-burning giants (); for Thermally Pulsing-AGB stars. While template spectra for the TP-AGB stars are not available, they are very cool and have small line widths, whence their inclusion would increase the velocity dispersion (see Table 1). The spectrum of the composite template is then: . We note that a similar template would have been obtained if we would have considered for W3 an SSP with solar metallicity and the slightly older age of , a model that also provides a very good match to the optical spectrum of W3 (Schweizer & Seitzer 1998).
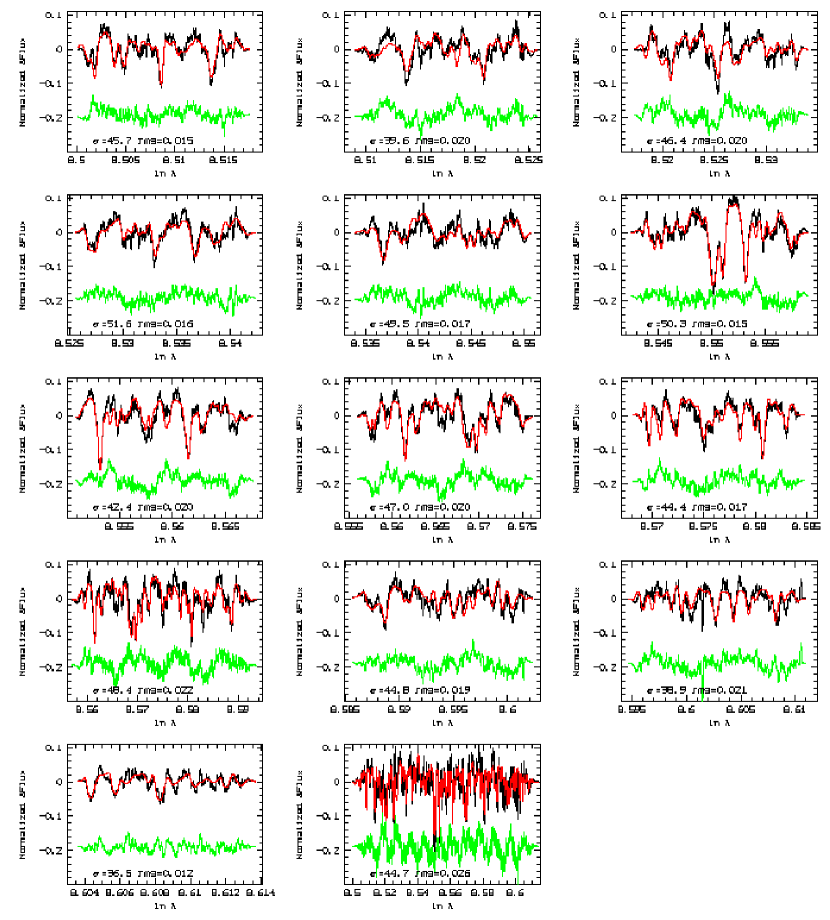
The individual echelle orders of the continuum subtracted and normalized spectrum of W3 (black lines) are shown in Figure 2. For presentation reasons we smoothed the original spectrum with a box average running mean of 20 pixel radius. The heliocentric radial velocity derived averaging over the echelle spectra presented in Figure 1 is , that compares very well with the value given by Schweizer & Seitzer (1998) of .
We derived the value of the velocity dispersion fitting each unsmoothed single order independently. The red lines in the Figure show the corresponding broadened composite template. The green lines display the difference to the smoothed spectrum of W3, shifted by 0.15 units for clarity. The rms of the differences are also given. The last panel shows the whole -range.
The ’s derived from the single orders range from 36.5 to 51.6 km/sec, with a mean of 45 km/sec and r.m.s. of 5 km/sec. The r.m.s. of the difference is in the range . Monte Carlo simulations matching the S/N of the observations reveal no systematic bias. The estimated (statistical) error for the single echelle order is 5 km/sec. For completeness, we list in Table 1 the ’s obtained for W3 using the individual stellar templates. As our final value of the velocity dispersion of W3 we adopt that obtained with the composite template: . This is much larger than any value determined so far for galactic (see the compilation by Pryor & Meylan 1993) and extra-galactic (see Sect. 5.1) GCs.
3 Structure and radius of W3
We use the most recent version of Ishape (Larsen 1999) to measure the structural parameters of W3 on the images obtained with HST/WFPC2 through the F555W filter with an exposure time of 60 s. and available through the HST archive. First, we created a synthetic PSF using TinyTim 111version 5.0 as available at http://www.stsci.edu/software/tinytim at the position of W3 on the chip. For the input spectrum of TinyTim we used a blackbody with of 6500 (having tested that blackbodies of other temperatures did not affect the results). We then checked if Ishape could resolve any point-like sources at the distance of NGC 7252 (64.4 Mpc, see e.g. Schweizer & Seitzer 1998), by running it on 10 isolated bright sources at various locations on the PC, W3 included. For these sources a King (1966) profile with a concentration index (i.e. the ratio of the tidal radius to the core radius) of 30 has been assumed. The returned values of the FWHM ranged between 0.17 and 0.71 pixels, showing the presence of both extended and point-like sources on the PC. We then ran Ishape on W3 assuming various analytical models.
| Model | FWHM (pix) | |||
|---|---|---|---|---|
| King5 | 1.61 | 1.14/16.2 | 0.71 | 2.75 |
| King30 | 0.71 | 1.05/14.9 | 0.76 | 1.2 |
| King100 | 0.48 | 1.23/17.5 | 0.79 | 1.0 |
| Moffat15 | 1.13 | 1.18/16.8 | 0.77 | 1.45 |
| Moffat25 | 1.69 | 1.15/16.3 | 0.73 | 2.3 |
| Gaussian | 2.28 | 1.14/16.2 | 0.75 | 4.02 |
The output structural parameters for these models are given in Table 2, where the number after ‘King’ refers to the concentration index, that after ‘Moffat’ to the power index multiplied by 10. The reduced for each model (), normalized to the of model King100 are given in the last column. The expected statistical uncertainty is and refers to 70 degrees of freedom.
As the more extended King models reproduce the cluster light profile significantly better, it is very likely that W3 is an extended object. Further, since the ratio of minor to major axis () is found to be consistently for all models, it is safe to say that W3 is significantly flattened. The effect of the fitting radius on the derived cluster size has been assessed by varying it between 5 and 20 pixels, and the variations are of the order of 1 pc, therefore well within the observational errors. The derived effective radii for the best fitting model (King100) range between 14.9 pc and 18.5 pc, for all possible combinations of model profile and fitting radius. From all fits, we conclude that the best value of for W3 is 17.5 pc. This value is larger than those for most young stellar clusters. For comparison, for the clusters in the “Antennae” typical effective radii are found to be (Whitmore et al. 1999).
The we obtain here for W3 is significantly larger than the 7 pc obtained by Miller et al. (1997). This is likely due to the extended envelope of W3, which fell beyond the small apertures used by Miller et al. (1997) for their size estimates. The aperture method used missed flux and oversubtracted background (which contained cluster-envelope light), with the final effect of underestimating the cluster radius. To test this hyphotesis we ran Ishape on the other clusters of NGC 7252 with extended wings, i.e. W6, W26 and W30, and on those that do not have extended wings, i.e. W32 and W35. For the former we find sizes systematically larger than those given by Miller et al. (1997), while for the latter we derive values perfectly consistent with those by Miller et al..
4 Dynamical mass of W3
According to Spitzer (1987), the virial mass of a cluster is where is the one-dimensional velocity dispersion, the factor 3 relating it with the actual velocity dispersion; (, Spitzer 1987) is the half mass radius; is the factor connecting the half-mass radius to the gravitational radius, the latter being the radius to be used into the virial theorem. Using the value of obtained with the composite template, and , we obtain: . As will be discussed in Section 5, this value is in excellent agreement with that we derived previously using stellar ratios predicted by evolutionary population synthesis models (see Maraston et al. 2001). The assumption behind the determination of a virial mass is that W3 is a relaxed system, i.e. self-gravitating and stable.
The half-mass relaxation time according to Spitzer (1987) is where is the half mass radius (in pc), is the total number of stars, is the typical stellar mass (in ), i.e. , with the total mass of the cluster. is determined by integrating the Salpeter mass function from 100 down to a lower limit of , and normalizing the IMF scale factor to the present mass taking into account both living stars and stellar remnants (according to the prescriptions given in Maraston 1998). The number of stars is estimated to be . Using (see Section 3), we obtain . We conclude that, contrary to usual globular clusters, W3 is not collisionally relaxed. Nevertheless, its crossing time is very short ( yr), much smaller than its age ( Myr, see above). Therefore we expect that, like in elliptical galaxies, violent relaxation has taken place, virializing the system.
It is extremely unlikely that W3 is a superposition of smaller clusters for the following reasons: 1) the surface brightness profile of W3 is very smooth (almost a PSF); 2) W3 is located in a quite uncrowded area from the center (see Miller et al. 1997, Figure 6; Maraston et al. 2001, Figure 1) where not many objects are found; and 3) the component clusters would need to possess almost identical spectral type and radial velocity to be invisible in the spectrum.
5 Discussion
5.1 Mass
Our main result is the perfect agreement between the dynamical mass determined here for W3, and the luminous mass as derived for it from model ratios (Maraston et al. 2001). Recalling those results, a luminous mass was obtained for a Salpeter IMF with lower and upper mass cutoffs of 0.1 and 100 , respectively; for a Gould IMF (Gould, Bahcall & Flynn 1997), i.e. an IMF the slope of which flattens with respect to Salpeter at the low mass-end (). The mass derived using a Salpeter IMF is amazingly close to the dynamical estimate. In case one prefers the Gould-type IMF, roughly 45 % of the total mass of W3 inside the half-mass radius should be dark, but it is clearly not possible to discriminate among the two options. It should be noted that the same agreement is found for the luminous masses as derived from the near-IR M/L (Maraston et al. 2001).
The modeling of W3 as a simple stellar population of 300 Myr, appears very self-consistent from every side, colours, Balmer lines (Schweizer & Seitzer 1998), . This favours the idea that W3 is a globular cluster, since all but one globular clusters in the Milky Way are simple stellar populations. However, as initially pointed out by Schweizer & Seitzer (1998), the mass of the evolved W3 will still be times larger than the mass of typical galactic GCs, having taken into account the stellar mass losses. Note that a flat IMF all over the mass range, as sometime advocated in the literature (e.g. Mengel et al. 2002) does not help in reducing significantly the total mass of the aged W3. Quantitatively, the decrease in the stellar mass between 300 Myr and 10 Gyr for a flat IMF with exponent 1.5 (in the notation in which the Salpeter’s one is 2.35) is only a factor 1.64 larger than in case of Salpeter or Gould IMF (Maraston 1998).
Dynamical mass-loss, e.g. tidal stripping and evaporation, act in removing mass. However evaporation is not important for such a massive object, and we estimated that it can remove only 1% of mass (see Maraston et al. 2001). Tidal stripping might be more efficient, but as stated in Section 1, its impact is difficult to assess for our object since current N-body simulations (Baumgardt & Makino 2003) refer to clusters in spiral-like gravitational potential for the parent galaxy, while NGC 7252 has a de Vaucouleurs profile (Schweizer 1982). However, according to these simulations, the amount of dynamical mass-loss decreases strongly with an increasing number of particles, therefore it is probably negligible for W3 because of its very large number of stars (cfr. Section 4).

The very large mass and flattened structure of W3 (cf. Table 2) cast some doubt as to its nature as a GC. Indeed, in the Milky Way the maximum value of is for the old metal-rich GCs NGC 6441 and NGC 6388 (Pryor & Meylan 1993). The Magellanic Clouds GCs, many of which have ages/metallicities like W3, have normal luminosities () and, when measured, normal ’s (for the SMC GC NGC 419 Dubath et al. (1997) give ). The young (some tenths of Myr) star clusters of the nearby dwarf galaxy NGC 1569 have dynamical masses , and will evolve in perfectly normal Galactic-type GCs. Instead, the mass of some of the star clusters in the ongoing merger NGC 4038/4039 (“the Antennae”), although being coeval to those of NGC 1569, are at least ten times larger (see Section 1), as well as that of a very young () star cluster in the nearby spiral NGC 6946 (Larsen et al. (2001). Worth noting is also the case of the star clusters in the 3 Gyr old merger remnant NGC 1316 in Fornax. As discussed by Goudfrooij et al. (2001), the luminosity-derived mass of the brightest star cluster, being already 3 Gyr old is still . It would be interesting to verify this number with dynamical measurements.
It seems natural to conclude that the formation of abnormally massive star clusters is very much favoured by extreme environments like galaxy interactions/mergers.
With a mass of W3 is two orders of magnitudes more massive than any other GC with reliable dynamical mass estimates, and its classification does not appear straightforward.
5.2 Clues from the space
In order to put the properties of W3 in context among other types of stellar systems, the most comprehensive way is to consider the fundamental plane of dynamically hot systems (Dressler et al. 1987; Djorgovski et al. 1987) in which the basic structural parameters: effective radius, mean surface brightness inside the effective radius, and central velocity dispersion, are considered simultaneously. Particularly useful is the re-definition of the fundamental plane known as -space (Bender, Burstein & Faber 1992) that combines the three variables mentioned above into more physically meaningful ones. The new variables called , and , are proportional to the mass, the product of and surface brightness (i.e. the compactness of the system) and the , respectively.
The -space is shown in Figure 3, in a fashion similar to Fig. 11 of Burstein et al. (1997). The sequences defined by the stellar systems: B+E (bulges plus ellipticals); dE (dwarf ellipticals); GC (globular clusters) have been drawn from their work. The -coordinates of the compact dwarf elliptical M32 (open circle) are from Bender et al. (1992).
In order to place W3 onto the -space, the central velocity dispersion has been evaluated from its average value determined in this work, by means of the relation (derived from Djorgovski et al. 1997), where it has been assumed that all the light out to fell into the UVES aperture. The arrow indicates the position of W3 when 10 Gyr old. This implies a fading of 3.66 mag in B, according to the evolutionary synthesis models adopted here (Maraston 1998; Maraston et al. 2001).
The most massive star clusters (with dynamical mass measurements) known before W3 are G1 in M31, the most luminous stellar cluster of the Local Group, and Centauri in the Milky Way. As the aged W3 could be more related to these heavy-weight objects than to typical GCs, we have also plotted them into the -space. For G1 a is provided by Meylan et al. (2001), and from their dynamical model we estimate . For Cen (from Pryor & Meylan 1993), and is from van den Bergh et al. (1991). It should be noted that both G1 and Cen have been argued to be the remnant nuclei of stripped galaxies (Meylan et al. 2001; Freeman 1993), because they show a metallicity spread, in other words they both are not simple stellar populations as all other galactic GCs.
The filled triangle in Figure 2 shows the position of the objects named Ultra Compact Dwarf galaxies (UCDGs) detected recently in a deep spectroscopic survey in Fornax (Hilker et al. 1999; Drinkwater et al. 2000). The nature of these objects is currently under debate, and as discussed by Phillipps et al. (2001) they could be either extremely large star clusters or extremely compact small galaxies, perhaps the nuclei of stripped dE (see Drinkwater et al. 2003). This ambiguity pushes to a comparison with our object. To place the UCDGs in the -space we evaluate as average magnitude using objects n. 1,2,4,5 from Table 3 of Karik et al. (2003) that show consistent properties, i.e. we excluded object n. 3 that is significantly brighter. Mean values of and are obtained by averaging the individual values of the 4 objects (M. Hilker, private communications, see also Drinkwater et al. 2003). The spectra of the UCDGs are consistent with old stellar populations (Hilker et al. 1999; Drinkwater et al. 2003), therefore they should be compared to W3 aged to 10 Gyr.
The following conclusions emerge from Figure 3. It is confirmed that W3 lies far from the GC sequence because it is not compact enough given its mass compared to the GC sequence. This remains true when W3 is compared with G1 and Cen. W3 is also far from the position of dwarf ellipticals because it is far more concentrated at a mass matching the least massive dEs. Instead, the aged W3 shows properties that are remarkably similar to those of the mysterious UCDGs. Using the similarity in the opposite direction appears safer, since we presume to know how W3 has been formed, i.e. during the merger event. This suggests that the UCDGs might have formed in similar violent galaxy interactions at high redshift, since they are found to be old. It should be noted however that while these objects are currently found in a galaxy cluster, NGC 7252 is rather isolated. This implies that the cluster environment is not an exclusive one for forming ultracompact massive objects. It would be interesting to search for these type of objects in the vicinity of other relatively isolated elliptical galaxies. Additionally, we note that other gas rich galaxy mergers, like the Antennae, seem not to have produced objects as massive as W3.
Finally, we briefly comment on the relation between W3 and the compact elliptical M32 (empty circle). Similar to W3, M32 has properties that place it in the realm of rare objects (see e.g. Bender, Burstein & Faber 1992), since for its mass is much more compact that the elliptical galaxies defining the sequence in Figure 2. In this context it is worth noting that, contrary to the compact objects of Fornax, M32 is the only close companion of the giant spiral M31. Similarly, in 10 Gyrs W3 will be the only visible close companion of NGC 7252.
It is unfortunate that the most straightforward difference between GCs and dwarf galaxies, i.e. the simple (i.e. single, mono-metallic burst) versus the complex (i.e. extended star formation) nature of their stellar populations is not assessable in case of distant objects, like W3 (and the UCDGs). In any case, we have learned that the galaxy interaction that has originated NGC 7252 roughly 1 Gyr ago was also capable to form a stellar system whose structural properties fall into a domain of rare objects. These objects at a given mass are more compact than dwarf galaxies, and at given compactness are more massive than GCs, and start populating a previously empty region of the fundamental plane.
It would be valuable to explore under which conditions current simulations of NGC 7252-type mergers (e.g. Mihos & Hernquist 1996) can produce W3-like objects.
Acknowledgements.
CM and RPS thank Ralf Bender and Andi Burkert for very stimulating discussions. We are also grateful to Søren Larsen for having provided us with the most recent version of his code, and to him, Daniel Thomas, Ulrich Hopp and Bo Milvang-Jensen for useful comments. CM was supported at early stages of this work by the Deutsche Forschungsgemeinschaft, SFB375. FS gratefully acknowledges partial support from the National Science Foundation through grant AST-0205994.References
- (1) Baumgardt, H., Makino, J., MNRAS, 2003, 340, 227
- (2) Bender, R. 1990, A&A, 229, 441
- (3) Bender, R., Saglia, R.P., Gerhard, O. 1994, MNRAS, 269, 785
- (4) Bender, R., Burstein, D., Faber, S.M. 1992, ApJ, 399, 462
- (5) Burstein, D., Bender, R., Faber, S.M., Nolthenius, R. 1997, AJ, 114, 1365
- (6) Dressler, A., Lynden-Bell D., Burstein, D., et al. 1987, ApJ, 313, 42
- (7) Djorgovski, S., Davis, M. 1987, ApJ, 313, 59
- (8) Djorgovski, S., Gal, R.R., McCarthy, J.K., et al. 1997, ApJL, 474, 19
- (9) Drinkwater, M.J., et al., 2000, PASA 17, 227
- (10) Drinkwater, M.J., et al., 2003, Nature, 423, 519
- (11) Dubath et al. 1997, A&A, 324, 505
- (12) Freeman , K.C. in Galactic Bulges, 1993, IAU symposium vol. 153, p. 263
- (13) Gerhard, O., Jeske, G., Saglia, R. P., Bender, R. 1998, MNRAS, 295, 197
- (14) Goudfrooij, P., Alonso, M. V., Maraston, C., Minniti, D. 2001 MNRAS, 328, 237
- (15) Gould, A., Bahcall, N. J., Flynn, C. 1997, ApJ, 482, 913
- (16) Harris, W.E. 1991, ARA&A, 29, 543
- (17) Hilker, M. et al. 1999, A&AS 174, 75
- (18) Ho, L., Filippenko, A. 1996, ApJ, 472, 600
- (19) Holtzmann, J.A., Faber, S.M., & Shaya, E.J. 1992, AJ, 103, 691
- (20) Karick, A.M., Drinkwater, M.J., Gregg, M.D. 2003, MNRAS, in press, astro-ph/0301463
- (21) King, I.R. 1966, AJ, 61, 74
- (22) Kissler-Patig, M. 2000, RvMA, Vol.13, pag. 13
- (23) Larsen, S.S. 1999, A&AS, 139, 393
- (24) Larsen, S.S., Brodie, J.P., Elmegreen, et al. 2001, ApJ, 556, 801
- (25) Maraston, C. 1998, MNRAS, 300, 872
- (26) Maraston, C., Kissler-Patig, M., Brodie, J., et al. 2001, A&A, 370, 176
- (27) Mengel, S., Lehnert, M. D., Thatte, N., Genzel, R. 2002, ApJ, 550, 280
- (28) Meylan, G., Mayor, M. 1986, A&A, 166, 122
- (29) Meylan, G., Sarajedini, A., Jablonka, P., et al. 2001, ApJ, 122, 830
- (30) Mihos, J.C., & Hernquist, 1996, ApJ, 464, 641
- (31) Miller, B.W., Whitmore, B.C., Schweizer, F., Fall, S.M. 1997, AJ, 114, 2381
- (32) Phillipps, S., Drinkwater, M.J., Gregg, M.D., Jones, J.B. 2001, ApJ, 560, 201
- (33) Pryor, C., Meylan, G., in Structure and dynamics of globular clusters, 1993, ASP conference series, vol. 50, p. 357
- (34) Schweizer, F. 1982, ApJ, 252, 452
- (35) Schweizer, F. 1987, in “Nearly normal galaxies”, ed. S.M. Faber, Ney York:Springer, p. 18
- (36) Schweizer, F. 1998, in “Galaxies: Interactions and Induced Star Formation”, Saas-Fee Advanced Course 26. Lecture Notes 1996. Swiss Society for Astrophysics and Astronomy, XIV, 404 pp., 214 figs. Springer-Verlag Berlin/Heidelberg; ISBN, p. 105
- (37) Schweizer, F., Seitzer, P. 1998, AJ, 116, 2206
- (38) Spitzer, L. Jr.. 1987, Dynamical Evolution of Globular Clusters (Princeton: Princeton Univ. Press
- (39) Van den Bergh, S., Morbey, C., Pazder, J. 1991, 375, 594
- (40) Whitmore, B., Zhang, et al. 1999,
- (41) Zhang, Q., Fall, S.M. 1999, ApJ, 527, L81