HE 01075240, A Chemically Ancient Star.
I. A Detailed Abundance Analysis11affiliation: Based on observations collected at the European Southern
Observatory, Paranal, Chile (Proposal Number 268.D-5745).
Abstract
We report a detailed abundance analysis for HE 01075240, a halo giant with . This star was discovered in the course of follow-up medium-resolution spectroscopy of extremely metal-poor candidates selected from the digitized Hamburg/ESO objective-prism survey. On the basis of high-resolution VLT/UVES spectra, we derive abundances for 8 elements (C, N, Na, Mg, Ca, Ti, Fe, and Ni), and upper limits for another 12 elements. A plane-parallel LTE model atmosphere has been specifically tailored for the chemical composition of HE 01075240. Scenarios for the origin of the abundance pattern observed in the star are discussed. We argue that HE 01075240 is most likely not a post-AGB star, and that the extremely low abundances of the iron-peak, and other elements, are not due to selective dust depletion. The abundance pattern of HE 01075240 can be explained by pre-enrichment from a zero-metallicity type-II supernova of – M⊙, plus either self-enrichment with C and N, or production of these elements in the AGB phase of a formerly more massive companion, which is now a white dwarf. However, significant radial velocity variations have not been detected within the 52 days covered by our moderate- and high-resolution spectra. Alternatively, the abundance pattern can be explained by enrichment of the gas cloud from which HE 01075240 formed by a first-generation star exploding as a subluminous SN II, as proposed by Umeda & Nomoto (2003). We discuss consequences of the existence of HE 01075240 for low-mass star formation in extremely metal-poor environments, and for currently ongoing and future searches for the most metal-poor stars in the Galaxy.
1 INTRODUCTION
It has become clear, in recent years, that in order to understand the history of galaxy formation, and indeed, the early evolution of the universe as a whole, it is necessary to understand the nature of star formation at the earliest epochs. A number of recent studies have suggested that the very first stars that formed may have been quite massive objects, several hundred to perhaps one thousand solar masses (Bromm et al., 2001; Schneider et al., 2002), while others have suggested that the First Mass Function (FMF) may have included stars with masses as low as roughly the solar mass (Yoshii & Saio, 1986; Nakamura & Umemura, 2001). The most massive stars would have disappeared after some tens of million years, and in this process may have contributed the first heavy element production in the early universe. The less massive stars, especially if these included stars of sufficiently low mass that their main-sequence lifetimes exceed a Hubble time, should still be observable at present. If they were indeed present at the earliest times, these stars should, to a large extent, have preserved in their atmospheres the fossil record of the element production of the most massive stars that were their immediate precursors.
The fundamental role that early-formed, low-mass stars play as the “scribes” of stellar generations from long ago has inspired a number of systematic searches for their presence in the Galaxy today. The HK survey of Beers, Preston and Shectman (Beers et al., 1992; Beers, 1999) was the first survey to detect significant numbers of extremely metal-poor (EMP) stars, those which, for the purpose of this paper, we define to be stars of metallicity111We use the common notation , and analogously for [X/Fe]. Abundances are on a scale where , i.e., . . However, even this effort, spanning some two decades, has to date only identified about 100 stars of such extremely low metallicity. The ESO Large Programme on “Galaxy Formation, Early Nucleosynthesis, and the First Stars” of Cayrel et al. (Cayrel et al., 2001; Hill et al., 2002; Depagne et al., 2002; Cayrel et al., 2003; Francois et al., 2003) has obtained high-resolution, high signal-to-noise ratio () spectra of many of the HK survey stars with . However, it is clear that even after this sample of stars has been analysed, there will remain many open questions, and that new questions will arise.
In order to increase the number of known EMP stars suitable as targets for high-resolution, high spectroscopy with currently existing telescopes, the data base of digital spectra of the Hamburg/ESO objective-prism survey (HES; Wisotzki et al., 2000) is currently being exploited by means of quantitative selection criteria (Christlieb et al., 2001c, a, b, 2002b; Christlieb, 2003). Medium-resolution ( Å) spectroscopic follow-up observations of the candidate metal-poor stars identified to date (main-sequence turnoff stars and subgiants as well as giants) are being obtained with 1.5m–6.5 m telescopes at AAO, CTIO, ESO, KPNO, LCO, Palomar Observatory and SSO. To date, follow-up spectra of HES metal-poor candidates have been obtained, and stars with have been identified (Christlieb, 2003), which triples the number of known EMP stars, from the found in the HK survey, to a total of stars. Results from high-resolution spectroscopy of HES EMP stars obtained with VLT-UT2/UVES and Keck/HIRES have been reported in Depagne et al. (2000), Cohen et al. (2002), Carretta et al. (2002), Lucatello et al. (2003), and Cohen et al. (2003).
The lowest metallicity stars in the HK survey reach to , equal to, but not lower than, the metallicity of the lowest metallicity star known prior to the HK survey, CD (Bessell & Norris, 1984). Hence, it was widely assumed that a physical low-metallicity limit for Galactic halo stars was reached at around . However, in a previous paper (Christlieb et al., 2002a, hereafter Paper I), we reported the discovery of HE 01075240, which is a factor of 20 times lower in [Fe/H] than CD . In this paper, we describe the derivation of the stellar parameters for HE 01075240, and the abundance analysis in more detail (§3 and §4, respectively). In §5.1 we present possible scenarios for the origin of the abundance pattern observed in HE 01075240. We conclude our paper with a discussion of some consequences of these scenarios, and consider the impact of the existence of HE 01075240 on theories of low-mass star formation in the early Universe.
2 OBSERVATIONS
2.1 Spectroscopy
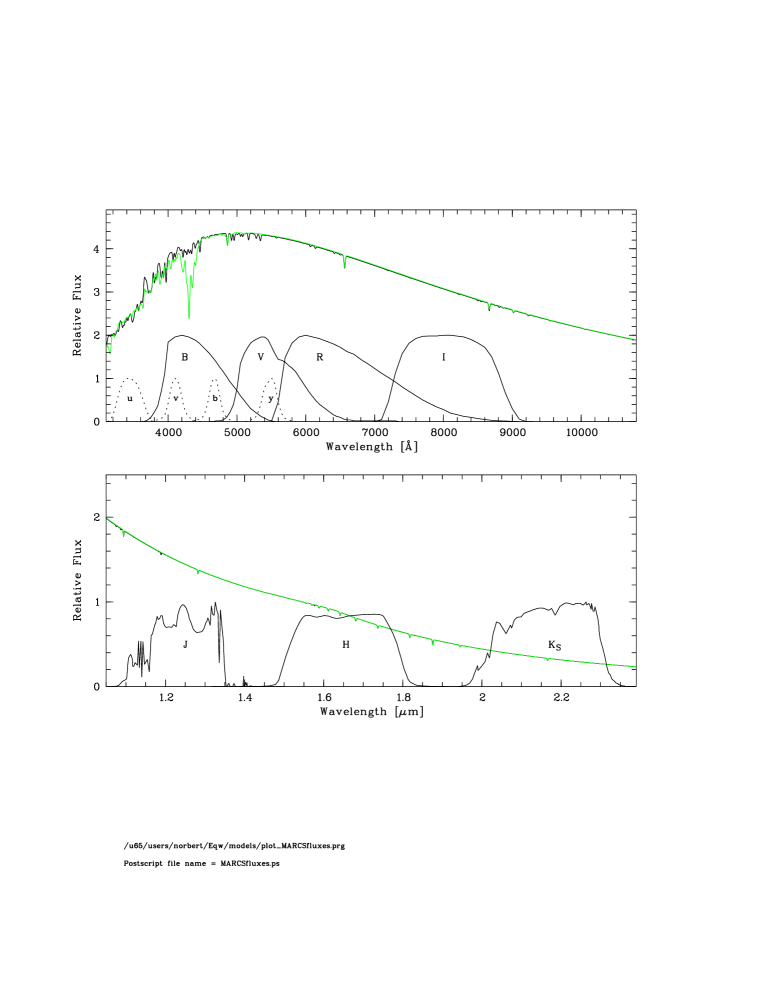
HE 01075240 was observed during the nights of 19 and 20 December 2001 at the European Southern Observatory (ESO), Paranal, Chile, with the Ultraviolet-Visual Echélle Spectrograph (UVES; Dekker et al., 2000) mounted on the 8 m Unit Telescope 2 (Kueyen) of the Very Large Telescope (VLT). The observations are summarized in Table 1, and selected sections of the spectra are shown in Figure 1.
A dichroic beam splitter (Dichroic #1) was used to distribute the light collected with the telescope to the blue and red arms of UVES. The BLUE 390 and RED 580 settings were used, yielding a wavelength coverage of 3290–4519 Å and 4781–6807 Å, respectively, with a gap in the range 5756–5834 Å. In order to reach a resolving power of , the slit was set to a width of . The CCD binning was pixels, i.e., the projected pixel sizes were (blue arm) and (red arm). The total exposure time for HE 01075240 was 13,800 sec, which was split into 5 exposures in order to facilitate removal of cosmic ray hits.
The previously most metal-poor giant star known, CD (Bessell & Norris, 1984), having (Ryan et al., 1996), was observed with the same setup, on the night of 20 December 2001. The exposure time was 900 sec.
Throughout most of our analysis we used the pipeline-reduced UVES spectra as provided by the ESO Data Management & Operations Division (DMD), except for wavelength regions that turned out to be very critical for the analysis. In these cases, the data were re-reduced with the REDUCE package of Piskunov & Valenti (2002). REDUCE has been demonstrated by the authors to be more reliable in the rejection of bad pixels than the UVES pipeline.
The differences in geocentric radial velocity between the individual exposures was found to be negligible (i.e., 1/3 pixel in the blue-arm spectra and 1/2 pixel in the red-arm spectra), and the reduced spectra were therefore co-added without applying any radial velocity corrections. After that, the spectra were rebinned by a factor of 2. The resulting spectra have an average signal-to-noise ratio () per pixel of 54 (blue arm), 127 (red arm, lower CCD) and 143 (red arm, upper CCD). The of the blue-arm spectra reaches a maximum of at Å, and drops to at 3290 Å. The in the lower red-arm spectrum continuously increases from to over the covered wavelength range; in the upper red-arm spectrum it is almost constant at . The quality of the spectra of CD are almost identical, apart from the presence of a fringing pattern with an amplitude of % in the red spectra which is not present in the spectra of HE 01075240.
For abundance analyses of EMP stars, the quality of the spectra used is very critical, since their spectral lines are very weak. Norris et al. (2001, hereafter NRB01) give the formula
| (1) |
for the uncertainty in the measurement of the equivalent width of a spectral line at wavelength covered by pixels of a spectrum with resolving power . They define a figure of merit, , that is inversely proportional to , i.e,
| (2) |
where is given in Å, in order to compare the quality of the data used by different authors for the analysis of metal-poor stars.
With the five stars analysed by NRB01, these authors heralded the era of abundance analysis of EMP stars based on very high-quality () spectra. They were followed recently by Cohen et al. (2002) and Carretta et al. (2002), who analysed a sample of six EMP stars (and seven additional stars with ) using Keck/HIRES spectra with . The Cayrel et al. (2003) observations of EMP star from the HK survey, obtained with UVES, achieved figures of merit in their blue spectra, and in their red spectra. Our co-added and rebinned UVES spectra have (blue arm), (red arm, lower part) and (red arm, upper part), which, according to Equation (1), enables us to detect spectral lines as weak as mÅ at a significance level or higher in both of the red-arm spectra, and lines with mÅ in the blue-arm spectrum at Å.
In addition to the UVES spectra of HE 01075240, three moderate-resolution spectra are available, obtained with the Double Beam Spectrograph (DBS) at the Siding Spring Observatory (SSO) 2.3 m telescope by one of us (M.S.B.). These observations were made during the nights of 11 November and 12 December 2001, and 3 January 2002. The discovery spectrum of November covered –Å at a resolution of 2.2 Å; the later spectra covered – Å at 1.1 Å resolution.
Our medium- and high-resolution spectra together cover a period of 52 days. This set of spectra does not reveal any indication of radial velocity variations (see Figure 2). All measurements are consistent with a constant barycentric radial velocity of km s-1 (with km s-1 referring to the scatter of the measured values), which is the weighted average of all 5 measurements we have thus far.
2.2 Photometry
Accurate broad- and medium-band photometry has been obtained for HE 01075240 during the course of several observing campaigns. The results are summarized in Table 2.
T.C.B. measured Johnson-Cousins magnitudes for HE 01075240 in December 2001 with the ESO-Danish 1.54 m telescope and the DFOSC instrument. Strömgren and Johnson photometry was obtained during the night of 29 December 2001 at the Las Campanas 1 m telescope with the Direct CCD Camera. The observer was M. Dehn.
photometry was obtained during the night of 22 December 2001 at SSO with the 2.3 m telescope and the CASPIR instrument by P. Wood. The measurements were converted to the Johnson-Glass system (Bessell & Brett, 1988). An independent set of measurements comes from the Two Micron All Sky Survey2222MASS is a joint project of the University of Massachusetts and the Infrared Processing and Analysis Center/California Institute of Technology, funded by the National Aeronautics and Space Administration and the U.S. National Science Foundation. (2MASS; Skrutskie et al., 1997). The 2MASS values were also transformed to the Johnson-Glass system, using the transformations listed in Carpenter (2001). The transformed 2MASS values agree very well with the SSO values, to within 0.02–0.03 mag, suggesting that there are no systematic offsets present after the transformations were applied. The two sets of measurements were therefore averaged to the values listed in the last row of Table 2.
The uncertainties of the above mentioned measurements are typically – mag, with the exception of the Strömgren photometry. The magnitude has an accuracy of mag. It is planned to obtain a more accurate measurement in a future observing run.
3 STELLAR PARAMETERS
The adopted stellar parameters are summarized in Table 4. In this section we describe in detail how they have been derived.
3.1 Effective Temperature
The effective temperature () of HE 01075240 was independently derived by two of us (A.J.K. and P.S.B.) by profile analysis of H (see Figure 3), yielding K and K, respectively. The techniques used differ, most importantly, in (a) the methods used for continuum rectification, (b) the fitting method, (c) the broadening theory employed – computations of Stark-broadening by (Vidal et al., 1973, hereafter VCS) and self-broadening by Ali & Griem (1966) versus Stehlé & Hutcheon (1999) and Barklem et al. (2000) – , and (d) the model atmospheres that were used, i.e., a MAFAGS model (Gehren, 1975a, b), and a MARCS model, respectively. In both cases, was assumed, based on the results from section 3.3. The effective temperatures derived by A.J.K. and P.S.B. for CD are K and K, respectively, assuming (NRB01). As already mentioned, the red spectra of CD suffer from fringing, therefore more accurate determinations were not possible.
We also derived effective temperatures for HE 01075240 from broad- and intermediate-band photometry. We adopt a reddening of , which was deduced from the maps of Schlegel et al. (1998). We note that the maps of Burstein & Heiles (1982) yield . We employed the color-temperature relations of Houdashelt et al. (2000), as well as the empirical relations of Alonso et al. (1999, 2001), to convert our de-reddened broad-band visual and infrared colors to estimates of effective temperatures. For the Strömgren photometry, we used the calibrations of Clem (1998). The results are summarized in Table HE 01075240, A Chemically Ancient Star. I. A Detailed Abundance Analysis11affiliation: Based on observations collected at the European Southern Observatory, Paranal, Chile (Proposal Number 268.D-5745)., together with our results from the H profile analysis.
We note that the and colors we observe for HE 01075240 are unusually blue compared to the observed loci of giant stars and to the theoretical colors of Houdashelt et al. (2000). Since the lowest metallicity models included in the latter have , the computations might actually not be applicable to a star as low in metallicity as HE 01075240. A change in the observed magnitude in HE 01075240 by between and magnitudes is required to make the , and consistent with the and colors and with the temperature derived from H. This effect is not seen in CD (and also not in other extremely metal-poor stars with measurements we are aware of). It will be discussed in more detail in a future paper.
Since the magnitude of HE 01075240 is affected by its strong C overabundance, and the wavelength range covered by the band appears to suffer from a flux deficiency, we neglect the effective temperatures derived from and colors in the determination of the . We adopt the scale of Alonso et al. (1999, 2001) for our analysis, i.e., K, as derived from . We emphasize that the chosen possibly suffers from systematic errors on the order of K. For the reader’s convenience we provide in the third column of Table 8 the changes of the abundances of all elements we analyse in HE 01075240 resulting from a change in effective temperature of K.
3.2 Iron Abundance and Microturbulence
A microturbulent velocity of km s-1 was determined for HE 01075240 by forcing the abundances of the 25 Fe I lines we detect to have no trend with line strength (see Figure 5). Since the number of lines we used is relatively small, and the line-to-line abundance scatter is considerable (the standard deviation of the sample is dex), the accuracy of our determination of is limited. From the change of the slope of the abundance trend with when changing , we estimate that the accuracy of its determination is km s-1. The average abundance we measure is dex, yielding , if a solar iron abundance of dex is adopted (Asplund et al., 2000a).
We also carried out a differential analysis to CD . From Table HE 01075240, A Chemically Ancient Star. I. A Detailed Abundance Analysis11affiliation: Based on observations collected at the European Southern Observatory, Paranal, Chile (Proposal Number 268.D-5745). one can see that the colors that are useful for HE 01075240 (i.e., neglecting and ) consistently yield that CD is K cooler than HE 01075240. The Balmer line-profile analyses yield K higher temperature differences, on the order of K, which is in agreement with K to within the measurement uncertainties. We hence adopt K for the differential analysis. Using this temperature, we determine and km s-1 for CD . The differential analysis of the Fe I abundance indicates that HE 01075240 is dex more iron-poor than CD , which is in good agreement with our LTE value for the iron abundance of HE 01075240.
We noted the presence of a trend of with (see Figure 5). Such a trend is commonly observed in extremely metal-poor giants (see e.g. NRB01; Carretta et al., 2002), and the reason for it is unclear. An investigation of this effect is beyond the scope of this paper. We just note that it was not possible to remove the trend by changing . Changing the effective temperature has an influence on the trend, but K would have to be adopted for HE 01075240 in order to fully remove the trend, which is inconsistent with derived from either Balmer line wings or broad-band photometry (see Table HE 01075240, A Chemically Ancient Star. I. A Detailed Abundance Analysis11affiliation: Based on observations collected at the European Southern Observatory, Paranal, Chile (Proposal Number 268.D-5745).).
Since there are no Fe II lines visible in our spectrum of HE 01075240, we have to rely on Fe I lines to derive [Fe/H]. Fe I (and also Ca I) has been suspected to show significant departures from LTE for a long time (Athay & Lites, 1972; Steenbock, 1985). However, recent calculations (Gratton et al., 1999; Thévenin & Idiart, 1999) disagree on the validity of LTE for Fe I in metal-poor stars. This discrepancy can be traced back to the input physics the two groups employ: the different degree of model atom completeness, different approximations for photoionization coupled with the treatment of UV fluxes, and the inclusion/neglect of inelastic collisions with hydrogen atoms.
In a recent series of papers (Gehren et al., 2001a, b; Korn et al., 2003), a non-LTE model for Fe I/II was presented which addresses all the issues mentioned above. The model atom was compiled from the recent literature (Nave et al., 1994) and thus reflects the current state of knowledge of the iron term system. Photoionization is treated by implementing the quantum-mechanical computations of Bautista (1997), giving cross-sections which are systematically larger than those of previously assumed simple approximations, typically by factors of 100. Line blocking is considered from both continuous and discrete opacity sources, which allows for a realistic treatment of the UV fluxes as a function of metallicity. The efficiency of hydrogen collisions is carefully calibrated using metal-poor stars whose gravities can be inferred from Hipparcos astrometry (Korn et al., 2003). Non-LTE effects for Fe I turn out to be intermediate between the ones advocated by the two groups mentioned above, and amount to dex in the case of HE 01075240. We therefore adopt for our best estimate of the iron abundance of HE 01075240.
3.3 Surface Gravity
We use a variety of methods and their combinations to constrain the gravity of HE 01075240, including ionization equilibria, relative strengths of Balmer line wings, and by employing evolutionary tracks. It is a challenging task to derive spectroscopic gravities for metal-poor stars, even at less extreme metal deficiencies than that of HE 01075240, because at , individual spectral features in the optical regime (like Mg I Å, Ca I Å or Fe I Å) cease to be strong enough to show a dependence on gravity via pressure broadening (see Fuhrmann, 1998).
An independent estimate of the gravity can be derived on the basis of the ionization equilibrium of e.g. Fe I/II. However, as already mentioned, no Fe II lines are detected in our UVES spectra of HE 01075240, hence only a lower limit to the gravity can be derived from these features. Non-LTE corrections for the Fe I abundance have been taken into account when deriving these lower limits. From the non-detection of Fe II 5169 Å and 5018 Å (both multiplet 42), this limit is determined to be , if a detection limit according to Equation (1) is used, and in case of a limit. A stronger constraint follows from a pixel-by-pixel comparison of model spectra with the observed spectrum in the wavelength regions occupied by the two Fe II lines (see Figure 6). Gravities below 2.0 dex are excluded, considering that the synthesized Fe II lines for this gravity are outside of the range of all 6 pixels of the observed spectrum covering both of these lines. However, confirmation of this result by higher spectra is needed. The situation could also be remedied by analysing additional Fe II lines around 3250 Å, which are significantly stronger than any of the lines at longer wavelength.
Main-sequence gravities can be excluded for HE 01075240 by further constraints obtained from the Balmer line-profile analysis. Although the wings of H are mainly sensitive to effective temperature, there is also a slight gravity dependence. Inspection of a 12 Gyr, isochrone (Yi et al., 2001) suggests that a star of K in a pre-helium core flash evolutionary state either has (i.e., if it is on the red giant branch) or (i.e., if it is on the main sequence). Assuming the latter in a profile analysis of H, and all other input as in §3.1 for the analysis of P.S.B., yields K. Such a low temperature is inconsistent with broad-band photometry (see Table HE 01075240, A Chemically Ancient Star. I. A Detailed Abundance Analysis11affiliation: Based on observations collected at the European Southern Observatory, Paranal, Chile (Proposal Number 268.D-5745).).
We can also rule out dwarf-like gravities by applying the constraint that effective temperatures derived from different Balmer lines should be in agreement. For cool stars like HE 01075240, the sensitivity of the higher Balmer line wing depths to gravity is in the opposite sense to that found for lower lines in the series, such as H. This is due to the fact that self-broadening is more important than Stark broadening for the lowest lines in the series, while Stark broadening completely dominates for higher members of the series. For a purely self-broadened H line, the line opacity in the wings is proportional to the number density of H-atoms, and this can be shown to lead to a sensitivity such that line strength increases with gravity. For a purely Stark broadened line, while the wing opacity due to static perturbers scales with electron density, the wing opacity due to electrons in the impact regime does not, and this can be shown to lead to line strength decreasing with increasing gravity. The sensitivity of the line strength to gravity is in fact reasonably strong for approximately . Using this behavior, simultaneous fitting of H and one or more of the higher Balmer lines (we found H and H10 to be most useful in HE 01075240), can constrain and . and is completely inconsistent with the observed H and H10 spectra, yielding synthetic profiles that are much too weak, while the profiles obtained from the combination of parameters and are consistent with the observations (see Figure 7).
Finally, although we note that our measured value of the gravity sensitive index yields a dwarf-like gravity, when we employ the Strömgren color calibrations of Clem (1998), this index is disturbed by the strong CH lines that are present in the wavelength ranges covered by the and filters (see Figure 4). In particular, the flux in the filter is suppressed by the G band of CH, which leads to higher values for the magnitude, and since , a low color index results, yielding a high gravity. Hence a calibration of that takes into account the peculiar abundance pattern of HE 01075240 needs to be established before any measurements are useful for gravity determination. Such calibration efforts are in progress.
We have combined our constraints from the above mentioned indicators (with the exception of ) with pre-helium flash stellar evolutionary tracks. This yields , with the uncertainty arising mainly from the uncertainty in , and we shall adopt this value for the present analysis.
4 ABUNDANCE ANALYSIS
4.1 Solar Abundances
For the computation of elemental abundances relative to the Sun, as listed in Table 7 below, we mostly adopted the solar abundances of Grevesse & Sauval (1998, hereafter GS98), with a few exceptions described in the following.
Holweger (2001, henceforth H01) lists improved solar abundances of C, N, O, Ne, Mg, Si, and Fe, derived by taking into account non-LTE effects and granulation. The latter is realized by a 2D approach; for the vertical temperature structure, the solar model of Holweger & Müller (1974) is employed. Of the H01 solar abundances relevant for our analysis, we adopt those of N and Mg, which differ by the values listed in GS98 by and dex, respectively, in the sense H01GS98.
For C, Si, and Fe, solar abundances derived by 3D hydrodynamical simulations are available. Comparison with observations have shown that the simulations of Asplund et al. appear to be realistic, in that they reproduce the shapes, shifts, and asymmetries of solar Fe lines very well (Asplund et al., 2000b). Asplund et al. (2000a) derive and by means of such simulations, and we adopt their Fe II value. Note that this value agrees very well with the meteoritic iron abundance, if a downward correction of the solar photospheric Si abundance of dex with respect to GS98 is taken into account (Asplund, 2000). We also adopt the solar Si abundance of Asplund, i.e., . Finally, again using 3D models, Allende Prieto et al. (2002) obtain from the C I 8727 Å line, for which they show non-LTE effects to be negligible. We adopt this value, which is dex lower than the value of GS98, and dex lower than the value of H01.
4.2 Line Identification
Since numerous lines of CH are present in the spectrum of HE 01075240, line identification is not as easy as for other extremely metal-poor stars. We started the identification process with line lists used in recent high-resolution studies of extremely metal-poor stars (McWilliam et al., 1995; Norris et al., 1996, 2001; Depagne et al., 2000; Carretta et al., 2002), complemented by Bessell & Norris (1984), and the solar atlas (Moore et al., 1966). Additional identifications were made using the Vienna Atomic Line Database333http://www.astro.uu.se/vald/ (VALD; Kupka et al., 1999, 2000).
Apart from checking the consistency of the abundances of a given element derived from different lines, we carried out careful checks for all species for which we detected only a few, or even only single lines. The result is that, apart from hydrogen lines, and numerous molecular lines of CH, CN and C2, we identified 41 lines of 6 elements (Na, Mg, Ca, Ti, Fe, and Ni), and determined upper limits for lines of 12 additional elements. The results are summarized in Table 5.
4.3 Measurement of Equivalent Widths
Equivalent widths were measured from the rebinned UVES spectra with a semi-automatic procedure. In a 4 Å wide region centered on the line to be measured, a simultaneous fit of a straight line continuum and a Gaussian is performed. While the use of a Gaussian leads to systematic underestimation of the equivalent widths of strong lines due to the presence of damping wings, which cannot adequately be reproduced by a Gaussian profile, this is not an issue in case of HE 01075240, since the strongest line we measured with this method has mÅ. The equivalent width measurements and upper limits for HE 01075240 we measured are summarized in Table 5.
4.4 The Model Atmospheres
The model atmospheres used in the analysis were calculated using the present version of the MARCS program. This program has been developed through a number of different versions (Gustafsson et al., 1975; Plez et al., 1992; Edvardsson et al., 1993; Jørgensen et al., 1992; Asplund et al., 1997). A more detailed description is presently being prepared by Gustafsson et al. The MARCS program calculates predicted model atmospheres for late-type stars. It is based on the assumptions of stratification in plane-parallel or spherically-symmetric layers, hydrostatic equilibrium, mixing-length convection, and LTE. The continuous and line absorption from atoms and molecules is considered in full detail by opacity sampling with to wavelength points.
The parameters of the model used in the final iteration of the present analysis are given in Table 4, with the exception of [Fe/H], for which we use for consistency reasons. The model takes into account the strong overabundances of C and N in HE 01075240, i.e., dex and dex, as determined in a close-to-final iteration, were used. An enhancement of -elements, including O, by dex was assumed, and the MLT parameters and were set to and , respectively.
The model structure is given in Table 6 and compared with a set of more metal-rich models ([A/H] denoting the over-all metal abundance) with the same and in Figure 8. It is seen that the pressures at a given temperature and optical depth increase as the metallicity decreases, as expected. Note that the models approach an asymptotic structure when [A/H] approaches . The reason for this is that line-blanketing effects vanish as the metallicity decreases. The only significant opacities in the most metal-poor models are the H- absorption, Rayleigh-scattering, absorption by H I, and the H absorption in the blue and near ultraviolet, where it amounts to % of the H- absorption. In the line-forming regions (around ), H I scattering becomes stronger than the H- absorption shortwards of about 5 000 Å; at longer wavelengths and at greater depths, H- dominates until H I absorption takes over below . (In the far UV, H I absorption is also important, as is C I absorption, but at the low effective temperature of HE 01075240, this has only minor consequences for the structure of the model.) The line blanketing effects, mainly due to H I and CH absorption, are small.
One might suspect that metals could be of significance as electron donors, but this is not so, since throughout the model hydrogen is the totally dominant electron donor, contributing more than 99 % of the electrons. In fact, we find from the sequence of models displayed in Figure 8 that the metals do not provide electrons comparable to the contribution from hydrogen in the line-forming regions for . Similarly, only for does the H- opacity become more important than H I scattering in the blue and violet for the line-forming regions.
The gas pressure is entirely dominated by the contributions from atomic hydrogen and helium. At the surface gravity adopted for HE 01075240, H2 molecules contribute less than % of the total pressure. Among other molecules, CH is the most important pressure contributor for the chemical composition chosen. Note that CO is less significant, in spite of the low temperature of the gas, which for more metal-rich gas would mean that a great fraction of available oxygen would form CO molecules, as a result of the high dissociation energy of this molecule. This is not the case at these low metallicities, where most of the oxygen, and also most of the carbon, is still in atomic form. The relatively small number of CO molecules reflects the fact that the partial pressure of CO is proportional to the product of the partial pressures of C and O atoms, respectively.
The model atmosphere adopted for HE 01075240 is unstable against convection for , and convection carries more than 50 % of the total flux for , according to mixing-length theory (Böhm-Vitense, 1958). The fact that convection reaches visible layers is basically due to the transparency of the metal-poor gas; a consequence of the absence of metals as electron donors, which leads to less H- formation at a given pressure and temperature than in corresponding more metal-rich models. The fact that the model is convectively unstable in visible layers makes the present analysis uncertain; mixing-length theory is known to be inadequate even for describing a mean structure of the atmosphere. This will be discussed further below.
4.5 Elemental Abundances of HE 01075240
The elemental abundances we derive for HE 01075240 are summarized in Table 7, and are shown in comparison with abundances of other metal-poor stars in Figures 9 and 10. In this section we comment on elements that required special attention in the analysis.
4.5.1 Carbon
We performed a spectrum synthesis of the C Swan band at Å (see Figure 11), and moderately-strong lines of the CH A-X system in the wavelength regions – Å, – Å, and – Å. The best fits were determined by minimizing between the synthesized and observed spectra. In the case of CH, wavelength regions containing lines that are missing in our CH line list were excluded from the fit. The spectrum synthesis yielded C abundances discrepant by 0.3 dex between both indicators, i.e., dex from C2, and dex from CH.
Such a discrepancy has been found before in extremely metal-poor, carbon-enhanced giants by many previous authors. For example, Hill et al. (2000) found a discrepancy of dex for CS 22948-027 and CS 29497-034, when they used moderately strong CH lines at Å. They obtained a discrepancy of dex when they used the strong lines of the G band at Å. Bonifacio et al. (1998) have seen the same effect in CS 22957-027.
Due to the different sensitivity of C2 and CH to temperature and gravity (see Table 8) the discrepancy in HE 01075240 could be removed if K or dex were assumed. However, both values are clearly excluded (see §3), and furthermore, the fact that such a discrepancy has been observed in other extremely metal-poor stars as well suggests that the reason is not due to peculiarities in HE 01075240, but among common systematic errors of the abundance analysis methods used, e.g., inadequate temperature structures of 1D models. In fact, as discussed in §4.6.4 below, 3D hydrodynamical simulations yield much lower temperatures in the outer layers of the atmosphere than 1D models. Hence, it is expected that molecular lines in particular may be affected. Preliminary calculations of Asplund (2003, private communication) indeed suggest that the 3D corrections for C2 are on the order of 0.2–0.4 dex larger than those for CH, at least for metal-poor dwarfs similar to the Sun. Although these 3D calculations are not tailored for HE 01075240, one would expect qualitatively similar behavior in giants and dwarfs, which could therefore possibly bring the C abundances derived from both indicators into better agreement in HE 01075240.
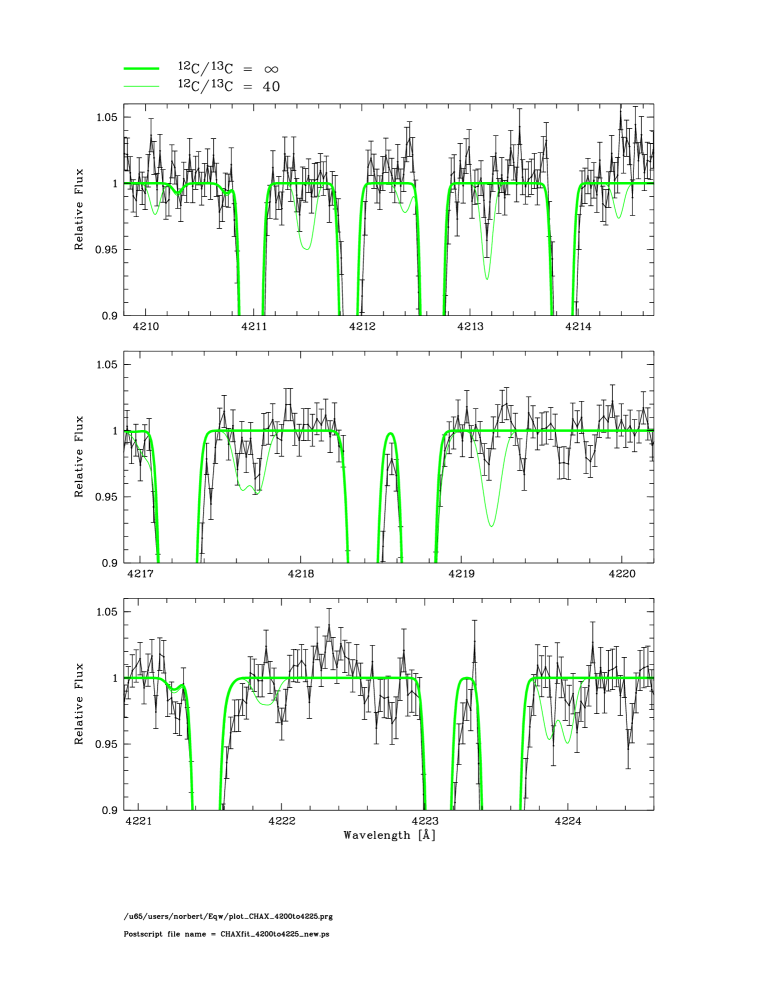
From spectrum synthesis of in the three wavelength regions mentioned above we determine the carbon isotopic ratio . The 12CH and 13CH line lists were supplied by Jørgensen (see Jørgensen et al., 1996). A comparison with laboratory wavelengths, as well as with the analysis of Krupp (1973, 1974) and a related line list of R.A. Bell (private communication), and the recent measurements and anlysis of the 12CH and 13CH A-X system by Zachwieja (1995), showed that the wavelengths of the 12CH lines of the A-X system agreed fairly well, while the 13CH lines were misplaced by typically Å in the 4200 Å region. We therefore adopted the wavelengths of the 13CH lines of Bell’s lists, but note that there are individual departures between those and Zachwieja’s tables of – Å.
We have probably detected a feature at Å, and a few other features, e.g. at Å, Å, and Å also seem to be present (see Figure 12). This detection is not definitive, however, in view of the fact that the wavelengths still must be regarded as uncertain, on the basis of the comparison between different line lists. If these detections are real, would result, a value with considerable uncertainty also due to the uncertainty in the continuum placement. However, we can rule out . Higher quality spectra are needed to clarify the situation.
4.5.2 Nitrogen
The nitrogen abundance of HE 01075240 was derived by spectrum synthesis of the violet CN system with the band head at 3883 Å (see Figure 13). The nitrogen abundance as measured from CN depends linearly on the assumed C abundance. Since it was not possible to derive a unique abundance of C, we used the two different C abundances obtained from C2 and CH, dex and dex, respectively, in the spectrum synthesis of CN.
4.5.3 Calcium
In order to determine the Ca abundance of HE 01075240 we performed a spectrum synthesis of the Ca II K line. It is very strong and shows damping wings, and would therefore not be treated adequately with our equivalent width measurement program. We used the value from VALD (), which is well-confirmed by theory and experiment (see, e.g., Theodosiou, 1989). The Ca I line at Å is unfortunately blended with a CH line at the resolution of our spectra, thus the Ca abundance derived from this line is of limited reliability.
4.6 Uncertainties in Abundances
A number of different circumstances contribute uncertainties to the abundances derived. Among these are errors in the measured equivalent widths, in the basic physical data such as values or dissociation energies, in the fundamental stellar parameters adopted, in the model atmospheres, and in the spectrum calculations. We here comment on these different uncertainties. The changes of abundances resulting from variations of stellar parameters and in equivalent width are summarized in Table 8.
4.6.1 Errors in Measured Equivalent Widths
From Equation (1) and the quality of the UVES spectra it follows that the uncertainties in the measurement of equivalent widths of individual lines is mÅ throughout most of the wavelength range covered; in the very blue part it continuously rises from mÅ at 3700 Å to mÅ at 3300 Å. The precision in abundance determination can clearly be improved if many lines can be measured. However, since only a few lines are detected in the UVES spectra of HE 01075240 available to us in this investigation, equivalent width measurement errors play a significant role. Furthermore, the lines that are detected are weak, hence errors of mÅ have a comparatively large influence on the abundances. In the last column of Table 8 we summarize the effect that an increase of by mÅ applied to each individual line in the set of lines we detected, or to the individual lines we used for deriving upper limits, has on the derived abundances. With the exception of a very small effect on Ca II, due to the large equivalent width of Ca II K, the abundance changes are between 0.06 dex and 0.13 dex.
We applied our equivalent width measurement routine to the UVES spectra of CD , and compared our results for 145 lines in common with the analysis of NRB01 with their measurements, kindly made available to us in electronic form by S.G. Ryan. The agreement between the measurements is very good (see Figure 14). A straight line fit yields the relation
| (3) |
The one-sigma scatter is mÅ, in very good agreement with the expectations from photon statistics, e.g., Equation (1).
However, there is an indication that we measure systematically slightly smaller values than NRB01. This is very likely due to the different method that we employ for continuum placement. While we perform a fit to line-free wavelength regions, NRB01 determine the continuum level manually. We note that the small systematic offset in equivalent widths has only a minor effect on abundances. For example, in case of Fe I, converting our measurements to the scale of NRB01 by means of Equation (3) leads to a change of only dex in [Fe/H], which is negligible compared to other sources of error (see Table 8, and §4.6 below for a further discussion). A much more accurate continuum placement will be possible with higher spectra.
4.6.2 Errors in Physical Data
Accurately measured values are available for most species analysed in HE 01075240. However, as recently discussed by Carretta et al. (2002), comparison of values from different sources yields line-to-line scatters as high as – dex for certain species, e.g., Fe I, Fe II, or Ti II, while systematic offsets are typically smaller than dex.
4.6.3 Errors in Fundamental Stellar Parameters
The sensitivity of the derived abundances to changes of the stellar parameters are summarized in Table 8. The dominant error source is the uncertainty in , resulting in abundance errors of typically 0.1–0.2 dex. Uncertainties in have the largest effect on abundances of singly-ionized species, and are negligible for most of the neutral species. Since the lines we detect in the spectrum of HE 01075240 are all very weak (with the exception of Ca II H and K, and the Balmer lines), the effects of the microturbulence parameter is negligible. Hence even our large uncertainty in of 0.5 km -1 does not result in significant abundance errors.
4.6.4 Errors in Model Atmospheres and in the Spectrum Calculations
The most important errors in the model atmospheres are likely those due to the assumption of homogeneous stratification (i.e., the neglect of thermal and density inhomogeneities), the adoption of mixing-length theory convection, and those due to the assumption of LTE. The inadequacy of the first-mentioned assumptions is demonstrated clearly by the 3D hydrodynamical-radiative simulations of the atmospheres of a Population II subgiant and dwarf by Asplund et al. (1999). These authors find quite low temperatures in the upper layers of the models, as compared to 1D MLT models. For spectral lines partially formed in the outer atmospheric layers (i.e., lines from molecules as well as low-excitation lines from atoms) one thus would expect weaker lines predicted by the 1D models than a 3D model would give. This effect is demonstrated in the work by Asplund et al. (1999), indicating that 1D models may yield abundances that are overestimated by typically – dex, and for molecular lines even by up to 0.6 dex (Asplund & García Pérez, 2001).
The other major uncertainty of the present model, and the subsequent analysis, is the assumption of LTE. For the model atmosphere, the low metallicity makes hydrogen, in different forms, such as H I, H-, H and , the totally dominant species. Of the various processes that are expected to deviate from LTE, the most important seems to be the ionization of H I. The degree of ionization of H I in the line-forming region is typically only a factor of 10-5, but since this ionization contributes the electrons for forming H-, the ionization balance is of vital significance for the atmospheric structure. Assuming the optically very dense Lyman transition to be in detailed balance in most of the spectrum-forming region, one would believe that photo-ionization from the level is more efficient than in LTE. This is because the radiation from wavelengths below the Balmer discontinuity comes from deeper atmospheric layers, unhindered by the heavy metal-line blocking that usually makes this radiation local in more metal-rich objects. Assessment of the effect that this has on abundance determinations requires detailed statistical-equilibrium calculations. However, the tendency will probably be to increase the photo-ionization and thus the electron pressure, which will increase the H- absorption and thus the ratios in proportion (here denotes the spectral-line absorption coefficient). This will decrease calculated equivalent widths correspondingly. If these non-LTE effects are not considered, the abundances derived will tend to be underestimated.
For the analysis of the spectrum, non-LTE effects for the atoms and molecules analysed may also be significant. The most important effect will probably be photoionization, stronger than LTE predicts, again as a result of the hot radiation fields from deeper photospheric layers. This is probably only a minor effect in the determination of abundances from Fe II, Sr II or O I, because these are ions that are in majority relative to other forms of the element. These effects may well amount to a few times dex (see the case of Fe I discussed in §3.2), and again lead to underestimated abundances.
It is not known to what extent photodissociation of, for instance, CH, will affect the abundance determinations – however, underestimates are here also most probable. It seems that the non-LTE effects for the hydrogen ionization, affecting H-, and those for metal atoms and other elements, will be in the same sense and therefore probably cause significant underestimates of the abundances.
For the determination of many abundances we are in a situation where the effects of 3D convection and those of departures from LTE may counteract one another. Both may well be on the order of 0.3 dex in the derived abundances, and it is not at all clear to what extent they may cancel, such as they happen to do for Li in Population II dwarfs (Asplund et al., 2003). The degree to which cancellation occurs is also most probably different for different elements. It seems that the safest abundance determinations are those based on ions with abundances that are not very temperature sensitive, such as Ti II. Such lines tend to be rather insensitive to both convection uncertainties and overionization. Although the quality of our UVES spectra are high, we have only very few such lines detected. Further observations of HE 01075240 with UVES, yielding spectra of even higher resolution and , and covering the whole spectral range accessible with UVES, from Å to Å, have already been obtained, and will be discussed in future papers (Bessell et al., in preparation; Christlieb et al., in preparation). Also, a 3D model atmosphere for HE 01075240 is currently being computed.
5 DISCUSSION
5.1 The Abundance Pattern of HE 01075240
The elemental abundance pattern obtained for HE 01075240 can be summarized as follows:
-
•
Carbon is very much enhanced, relative to the solar C/Fe, by a factor of several thousand to ten thousand. Nitrogen is also strongly enhanced, by a factor of more than one hundred. The abundance ratio C/N is 40–150 .
-
•
.
-
•
There is a significant enhancement of Na, by more than a factor of six, while Al does not seem to be enhanced.
-
•
There is a rather weak enhancement of Mg and possibly of Ca, but not of Ti. The upper limit of Si suggests a maximal enhancement of a factor of two relative to Fe.
-
•
The upper limits for Cr and Mn indicate that these elements are not enhanced relative to Fe; Ni is slightly depleted, but this is possibly due to non-LTE effects, so that Ni/Fe might actually be close to solar.
-
•
Sr seems to be depleted relative to Fe, while the present upper limits on Ba and Eu are weak, and would allow for enhancements of a factor of and , respectively.
-
•
Upper limits on Sc and Co are about a factor of 10 times solar, while that on Zn is as high as times solar.
How do these abundances compare with results obtained for other extremely metal- poor stars?
A considerable fraction of the giants and subgiants of the extreme Population II show strong CH bands and are known to be rich in carbon as well as nitrogen (Rossi et al., 1999). Many of these CH stars also show s-process element excesses. For example, Hill et al. (2000) have recently analysed two giant stars, CS 22948-027 and CS 29497-034, with and , respectively. These authors found carbon and nitrogen overabundances [C/Fe] and [N/Fe] of about 2 dex for the two stars. Sr and Y are enhanced by about 1 dex, while Ba, La, Eu and other heavy s- and r-process elements are all enhanced by about 2 dex. While being strongly overabundant in C and N, HE 01075240 does not show any signs of being rich in s-process elements (as judged from [Sr/Fe] and a poor upper limit of [Ba/Fe]). However, there are also metal-poor CH stars not enriched in s-process elements. One well studied giant star of this kind is CS 22957-027 (Norris et al., 1997; Bonifacio et al., 1998; Preston & Sneden, 2001), which has an effective temperature and a surface gravity close to that of HE 01075240. It has [Fe/H] between and , and also a considerable N enhancement. [Na/Fe] is around +0.8 dex (Preston & Sneden, 2001) and Mg and Ti are moderately enriched. However, Sr and Ba are depleted relative to Fe and to the Sun by 0.6 dex or more. Other similar, but less extreme, giants are CS 30314-067, CS 29502-092, and CS 22877-001 (Aoki et al., 2002).
It may be tempting to regard CS 22957-027 as a more metal-rich version of HE 01075240. However, Preston & Sneden found that CS 22957-027 is a spectroscopic binary with a period of about 3125 days. The binary character of the star was not expected, since its low values of the s-process elements does not suggest its atmospheric composition to be the result of mass transfer from a companion in the Asymptotic Giant Branch (AGB) stage. Preston & Sneden speculated that this star has developed into a carbon star as a result of internal mixing after the first He shell flashes (case II of Fujimoto et al., 2000), and that it just happens to have a companion.
Another star, which may have a chemical composition of the surface layers similar to that of HE 01075240, is the dwarf carbon star G77-61. It was found by Gass et al. (1988) to have a chemical composition with of 7.3, 5.2, and 2.0 for C, N, and Fe, respectively. The corresponding values for HE 01075240 are 7.0, 4.8 and 2.2. However, Gass et al. found abundances of Na and Mg that are typically a factor of 10 higher than our values for HE 01075240. G77-61 also shows velocity shifts of its spectral lines with a period of days, which are ascribed to a companion (Dearborn et al., 1986). Concerning the spectral analysis, we note that the complex spectrum of G77-61 is difficult to analyse, and that the quality of the spectrum used by Gass et al. (1988) was limited (i.e., ; per resolution element). The possible similarities between the abundance pattern of G77-61 and HE 01075240, as well as the low iron abundance claimed for the former star by Gass et al., require confirmation by an analysis based on higher quality data before any conclusions can be drawn. Such analyses, based on Subaru/HDS and Keck/HIRES spectra are in progress (Aoki, private communication; Plez & Cohen, private communication).
No significant radial velocity shifts have been found for HE 01075240 so far. In this respect it seems to depart from both CS 22957-027 and G77-61, but both binaries are long-period, low-amplitude systems. If HE 01075240 is a binary with a period as long as either of these two stars, it probably would not have been detected based on the radial velocity measurements made to date.
The comparison with other extremely metal-poor stars suggests that the abundance pattern of HE 01075240 is not totally unique, although the star is certainly much more iron-poor than any other giant discovered until now. With this background, we discuss the astrophysical origin of the abundance pattern of this star below.
5.2 Nucleosynthesis and HE 01075240
The observed abundance pattern raises the following main questions:
-
(a)
What were the processes, and what were the sites, where the heavy nuclei of this star were formed?
-
(b)
How were these nuclei acquired by this star? Did they arise due to enrichment from earlier supernovae (SNe), or other objects, or from the previously polluted insterstellar cloud in which the star was formed? Did they arise via accretion from a neighboring star (presumably a binary companion)? Did they arise via accretion from the general interstellar medium (ISM) after multiple passages of the star through the Galactic plane? Did they arise as a result of dredging up processed material from the deeper layers of the star itself?
-
(c)
Could the surface composition of the star have been affected by other processes, such as diffusion or selective radiative pressure expulsion?
Below we address these issues, guided by contemporary calculations of the evolution of very metal-poor stars and by calculations of yields from SNe and from other contributors of heavy elements in the early Galaxy.
5.2.1 Synthesis in Supernovae
The relative abundances of HE 01075240 might have been created by yields from a SN with and a mass of about 15–25 solar masses, as modeled by Woosley & Weaver (1995) and Umeda & Nomoto (2002). This is illustrated in Figure 15. The yields of massive Pop. III pair-instability supernovae (i.e., hypernovae) computed by Heger & Woosley (2002) or Umeda & Nomoto (2002) also offer rather good fits to our observed abundances. However, all of the above mentioned supernova models do not at all explain the high carbon, nitrogen, and sodium abundances. The predicted amounts of C and N depart from those observed in HE 01075240, by typically 4–5 dex.
Norris et al. (2002), in an attempt to explain the chemical composition of CS 22949-037 (, , ), refer to the study of massive non-rotating and rotating pair-instability SN models by Fryer et al. (2001). The latter authors suggested that in the case of pair-instability SN the shear between the convective hydrogen shell and the core can become large enough to lead to a significant dredge-up of the helium core, i.e. helium and large amounts of helium-burning products (carbon, oxygen, neon) are mixed into the envelope. Some of the carbon and oxygen are then burned by the CNO process to nitrogen. Fryer et al. found total envelope masses of carbon and nitrogen of and solar masses, respectively, for a 250 M⊙ model, while the corresponding envelope masses for a M⊙ model are solar masses of carbon, of nitrogen, of oxygen and of neon and of magnesium. The latter model does not explode but turns into a black hole. However, as discussed by Norris et al., it may be possible that at least some of the envelope could be expelled due to a stellar wind, pulsations, etc. If the nitrogen and a significant fraction of the carbon were produced by such hypernovae, an important problem will be to limit the yield of heavier elements like Mg.
Umeda & Nomoto (2003) proposed that the abundance pattern of HE 01075240 arises from material that has been enriched by a Population III star exploding as a supernova of low explosion energy (). By assuming that the material produced during the SN event is homogeneously mixed over a wide range of the mass coordinate, and a large fraction of the material falls back onto the compact remnant (the “mixing and fallback” mechanism), Umeda & Nomoto are able to reproduce the abundance pattern of HE 01075240 quite well (see their Figure 1). In particular, very high C/Fe and N/Fe ratios can be produced in this scenario, with the CNO elements produced in late stages of the evolution of the SN progenitor (for a similar work on the abundance patterns of CS 29498-043 and CS 22949-037 see Tsujimoto & Shigeyama, 2003).
5.2.2 Synthesis in Red Giants
The strong overabundance of carbon may suggest HE 01075240 to be a carbon star, i.e. a star that has produced its own 12C by He burning and subsequent mixing out of the processed material, presumably in a He shell flash during the AGB stage of evolution. However, a strong argument against this possibility is provided by the derived surface gravity, which is higher than those characteristic of AGB stars (which typically have in cgs units). An alternative to this explanation would then be that the star was polluted by a more massive companion that had previously evolved into a carbon star.
These alternatives obviously assume two different nucleosynthesis sites – a red giant origin of the CN(O) elements and of some of the Na and Mg, and an earlier supernovae origin for the rest of the elements.
Fujimoto et al. (2000) discuss the origin of extremely metal-poor carbon stars. In their evolutionary low-mass () models for extremely metal-poor stars (), the helium convection during the first off-centre helium core flash extends into the hydrogen-containing layers. This brings hydrogen down to hotter regions, leading to intensive hydrogen burning (a “H flash”), and matter that has experienced helium-burning reactions and then is further processed by hydrogen burning reactions, is subsequently brought to the surface. As a result, for a 0.8 M⊙ model, a surface abundance close to solar (relative to hydrogen) would result for carbon. Roughly equal amounts of nitrogen would also be produced by subsequent CNO burning. For a somewhat more massive model, M⊙, a similar process occurs. On the other hand, for models with , helium ignites in the core before the electrons have become degenerate and before a temperature inversion in the core has been established due to neutrino losses. For somewhat more metal-rich models (), Fujimoto et al. find that the outer edge of the core-flash driven convection shell barely touches the hydrogen-rich matter, and further mixing does not occur during the core flash. Later, however, after the first shell flashes at the base of the AGB, the surface convection zone extends down into layers formerly occupied by the helium-convection shell, and for a model again a roughly solar carbon surface abundance is produced, while the nitrogen abundance is lower by one order of magnitude. This higher C/N ratio (about 6 instead of 1) is due to the larger carbon abundance in the helium convection zone for this case.
Fujimoto et al. (2000) argue that no third dredge-up with heavy elements produced by the s-process should occur for stars with and . Thus, both for the most metal-poor case, when the He core flash produces the carbon enrichment, and for the more metal-rich case when the first shell flashes on the AGB are responsible, the s-process-element enrichment can be avoided.
Schlattl et al. (2002) carried out similar model calculations and verified several of the findings by Fujimoto et al. However, they find the occurance of the H-flash to be quite sensitive to details, such as the exact He abundance and the assumptions concerning diffusion, in particular for higher masses (around 1 M⊙). They also find resulting carbon and nitrogen abundances relative to iron of about 4 orders of magnitude greater than those of the Sun, and 12C/13C ratios of about 5. They discuss the fact that their models produce far too much carbon and nitrogen, as compared with carbon-rich Population II giants such as CS 22892-052, and presume that this failure might be due to the crude one-dimensional description used to calculate the violent H burning in the helium-flash driven convective zone.
Siess et al. (2002) followed the evolution of models of metal-free stars up the AGB with masses from 0.8–20 solar masses, and found in the 1–5 solar mass models that a secondary convective zone developed at the He-H discontinuity in the beginning of the AGB phase. This region expands and engulfs gas that just has been carbon-enriched in the He-burning shell, as well as hydrogen from upper layers. H-burning flashes occur with CNO burning, and subsequently the convective envelope dredges the products to the surface. The envelopes thus become considerably enriched by 12C and 14N, as well as 23Na and 25,26Mg. For instance, their 1.0 M⊙ model ends with a surface abundance of carbon of 3 times solar, while the C/N ratio is about 10. This seems to suggest that the C and N enrichment of HE 01075240 could well be the result of mass transfer from such a companion. The models of Siess et al. also suggest an enrichment of Na and Mg, with two orders of magnitude greater Na/C and Mg/C ratios than those observed HE 01075240. Also, some s-process elements may possibly be produced in these models, despite the lack of iron seeds. However, the predicted amounts of Na, Mg and the s-process elements are relatively uncertain. The hypothesis of the origin of carbon and nitrogen as a result of accretion from an AGB companion following this path still seems possible.
From the work by Fujimoto et al., Schlattl et al., and Siess et al. we conclude that HE 01075240 may have been polluted by a low-mass companion that evolved up to the tip of the red-giant branch, and produced considerable amounts of C and N as a result of the He core flash. This material was later deposited onto our star. The arguments against this hypothesis come from the predicted low C/N ratio, as compared with the ratio observed, and the high 12C/13C ratio of the star. Another hypothesis from this point of view might be an evolution of the star itself, similar to that found by Fujimoto et al. for models with , where the surface carbon is produced by the first He shell flashes, at the base of the AGB, leading to higher C/N ratios. In this case, the star could show the CNO abundance peculiarities already at the base of the AGB. However, the radius of the star at this stage should already be so large that it is barely compatible with our lower limit of the surface gravity.
5.3 Other Hypotheses: Selective Dust Depletion, Accretion from the ISM
In Christlieb et al. (2002a), we considered the possibility that HE 01075240 is a Population II post-AGB star, similar, e.g., to RV Tauri stars of Preston type B or C (Giridhar, 2000, and references therein). These pulsating metal-poor stars are generally believed to be affected by dust-gas separation, which may systematically deplete the atmospheres of elements that may condense at high temperature. In fact, plotting the abundances of the different elements versus dust condensation temperatures, we find a possible strong correlation in this direction (see Figure 16), as is also seen in metal-poor post-AGB stars (see, e.g., Trams et al., 1993). However, the existence of a correlation is only supported by the high values of the CN abundances, with this interpretation then suggesting original abundances of the star corresponding to . The correlation is also consistent with our upper limit on the Zn abundance. Another abundance that could support the hypothesis would be that of sulphur, with a relatively low condensation temperature. Unfortunately, it is not possible to derive a meaningful upper limit for S from the spectra used in this study . On the other hand, the high C/N ratio observed in HE 01075240 is not observed in other metal-poor AGB stars (Trams et al., 1993), and cannot be explained by selective depletion.
The similarity of HE 01075240 with the RV Tauri stars is mainly restricted to its low metal abundances as compared with its CN abundances. Its effective temperature is at the lower end of the temperature interval of observed stars of type B and C (see Giridhar et al., 2000). The steep increase of the mass of the convective zone when the temperature decreases as a star approaches the giant branch suggests that any chemical inhomogeneities at the surface of HE 01075240 should be diminished by mixing. Also, the star is neither known to be pulsating, nor a binary, which the typical, strongly affected RV Tauri stars tend to be (Van Winckel et al., 1995, 1999). We therefore conclude again that the chemical peculiarities of HE 01075240 are probably not the result of selective dust condensation of the type that has been active in RV Tauri stars, although further efforts to measure lines of Zn and S should be made in order to exclude, or potentially open up, this possibility.
The abundances of most heavy elements observed in HE 01075240 are so low, and the age of the star presumably so large (on the order of the age of the Universe), that one should consider the possibility that its abundances have been severely changed by accretion from the interstellar medium. It may even have been formed out of totally metal-free gas and accreted its heavy nuclei during repeated passages through the Galactic disk. The possibility that halo stars accrete metal-rich material through encounters with interstellar clouds in the Galactic plane was suggested and discussed by Talbot & Newman (1977), Yoshii (1981), and Iben (1983). Yoshii made calculations of the accretion rates onto halo stars, and found typical amounts of accreted material onto a 0.8 M⊙ halo star, from the formation of the Galactic disk to present times, of to solar masses, depending on the adopted orbital parameters. Following Yoshii (1981) and adopting a mass of the convective envelope of HE 01075240 of 0.2–0.3 M⊙ and a solar composition of the Galactic gas disk, we find that accretion should lead to heavy-element abundances in the range . As judged from this estimate, all heavy nuclei of our star could be accreted. However, Yoshii’s estimate is still uncertain. For example, the effects of a stellar wind “protecting” the star from accretion are not considered.
A variation of the accretion scenario is discussed by Shigeyama et al. (2003). They estimate that considerable accretion rates (of the order of ) can be reached if the velocity of the star relative to the gas cloud from which it accretes is low (i.e., km/s). The solar mass-loss rate is , and the authors also argue that the wind of an extremely metal-deficient dwarf is expected to be much weaker than that of the Sun.
We conclude that most heavy elements of HE 01075240 might be accreted from the interstellar medium, although this is most probably not the case for C, N, and Na.
6 DISCUSSION AND CONCLUSIONS
We have found an overall metal abundance of HE 01075240, disregarding the CNO elements, of less than solar, or more than one order of magnitude less than any other known extremely metal-poor giant star. It is tempting to speculate that the chemical composition of this star might reflect nucleosynthesis processes that occured during the very first star formation period of the universe, only about 200 Myr from the Big Bang, according to recent WMAP data (Bennett et al., 2003; Kogut et al., 2003). To what extent this is the case, and for which elements, remains to be explored. Obviously, an important issue to be investigated in the future is the similarity of the abundance pattern of HE 01075240 with other stars with , if such stars exist.
From the discussion above we conclude that most elements heavier than Na in HE 01075240 may be the result of one or a few supernova explosions. We cannot disprove the alternative hypothesis that these elements were gradually accreted e.g. from the interstellar medium in the Galactic disc during passages of the star through it.
Concerning the origin of carbon and nitrogen, one hypothesis is that the star has made them through helium and hydrogen burning and mixed them to the surface as the result of a He and H flash. Also, Na may have been formed this way. If this self-enrichment scenario is true, a problem remains – why are the observed amounts of C and N significantly smaller than those predicted by the models? One way around this would be to assume that HE 01075240 was instead polluted by a binary companion that went through this development. In this case there would still be a problem with the C/N ratio, which is predicted by current models to be one order of magnitude greater than the observed one, as well as the 12C/13C ratio, which is predicted to be much smaller. A hypothetical companion probably also went through a number of He flashes which might have produced some s-process elements. More precise measurements of the abundance of the s-process elements, as well as oxygen, and radial velocity measurements spanning a longer period of time, will put stronger constraints on possible scenarios for the origin of C and N in the atmosphere of HE 01075240.
As already discussed in Christlieb et al. (2002a), it has been thought, until very recently, that with the exception of the metal-depleted post-AGB stars (and G77–61, for which no accurate Fe abundance measurement is available), stars of did not exist. This observational limit is based on the failure of even very extensive wide-angle spectroscopic surveys, like the HK survey of Beers, Preston and Shectman (Beers et al., 1992; Beers, 1999), to reveal a star more metal-poor than CD . This failure is easily explainable theoretically, e.g., by the fact that a massive star of, say, has an evolutionary timescale that is about one order of magnitude shorter than the contraction timescale of a star. It was therefore thought that the massive members of the first generation of stars in our Galaxy, ending up as supernovae of type II (SN II), might have enriched the ISM to before low-mass stars formed. Alternatively, low-mass star formation might have been suppressed by less efficient cooling due to the absence of metals (e.g., Bond, 1981). The discovery of HE 01075240 can be a challenge to these scenarios.
However, if the first generation of stars was predominantly located in the mass range – M⊙, and exploded as low-explosion-energy supernovae as suggested by Umeda & Nomoto (2003), the influence of the presence of C and O in nearly primordial gas clouds on cooling needs to be taken into account. Umeda & Nomoto report that “the cooling efficiency is large enough to form small mass stars” in this case.
One prediction of the model of Umeda & Nomoto is that HE 01075240 should have an oxygen abundance of dex. We shall confront this prediction with more recent observations in a forthcoming paper.
A consequence of the scenario of Umeda & Nomoto would be that, if there is a critical overall metallicity, , which needs to be reached in order to make the formation of low-mass stars possible, all low-mass stars below should be enhanced in CNO relative to Fe and other elements, giving rise to more efficient cooling of the gas, and the subsequent enhanced formation of such stars. This scenario could be tested by the assemblage of a significant sample of metal-poor stars, extending to , and determination of the fraction of carbon-enhanced stars in that sample.
We note that the Umeda & Nomoto scenario is also attractive in that it does not require the existence of a binary companion for the carbon-enhanced stars. In fact, there are at least three unevolved carbon-enhanced metal-poor stars known that do not show any radial velocity variations larger than 0.4 km s-1 over a period of 8 years (Preston & Sneden, 2001), ruling out, at least for these three stars, the scenario in which a formerly more massive star went through its AGB phase and transfered dredged-up material onto the surface of the less-massive companion.
It should be realized, when considering the attractive features of the Umeda & Nomoto model, that it, unlike the other models discussed, was proposed a posteriori, with knowledge about the peculiarities of HE 01075240. At present, we consider it premature to judge whether this model is to be preferred to the SN plus red giant alternative.
HE 01075240 was found in a sample of roughly stars with identified in the Hamburg/ESO and HK surveys. Assuming that HE 01075240 is not unique, and considering that up to now only roughly of the HES metal-poor candidates have been followed-up on, it is not excluded that one or more additional stars with will be found in the HES, or other proposed surveys in the near future.
References
- Ali & Griem (1966) Ali, A. & Griem, H. 1966, Phys. Rev., 144, 366
- Allende Prieto et al. (2002) Allende Prieto, C., Lambert, D., & Asplund, M. 2002, ApJ, 573, L137
- Alonso et al. (1998) Alonso, A., Arribas, S., & Martínez-Roger, C. 1998, A&AS, 131, 209
- Alonso et al. (1999) —. 1999, A&AS, 140, 261
- Alonso et al. (2001) Alonso, A., Arribas, S., & Martínez-Roger, C. 2001, A&A, 376, 1039
- Aoki et al. (2002) Aoki, W., Norris, J., Ryan, S., Beers, T., & Ando, H. 2002, ApJ, 567, 1166
- Asplund (2000) Asplund, M. 2000, A&A, 359, 755
- Asplund et al. (2003) Asplund, M., Carlsson, M., & Botnen, A. 2003, A&A, 399, L31
- Asplund & García Pérez (2001) Asplund, M. & García Pérez, A. 2001, A&A, 372, 601
- Asplund et al. (1997) Asplund, M., Gustafsson, B., Kiselman, D., & Eriksson, K. 1997, A&A, 318, 521
- Asplund et al. (2000a) Asplund, M., Nordlund, Å., Trampedach, R., , & Stein, R. 2000a, A&A, 359, 743
- Asplund et al. (2000b) Asplund, M., Nordlund, Å., Trampedach, R., Allende Prieto, C., & Stein, R. 2000b, A&A, 359, 729
- Asplund et al. (1999) Asplund, M., Nordlund, Å., Trampedach, R., & Stein, R. 1999, A&A, 346, L17
- Athay & Lites (1972) Athay, R. & Lites, B. 1972, ApJ, 176, 809
- Barklem et al. (2000) Barklem, P., Piskunov, N., & O’Mara, B. 2000, A&A, 363, 1091
- Bautista (1997) Bautista, M. 1997, A&AS, 122, 167
- Beers (1999) Beers, T. C. 1999, in ASP Conf. Ser., Vol. 165, The Third Stromlo Symposium: The Galactic Halo, ed. B. Gibson, T. Axelrod, & M. Putman, 202–212
- Beers et al. (1992) Beers, T. C., Preston, G. W., & Shectman, S. A. 1992, AJ, 103, 1987
- Bennett et al. (2003) Bennett, C., Halpern, M., Hinshaw, G., Jarosik, N., Kogut, A., Limon, M., Meyer, S., Page, L., Spergel, D., Tucker, G., Wollack, E., Wright, E., Barnes, C., Greason, M., Hill, R., Komatsu, E., Nolta, M., Odegard, N., Peirs, H., Verde, L., & Weiland, J. 2003, ApJS, 148, 1
- Bessell & Brett (1988) Bessell, M. & Brett, J. 1988, PASP, 100, 1134
- Bessell & Norris (1984) Bessell, M. & Norris, J. 1984, ApJ, 285, 622
- Böhm-Vitense (1958) Böhm-Vitense, E. 1958, Z. Astrophys., 46, 108
- Bond (1981) Bond, H. E. 1981, ApJ, 248, 606
- Bonifacio et al. (1998) Bonifacio, P., Molaro, P., Beers, T., & Vladilo, G. 1998, A&A, 332, 672
- Bromm et al. (2001) Bromm, V., Ferrara, A., Coppi, P., & Larson, R. 2001, MNRAS, 328, 969
- Burstein & Heiles (1982) Burstein, D. & Heiles, C. 1982, AJ, 87, 1165
- Carpenter (2001) Carpenter, J. 2001, AJ, 121, 2851
- Carretta et al. (2002) Carretta, E., Gratton, R., Cohen, J., Beers, T., & Christlieb, N. 2002, AJ, 124, 481
- Cayrel et al. (2003) Cayrel, R., Depagne, E., Spite, M., Hill, V., Spite, F., Francois, P., Beers, T., Primas, F., Andersen, J., Barbuy, B., Bonifacio, P., Molaro, P., & Nordström, B. 2003, A&A in press, astro-ph/0311082
- Cayrel et al. (2001) Cayrel, R., Hill, V., Beers, T., Barbuy, B., Spite, M., Spite, F., Plez, B., Andersen, J., Bonifacio, P., Francois, P., Molaro, P., Nordström, B., & Primas, F. 2001, Nature, 409, 691
- Christlieb (2003) Christlieb, N. 2003, Rev. Mod. Astron., 16, 191 (astro-ph/0308016)
- Christlieb et al. (2002a) Christlieb, N., Bessell, M., Beers, T., Gustafsson, B., Korn, A., Barklem, P., Karlsson, T., Mizuno-Wiedner, M., & Rossi, S. 2002a, Nature, 419, 904 (Paper I)
- Christlieb et al. (2001a) Christlieb, N., Green, P., Wisotzki, L., & Reimers, D. 2001a, A&A, 375, 366
- Christlieb et al. (2002b) Christlieb, N., Wisotzki, L., & Graßhoff, G. 2002b, A&A, 391, 397
- Christlieb et al. (2001b) Christlieb, N., Wisotzki, L., & Reimers, D. 2001b, in Mining the Sky, ed. A. Banday, S. Zaroubi, & M. Bartelmann (Berlin: Springer), 372–378 (astro-ph/0010455)
- Christlieb et al. (2001c) Christlieb, N., Wisotzki, L., Reimers, D., Homeier, D., Koester, D., & Heber, U. 2001c, A&A, 366, 898
- Clem (1998) Clem, J. 1998, Master’s thesis, University of Victoria
- Cohen et al. (2002) Cohen, J., Christlieb, N., Beers, T., Gratton, R., & Carretta, E. 2002, AJ, 124, 470
- Cohen et al. (2003) Cohen, J., Christlieb, N., Qian, Y., & Wasserburg, G. 2003, ApJ, 588, 1082
- Dearborn et al. (1986) Dearborn, D. S. P., Liebert, J., Aaronson, M., Dahn, C. C., Harrington, R., Mould, J., & Greenstein, J. L. 1986, ApJ, 300, 314
- Dekker et al. (2000) Dekker, H., D’Odorico, S., Kaufer, A., Delabre, B., & Kotzlowski. 2000, in Optical and IR Telescope Instrumentation and Detectors, ed. M. Iye & A. F. Moorwood, Vol. 4008, 534–545
- Depagne et al. (2000) Depagne, E., Hill, V., Christlieb, N., & Primas, F. 2000, A&A, 364, L6
- Depagne et al. (2002) Depagne, E., Hill, V., Spite, M., Spite, F., Plez, B., Beers, T., Barbuy, B., Cayrel, R., Andersen, J., Bonifacio, P., François, P., Nordström, B., & Primas, F. 2002, A&A, 390, 187
- Edvardsson et al. (1993) Edvardsson, B., Andersen, J., Gustafsson, B., Lambert, D., Nissen, P.-E., & Tomkin, J. 1993, A&A, 275, 101
- Francois et al. (2003) Francois, P., Depagne, E., Hill, V., Spite, M., Spite, F., Plez, B., Beers, T., Barbuy, B., Cayrel, R., Andersen, J., Bonifacio, P., Molaro, P., Nordström, B., & Primas, F. 2003, A&A, 403, 1105
- Fryer et al. (2001) Fryer, C., Woosley, S., & Heger, A. 2001, ApJ, 550, 372
- Fuhrmann (1998) Fuhrmann, K. 1998, A&A, 330, 626
- Fujimoto et al. (2000) Fujimoto, M. Y., Ikeda, Y., & Iben, Jr., I. 2000, ApJ, 529, L25
- Gass et al. (1988) Gass, H., Wehrse, R., & Liebert, J. 1988, A&A, 189, 194
- Gehren (1975a) Gehren, T. 1975a, LTE-Sternatmosphärenmodelle (I), Tech. rep., Universität Kiel
- Gehren (1975b) —. 1975b, LTE-Sternatmosphärenmodelle (II), Tech. rep., Universität Kiel
- Gehren et al. (2001a) Gehren, T., Butler, K., Mashonkina, L., Reetz, J., & Shi, J. 2001a, A&A, 366, 981
- Gehren et al. (2001b) Gehren, T., Korn, A., & Shi, J. 2001b, A&A, 380, 645
- Giridhar (2000) Giridhar, S. 2000, in IAU Symposium 177: The carbon star phenomenon, ed. R. Wing (Dordrecht: Kluwer), 117–125
- Giridhar et al. (2000) Giridhar, S., Lambert, D., & Gonzalez, G. 2000, ApJ, 531, 521
- Gratton et al. (1999) Gratton, R., Carretta, E., Eriksson, K., & Gustafsson, G. 1999, A&A, 350, 955
- Grevesse & Sauval (1998) Grevesse, N. & Sauval, A. 1998, Space Sci. Rev., 85, 161
- Gustafsson et al. (1975) Gustafsson, B., Bell, R., Eriksson, K., & Nordlund, Å. 1975, A&A, 42, 407
- Heger & Woosley (2002) Heger, A. & Woosley, S. 2002, ApJ, 567, 532
- Hill et al. (2000) Hill, V., Barbuy, B., Spite, M., Spite, F., Plez, R. C. B., Beers, T., Nordström, B., & Nissen, P. 2000, A&A, 353, 557
- Hill et al. (2002) Hill, V., Plez, B., Cayrel, R., Nordström, T. B. B., Andersen, J., Spite, M., Spite, F., Barbuy, B., Bonifacio, P., Depagne, E., François, P., & Primas, F. 2002, A&A, 387, 560
- Holweger (2001) Holweger, H. 2001, in AIP Conf. Ser., Vol. 598, Joint SOHO/ACE workshop “Solar and Galactic Composition”, ed. R. Wimmer-Schweingruber, 23–30
- Holweger & Müller (1974) Holweger, H. & Müller, E. 1974, Solar Physics, 39, 19
- Houdashelt et al. (2000) Houdashelt, M., Bell, R., & Sweigart, A. 2000, AJ, 119, 1448
- Iben (1983) Iben, I. 1983, Memorie della Societa Astronomica Italiana, 54, 321
- Jørgensen et al. (1992) Jørgensen, U., Johnson, H., & Nordlund, Å. 1992, A&A, 261, 263
- Jørgensen et al. (1996) Jørgensen, U., Larsson, M., Iwamae, A., & Yu, B. 1996, A&A, 315, 204
- Kogut et al. (2003) Kogut, A., Spergel, D., Barnes, C., Bennett, C., Halpern, M., Hinshaw, G., Jarosik, N., Limon, M., Meyer, S., Page, L., Tucker, G., Wollack, E., & Wright, E. 2003, ApJS, 148, 161
- Korn et al. (2003) Korn, A., Shi, J., & Gehren, T. 2003, A&A, 407, 691
- Krupp (1973) Krupp, B. 1973, PhD thesis, University of Maryland
- Krupp (1974) —. 1974, ApJ, 189, 389
- Kupka et al. (1999) Kupka, F., Piskunov, N., Ryabchikova, T., Stempels, H., & Weiss, W. 1999, A&AS, 138, 119
- Kupka et al. (2000) —. 2000, Baltic Astronomy, 9, 590
- Lodders & Fegley (1998) Lodders, K. & Fegley, B. 1998, The Planetary Scientists Companion (New York: Oxford University Press)
- Lucatello et al. (2003) Lucatello, S., Gratton, R., Carretta, E., Cohen, J., Christlieb, N., Beers, T., & Ramírez, S. 2003, AJ, 125, 875
- McWilliam et al. (1995) McWilliam, A., Preston, G., Sneden, C., & Searle, L. 1995, AJ, 109, 2757
- Mermilliod et al. (1997) Mermilliod, J.-C., Mermilliod, M., & Hauck, B. 1997, A&AS, 124, 349
- Moore et al. (1966) Moore, C., Minnaert, M., & Houtgast, J. 1966, The solar spectrum 2935 Å to 8770 Å, Vol. 61 (Washington: National Bureau of Standards Monograph)
- Nakamura & Umemura (2001) Nakamura, F. & Umemura, M. 2001, ApJ, 548, 19
- Nave et al. (1994) Nave, G., Johansson, S., Learner, R., Thorne, A., & Brault, J. 1994, ApJS, 94, 221
- Norris et al. (1996) Norris, J., Ryan, S., & Beers, T. 1996, ApJS, 107, 391
- Norris et al. (2001) —. 2001, ApJ, 561, 1034 (NRB01)
- Norris et al. (2002) Norris, J., Ryan, S., Beers, T., Aoki, W., & Ando, H. 2002, ApJ, 569, L107
- Norris et al. (1997) Norris, J. E., Ryan, S. G., & Beers, T. C. 1997, ApJ, 489, L169
- Piskunov & Valenti (2002) Piskunov, N. & Valenti, J. 2002, A&A, 385, 1095
- Plez et al. (1992) Plez, B., Brett, J., & Nordlund, Å. 1992, A&A, 256, 551
- Preston & Sneden (2001) Preston, G. & Sneden, C. 2001, AJ, 122, 1545
- Rossi et al. (1999) Rossi, S., Beers, T. C., & Sneden, C. 1999, in ASP Conf. Ser., Vol. 165, The Third Stromlo Symposium: The Galactic Halo, ed. B. Gibson, T. Axelrod, & M. Putman, 264–268
- Ryan et al. (1996) Ryan, S., Norris, J., & Beers, T. 1996, ApJ, 471, 254
- Schlattl et al. (2002) Schlattl, H., Cassisi, S., Salaris, M., & Weiss, A. 2002, A&A, 395, 77
- Schlegel et al. (1998) Schlegel, D., Finkbeiner, D., & Davis, M. 1998, ApJ, 500, 525
- Schneider et al. (2002) Schneider, R., Ferrara, A., Natarajan, P., & Omukai, K. 2002, ApJ, 571, 30
- Shigeyama et al. (2003) Shigeyama, T., Tsujimoto, T., & Yoshii, Y. 2003, ApJ, 586, L57
- Siess et al. (2002) Siess, L., Livio, M., & Lattanzio, J. 2002, ApJ, 570, 329
- Skrutskie et al. (1997) Skrutskie, M., Schneider, S., Stiening, R., Strom, S., Weinberg, M., Beichman, C., Chester, T., Cutri, R., Lonsdale, C., Elias, J., Elston, R., Capps, R., Carpenter, J., Huchra, J., Liebert, J., Monet, D., Price, S., & Seitzer, P. 1997, in The Impact of Large Scale Near-IR Sky Surveys, ed. F. Garzón, N. Epchtein, A. Omont, W. Burton, & P. Persi (Dordrecht: Kluwer), 25–32
- Steenbock (1985) Steenbock, W. 1985, in ASSL, Vol. 114, Cool Stars with Excesses of Heavy Elements, 231–234
- Stehlé & Hutcheon (1999) Stehlé, C. & Hutcheon, R. 1999, A&AS, 140, 93
- Talbot & Newman (1977) Talbot, R. & Newman, M. 1977, ApJS, 34, 295
- Theodosiou (1989) Theodosiou, C. 1989, Phys. Rev. A, 39, 4880
- Thévenin & Idiart (1999) Thévenin, F. & Idiart, T. 1999, ApJ, 521, 753
- Trams et al. (1993) Trams, N., Waters, L., & Waelkens, C. 1993, in ASP Conf. Ser., Vol. 45, Luminous High-Latitude Stars, ed. D. Sasselov, 103–114
- Tsujimoto & Shigeyama (2003) Tsujimoto, T. & Shigeyama, T. 2003, ApJ, 584, L87
- Umeda & Nomoto (2002) Umeda, H. & Nomoto, K. 2002, ApJ, 565, 385
- Umeda & Nomoto (2003) —. 2003, Nature, 422, 871
- Van Winckel et al. (1999) Van Winckel, H., Waelkens, C., Fernie, J., & Waters, L. 1999, A&A, 343, 202
- Van Winckel et al. (1995) Van Winckel, H., Waelkens, C., & Waters, L. 1995, A&A, 293, L25
- Vidal et al. (1973) Vidal, C., Cooper, J., & Smith, E. 1973, ApJS, 25, 37
- Wisotzki et al. (2000) Wisotzki, L., Christlieb, N., Bade, N., Beckmann, V., Köhler, T., Vanelle, C., & Reimers, D. 2000, A&A, 358, 77
- Woosley & Weaver (1995) Woosley, S. & Weaver, T. 1995, ApJS, 101, 181
- Yi et al. (2001) Yi, S., Demarque, P., Kim, Y., Lee, Y., Ree, C., Lejeune, T., & Barnes, S. 2001, ApJS, 136, 417
- Yoshii (1981) Yoshii, Y. 1981, A&A, 97, 280
- Yoshii & Saio (1986) Yoshii, Y. & Saio, H. 1986, ApJ, 301, 587
- Zachwieja (1995) Zachwieja, M. 1995, J. Molecular Spectroscopy, 182, 18
| Target | UT dateaaAt beginning of observation | UTaaAt beginning of observation | (sec) |
|---|---|---|---|
| HE 01075240 | 20-Dec-2001 | 00:55:45 | 3600 |
| HE 01075240 | 20-Dec-2001 | 02:03:31 | 3600 |
| HE 01075240 | 20-Dec-2001 | 03:04:58 | 3600 |
| HE 01075240 | 21-Dec-2001 | 02:22:20 | 3600 |
| HE 01075240 | 21-Dec-2001 | 01:24:52 | 3000 |
| CD | 21-Dec-2001 | 01:01:26 | 900 |
| Run | (mag) | (mag) | (mag) | (mag) | (mag) | (mag) | (mag) | (mag) | (mag) |
|---|---|---|---|---|---|---|---|---|---|
| ESO-DK 1.54 maaESO-Danish 1.54 m/DFOSC, December 2001, observer: T.C. Beers | 15.86 | 15.18 | 14.73 | 14.29 | |||||
| LCO 1 mbbLas Campanas 1 m/Direct CCD Camera, 30 December 2001, observer: M. Dehn | 0.09 | 0.50 | 15.16 | ||||||
| 2MASS/JGcc2MASS values transformed to the Johnson-Glass system of Bessell & Brett (1988), using the transformations listed in Carpenter (2001). | 13.70 | 13.20 | 13.24 | ||||||
| SSO 2.3 mddSSO 2.3 m/CASPIR, 22 December 2001, observer: P. Wood | 13.68 | 13.23 | 13.22 | ||||||
| Adopted | 0.09 | 0.50 | 15.86 | 15.17 | 14.73 | 14.29 | 13.69 | 13.22 | 13.23 |
| HE 01075240 | CD | ||||||
|---|---|---|---|---|---|---|---|
| Measured | Value | Derived | Value | Derived | Notes | ||
| quantity | (K) | (K) | (K) | ||||
| H profile | STEHLEBPO | ||||||
| H profile | VCSAG | ||||||
| /J | 0.68 mag | 0.805 magaaBessell & Norris (1984) | HBS00 | ||||
| /C | 0.43 mag | 0.497 magaaBessell & Norris (1984) | HBS00 | ||||
| /C | 0.86 mag | 1.010 magbbMermilliod et al. (1997) | HBS00 | ||||
| /JG | 1.90 mag | 2.33 magccPeterson et al. (1990) | HBS00 | ||||
| /J | 0.68 mag | 0.805 magaaBessell & Norris (1984) | AAM99b | ||||
| /JTCS | 1.95 mag | 2.38 magddAssuming that the transformation of the magnitude to the TCS system leads to the same correction as for HE 01075240, i.e., assuming that HE 01075240 and CD have similar colors. | AAM99b | ||||
| 0.49 mag | 0.594 magbbMermilliod et al. (1997) | AAM99b | |||||
| 0.49 mag | 0.594 magbbMermilliod et al. (1997) | Clem98 | |||||
Note. — Colors with qualifier ‘J’, ‘C’, ‘JG’ refer to the Johnson, Cousins, Johnson-Glass system, respectively. ‘JTCS’ refers to colors where has been converted to the TCS system, using the transformation listed in Alonso et al. (1998).
| Parameter | Value | |
|---|---|---|
| K | K | |
| (cgs) | dex | dex |
| [Fe/H] | dex | dex |
| km s-1 | km s-1 |
| Ion | (Å) | (eV) | (dex) | (mÅ) | (dex) |
|---|---|---|---|---|---|
| Li I | |||||
| Li I | |||||
| Na I | |||||
| Na I | |||||
| Mg I | |||||
| Mg I | |||||
| Al I | |||||
| Si I | |||||
| S I | |||||
| Ca I | |||||
| Ca II | |||||
| Sc II | |||||
| Sc II | |||||
| Sc II | |||||
| Sc II | |||||
| Ti II | |||||
| Ti II | |||||
| Ti II | |||||
| Ti II | |||||
| Ti II | |||||
| Cr I | |||||
| Cr I | |||||
| Mn I | |||||
| Fe I | |||||
| Fe I | |||||
| Fe I | |||||
| Fe I | |||||
| Fe I | |||||
| Fe I | |||||
| Fe I | |||||
| Fe I | |||||
| Fe I | |||||
| Fe I | |||||
| Fe I | |||||
| Fe I | |||||
| Fe I | |||||
| Fe I | |||||
| Fe I | |||||
| Fe I | |||||
| Fe I | |||||
| Fe I | |||||
| Fe I | |||||
| Fe I | |||||
| Fe I | |||||
| Fe I | |||||
| Fe I | |||||
| Fe I | |||||
| Fe I | |||||
| Fe II | |||||
| Fe II | |||||
| Co I | |||||
| Co I | |||||
| Co I | |||||
| Co I | |||||
| Co I | |||||
| Ni I | |||||
| Ni I | |||||
| Ni I | |||||
| Ni I | |||||
| Zn I | |||||
| Zn I | |||||
| Zn I | |||||
| Zn I | |||||
| Sr II | |||||
| Sr II | |||||
| Ba II | |||||
| Eu II |
| (K) | (dyn/cm2) | (dyn/cm2) | (cm2/g) | (g /cm3) | ||
|---|---|---|---|---|---|---|
| El. | Ion | aaSee §4.1 for sources. | [X/H] | [X/Fe] | Notes | ||
|---|---|---|---|---|---|---|---|
| Li | 1 | 2 | 1.10 | ||||
| C | 7.11 | 8.39 | Synth. of | ||||
| C | 6.81 | 8.39 | Synth. of CH-AX | ||||
| N | 4.93 | 7.93 | Synth. of CN, assuming C=7.11 | ||||
| N | 5.22 | 7.93 | Synth. of CN, assuming C=6.81 | ||||
| Na | 1 | 2 | 1.86 | 6.33 | |||
| Mg | 1 | 2 | 2.41 | 7.54 | |||
| Al | 1 | 1 | 6.47 | Å | |||
| Si | 1 | 1 | 7.51 | ||||
| S | 1 | 1 | 7.33 | Å | |||
| Ca | 1 | 1 | 0.99 | 6.36 | |||
| Ca | 2 | 2 | 1.44 | 6.36 | |||
| Sc | 2 | 1 | 3.17 | Å | |||
| Ti | 2 | 5 | 5.02 | ||||
| Cr | 1 | 1 | 5.67 | Å | |||
| Mn | 1 | 1 | 5.39 | Å | |||
| Fe | 1 | 25 | 2.06 | 7.45 | LTE | ||
| Fe | 1 | 2.17 | 7.45 | non-LTE | |||
| Fe | 2 | 1 | 7.45 | Å | |||
| Co | 1 | 1 | 4.92 | Å | |||
| Ni | 1 | 4 | 0.60 | 6.25 | |||
| Zn | 1 | 1 | 4.60 | Å | |||
| Sr | 2 | 1 | 2.97 | Å | |||
| Ba | 2 | 1 | 2.13 | Å | |||
| Eu | 2 | 1 | 0.51 | Å |
| El. | Ion | Notes | |||||
|---|---|---|---|---|---|---|---|
| ( K) | ( dex) | ( km s-1) | ( mÅ) | (dex) | |||
| C | Synth. of | ||||||
| C | Synth. of CH-AX | ||||||
| N | Synth. of CN; C from | ||||||
| N | Synth. of CN; C from CH | ||||||
| Na | 1 | ||||||
| Mg | 1 | ||||||
| Al | 1 | ||||||
| Si | 1 | ||||||
| Ca | 1 | ||||||
| Ca | 2 | ||||||
| Sc | 2 | ||||||
| Ti | 2 | ||||||
| Cr | 1 | ||||||
| Mn | 1 | ||||||
| Fe | 1 | ||||||
| Fe | 2 | ||||||
| Co | 1 | ||||||
| Ni | 1 | ||||||
| Zn | 1 | ||||||
| Sr | 2 | ||||||
| Ba | 2 | ||||||
| Eu | 2 |