Chandra and XMM-Newton Observations of NGC 4214: The Hot Interstellar Medium and the Luminosity Function of Dwarf Starbursts
Abstract
We present results from Chandra and XMM-Newton X-ray observations of NGC 4214, a nearby dwarf starburst galaxy containing several young regions of very active star-formation. Starburst regions are known to be associated with diffuse X-ray emission, and in this case the X-ray emission from the galaxy shows an interesting morphological structure within the galaxy, clearly associated with the central regions of active star-formation. Of the two main regions of star formation in this galaxy, X-ray emission associated with the older is identified whereas little is detected from the younger, providing an insight into the evolutionary process of the formation of superbubbles around young stellar clusters. The spectra of the diffuse emission from the galaxy can be fitted with a two temperature component thermal model with keV and 0.52 keV, and analysis of this emission suggests that NGC 4214 will suffer a blow-out in the future.
The point source population of the galaxy has an X-ray luminosity function with a slope of . This result, together with those for other dwarf starburst galaxies (NGC 4449 and NGC 5253), was added to a sample of luminosity functions for spiral and starburst galaxies. The slope of the luminosity function of dwarf starbursts is seen to be similar to that of their larger counterparts and clearly flatter than those seen in spirals. Further comparisons between the luminosity functions of starbursts and spiral galaxies are also made.
keywords:
ISM: jets and outflows – galaxies: individual: NGC 4214 - galaxies: starburst – X-rays: galaxies.1 Introduction
Hierarchical models of structure formation in the Universe suggest that dwarf galaxies were some of the first objects to be formed (Navarro, Frenk & White, 1995), and hence were amongst the earliest sites of star formation. If dwarf galaxies in the local Universe are analogues of those formed at high redshift then studying the structure and evolution of local dwarf galaxies will be useful in understanding star formation at high redshifts.
When starburst galaxies undergo intense periods of star formation many supernovae occur in a relatively small region of the galaxy. The ejecta from these combine with the winds and ejected material from the massive stars in OB associations and Super Star Clusters (SSCs) in the surrounding area to form a superbubble around the cluster which expands, sweeping up surrounding medium to produce large volumes of hot, shocked gas with K. The simulations of Suchkov et al. (1994) show that X-ray emission from starburst galaxies is most likely to be due to the shocks formed from the interaction between the starburst outflow and the surrounding medium, rather than from the material within the winds. The bubbles of hot gas expand along the steepest density gradient – usually the minor axis of the galaxy, and will eventually expand out of the galaxy’s gravitational potential well. Indeed, H images of starburst galaxies show filaments extending along the minor axis (Marlowe et al. 1995, Lehnert & Heckman 1996b). The low mass and hence small gravitational potential well of dwarf galaxies means that it more likely than in other galaxies for material to escape into the surrounding intergalactic medium and form galactic superwinds. In some models these starburst-driven winds result in enough interstellar medium (ISM) being ejected from the galaxy via galactic superwinds to prevent any further star formation from being able to occur (De Young & Heckman, 1994). Lehnert & Heckman (1996a) find that superwinds are most commonly formed in galaxies which have extreme IR properties, such as high IR luminosities and warm far-IR flux. Dwarf starburst galaxies can therefore play an important role in enriching their surroundings with heavy elements produced during starburst episodes (Ferrara & Tolstoy 2000, Dekel & Silk 1986).
NGC 4214 is a nearby dwarf starburst galaxy with an almost face-on orientation. Using the tip of the red giant branch method the distance to NGC 4214 has been estimated by Maíz-Apellániz, Cieza & MacKenty (2002) as Mpc, and this is the value used throughout this paper. We note that a distance of 2.7Mpc was derived by Drozdovsky et al. (2002) using the same method. A few years ago the galaxy underwent a burst of star formation during which around of the stellar mass of the galaxy was formed (Huchra et al., 1983). Colour magnitude diagrams for the field stars outside the main star-forming regions show evidence for both old and young populations, and are typical for dwarf galaxies. The diagrams are dominated by the “red tangle” – an area of the diagram that contains RGB, AGB and blue-loop stars – which implies that there is an underlying population of old stars (Drozdovsky et al., 2002). The basic properties of NGC 4214 are given in Table 1.
NGC 4214 has been studied at many wavelengths, each of which provide an insight into its structure and composition. These observations appear to be show ambiguous results when considering whether NGC 4214 has undergone a recent interaction with a nearby galaxy. band observations of NGC 4214 show a smooth, symmetric disk (Fanelli et al., 1997). The outer contours of the band emission are regular, which suggest that there is no evidence that the galaxy has undergone a recent merger. NGC 4214 is HI-rich like many other dwarf starbursts. In contrast, observations of HI emission by Allsopp (1979) show an extension towards a nearby irregular galaxy NGC 4190 suggesting a possible tidal interaction between the two galaxies could have triggered the starburst in NGC 4214. Observations in the far ultra-violet (FUV) shows the presence of knots of emission at the centre of the galaxy embedded in diffuse emission (Fanelli et al., 1997). These knots denote the presence of OB associations which have also been observed at optical wavelengths (e.g. Huchra et al. 1983, Leitherer et al. 1996, MacKenty et al. 2000).
More recent observations of NGC 4214 using the Hubble Space Telescope (HST) have shown evidence for a two-stage starburst (MacKenty et al., 2000), producing SSCs and OB associations. These observations show that the galaxy has a complicated morphology and is dominated by two large HII complexes often referred to as the North West (NW) and South East (SE) complexes (these structures are also referred to as NGC 4214-I and NGC 4214-II in the literature as well). In addition many knots of H emission are observed along with structurally varying diffuse gas surrounding the main regions of emission. Recent CO observations (Walter et al., 2001) show three main sites of molecular emission, two of which correspond to the NW and SE complexes, with an additional site at which star formation has yet to commence.
In optical appearance NGC 4214 is similar to other dwarf irregular galaxies, however Maíz-Apellániz et al. (1999) suggest that it has an unusually thin galactic disk with a thickness of around 200pc; outflows from the galaxy extending this by a further 200pc or so. Flatter galaxies preferentially undergo blow-out which is when supernovae explosions blow through the disk of the galaxy, forming a way for gas from subsequent explosions to escape without having much affect on the surrounding gas (De Young & Heckman 1994, Mac Low & Ferrara 1999).
| Parameter | Value | Ref. |
| [2000] | ||
| [2000] | ||
| Distance | 2.94Mpc | 1 |
| 1 arcsec | 855pc | |
| 2 | ||
| Position angle | 42.2∘ | 2 |
| Metallicity | 3 | |
| mB | 10.20 mag | 4 |
| S60μm | 17.9 Jy | 5 |
| S100μm | 29.0 Jy | 5 |
| 9.1 | 6 | |
| SFR | 0.04 | 7 |
References: (1) Maíz-Apellániz et al. (2002); (2) LEDA database (available at http://leda.univ-lyon1.fr); (3) Kobulnicky & Skillman (1996); (4) NED (NASA Extragalactic Database, available at http://nedwww.ipac.caltech.edu); (5) Soifer et al. (1989); (6) see Section 5.1, Table 6 for more details; (7) using the relation from Kennicutt (1998).
The launch of the Chandra Observatory has revolutionised X-ray astronomy, providing an unprecedented spatial resolution of . This resolution enables the identification of point sources down to fainter luminosities than those seen with the previous X-ray telescopes such as ROSAT and Einstein. It is now possible to study the diffuse X-ray emission from galaxies without severe contamination from unresolved point sources, allowing a more accurate definition of its properties. The XMM-Newton telescope launched in 1999 combines both reasonable spatial resolution with very high sensitivity. This allows the temperature and the elemental abundances of hot, diffuse gas to be studied in great detail. The combination of data from both instruments promises a much deeper understanding of starburst galaxies.
Prior to the launch of Chandra and XMM-Newton X-ray data from several dwarf starburst galaxies had been obtained from ROSAT observations (examples of ROSAT data on dwarf starburst galaxies can be found in Stevens & Strickland (1998a) and Stevens & Strickland (1998b)). However, ROSAT lacked both the sensitivity and resolution to be able to disentangle the point source emission from X-ray binaries from the diffuse emission, which severely limits the interpretation of the data.
This analysis of NGC 4214 adds to a small sample of published results from Chandra and XMM-Newton observations of dwarf starbursts. One significant example is the analysis of a Chandra observation of NGC 1569 (Martin, Kobulnicky & Heckman, 2002). With the resolution of Chandra it is possible to study not just the global properties of the X-ray emission but also the properties of different spatial components. Martin et al. (2002) found a strong correlation between the X-ray and H emission, and found a high -element to Iron abundance ratio (/Fe), which is consistent with a large amount of Type II supernova ejecta contribution (Martin et al., 2002). It is concluded from this study that elements can be released from dwarf galaxies into the surrounding intergalactic medium. Further comparison is presented in Section 5.3. In addition to NGC 1569 published data is available from Chandra observations of the dwarf starbursts NGC 4449 (Summers et al., 2003a), NGC 3077 (Ott et al., 2003) and NGC 5253 (Summers et al., 2003b).
In Section 2 we describe the Chandra and XMM-Newton observations of NGC 4214 and the data reduction methods used. In Section 3 the properties of the point sources are analysed, and in Section 4 the properties of the diffuse X-ray emission are investigated. The morphology of this emission is discussed and compared the H emission from the central regions of the galaxy. In Section 5 the luminosity function of NGC 4214 is compared to those of spiral and other starburst galaxies and the properties of the diffuse emission and their implications for the formation of superbubbles are discussed. Finally in Section 6 the main conclusions are summarised.
2 Observations and Analysis
2.1 Chandra Observations
NGC 4214 was observed using the Advanced CCD Imaging Spectrometer (ACIS) instrument on board the Chandra satellite on 22nd October 2001, using the ACIS-S configuration. The observation was a single exposure of 26.4ksec, although cleaning the data left just over 16.5ksec. The entire galaxy is included on the back-illuminated ACIS-S3 chip hence only this chip was used in the analysis. The data reduction was undertaken using Chandra Interactive Analysis of Observations (CIAO) version 2.2.1 software analysis tools111see Chandra data analysis methods, published by the Chandra X-ray Center on http://asc.harvard.edu/ciao/. The level 2 event files were filtered to reject all events with energies outside the range of 0.3–10.0 keV and to include event grades 0,2,3,4 and 6. The background light curve was analysed, and all periods of the observation containing flaring or periods of high background above the level were removed using the lcclean.sl script provided by the Chandra X-ray Center (CXC).
The point sources were located using the wavdetect programme, and spectral analysis was carried out using XSPEC (version 11.2.0). To correct for the low energy quantum efficiency (QE) degradation caused by molecular contamination of the ACIS optical blocking filters (Plucinsky et al., 2003) the CXC supplied corrarf code was used to correct the effective area file. This is dependent on the number of days between the launch date of Chandra and the observation, in this case day 818.
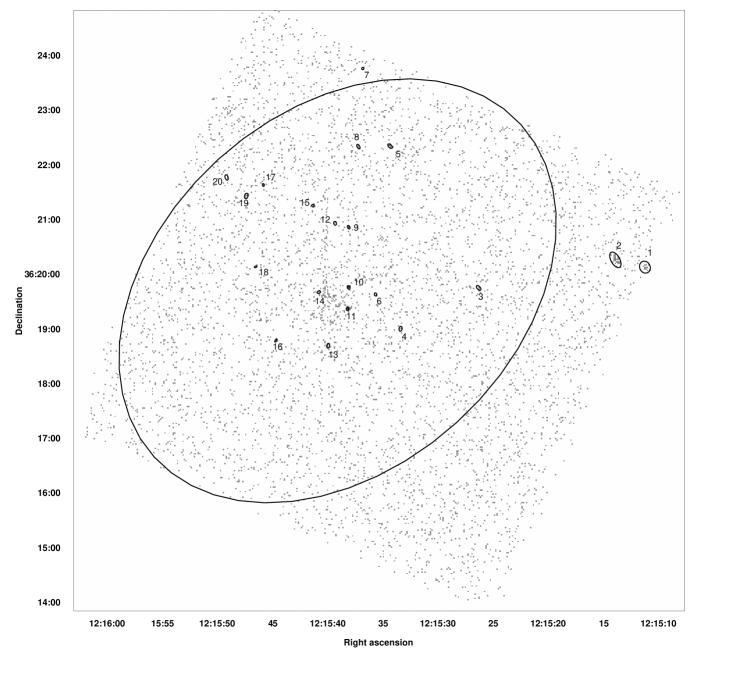
Fig. 1 shows the data from the ACIS-S3 chip of the NGC 4214 field. The ellipse of NGC 4214 has semi-major and semi-minor axes of 4.5′ and 2.8′ respectively, corresponding to an area of square arcminutes. The ellipse is shown in Fig. 1, as are the 20 detected point sources. The detection and analysis of the point sources are discussed in more detail in Section 3, while the diffuse emission associated with the central regions of NGC 4214 is discussed in Section 4.
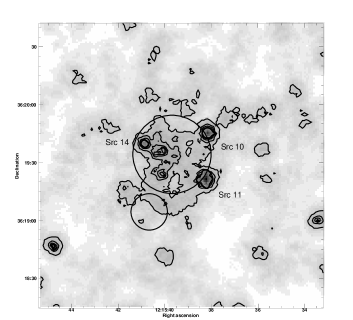
Zooming into the central regions of NGC 4214, Fig. 2 shows the Chandra X-ray data for the central . For this image the data has been binned by a factor of 2 and then adaptively smoothed. This central region contains 3 point sources (Srcs 10, 11 and 14), as well as diffuse emission. The extent of the NW complex, as seen in H emission, is depicted by the large circle in Fig. 2. The smaller blue circle represents the extent of the SE complex of H emission, which does not show as much X-ray emission. The central X-ray emission, and correlations with H emission is discussed in detail in Section 4.2.
2.2 XMM-Newton Observations
The XMM-Newton observation of NGC 4214 was taken on November 22nd – 23rd 2001 for a total duration of 14ksec. The data was analysed using the XMM-Newton Science Analysis System (SAS) version 5.3.3 standard processing analysis. The data from the two MOS cameras and the PN were processed using the the processing chains emchain (MOS) and epchain (PN) to remove both bad pixels and bad events, and the data were checked for periods containing background flaring. After these periods were removed there was around 13ksec of data left for the two MOS cameras, and 12ksec for the PN.
When the Chandra and XMM-Newton observations were compared it was clear that there was a significant positional offset of around 15′′. To investigate the pointing accuracy of the observations sources common to both observations were correlated to sources found in the APM (Automatic Plate Measuring) catalogue222Available at http://www.ast.cam.ac.uk/mike/apmcat/ (including sources found on chips other than the ACIS-S3 chip used in this paper). Two matches were found, and the positions of the sources in the Chandra observation matched those in the APM very well, whereas both of the XMM-Newton sources displayed and offset of around . In addition an archived ROSAT observation shows increased X-ray emission corresponding with the position of the X-ray emission observed by Chandra. Throughout this paper the positions obtained from the Chandra data are adopted, and the XMM-Newton data has been shifted accordingly.
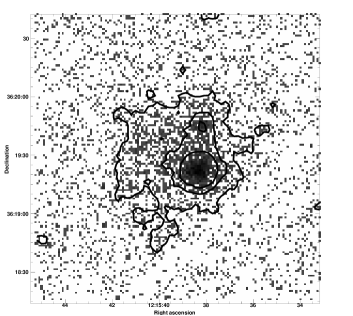
In Fig. 3 we show a mosaiced image from the three XMM-Newton cameras of the central regions of the NGC 4214 field. The diffuse emission seen in the Chandra data is also visible in this observation, and the emission is clearly not symmetric, with an extension to the North East. In the Chandra observation 3 point sources were identified in the central regions of NGC 4214, while in the XMM-Newton data they are much less clearly resolved. Because of the confusion between point sources and diffuse emission in the central regions of NGC 4214 we shall concentrate on the Chandra data for much of the paper.
3 Point Source Analysis
In this section we describe the detection and investigation of the point sources in the NGC 4214 field. The point source detection tool wavdetect was used on the Chandra ACIS-S3 chip, with a detection threshold of (proportional to the inverse of the number of pixels in the image) – this level means that approximately 1 spurious point source detection is expected in the field. Using this method, a total of 20 point sources were found (as shown in Fig. 1) and the positions of these sources are listed in Table 2. Of these sources a total of 17 fall within the ellipse of the galaxy which is depicted as the large ellipse in Fig. 1. Those sources outside the ellipse are Srcs 1, 2 and 7. It is worth noting that the apparent elongated shape of 1 and 2 are due to the shape of the instruments’ PSF towards the edge of the chip.
The point source detection regions generated by wavdetect are output as ellipses which contain 99.7% () of the source counts. For each detection a background region was defined as an annulus centred on the source with an inner radius just larger than the maximum axis of the detection ellipse and an outer radius 3 pixels larger than this. Local background regions are useful as they allow for any local diffuse emission on which the point source emission is superimposed to be taken into account. The background subtracted counts of the sources are also listed in Table 2.
| RA (h m s) | Dec (o ′ ′′) | net counts | Soft band | Medium band | Hard band | Flux | |
|---|---|---|---|---|---|---|---|
| Source | J2000 | J2000 | ( error) | ( error) | ( error) | ( error) | erg cm-2s-1 |
| 0.3–8.0 keV | 0.3–0.8 keV | 0.8–2.0 keV | 2.0–8.0 keV | 0.3–8.0 keV | |||
| 1a | 12:15:11.17 | 36:20:07.0 | 27.05.2 | 6.02.5 | 9.03.0 | 12.03.5 | |
| 2a,b | 12:15:13.93 | 36:20:15.0 | 63.78.6 | 2.3 | 31.05.6 | 34.66.2 | |
| 3 | 12:15:26.35 | 36:19:44.5 | 10.63.4 | 5.62.5 | 4.02.0 | 1.01.0 | |
| 4 | 12:15:33.44 | 36:18:59.7 | 10.03.2 | 4.02.0 | 6.02.5 | – | |
| 5 | 12:15:34.38 | 36:22:20.0 | 35.66.0 | 3.01.7 | 18.64.4 | 14.03.7 | |
| 6 | 12:15:35.71 | 36:19:37.3 | 6.72.7 | 6.72.7 | – | – | |
| 7a | 12:15:36.86 | 36:23:45.2 | 3.01.7 | – | 2.01.4 | 1.01.0 | |
| 8 | 12:15:37.26 | 36:22:19.6 | 15.64.0 | 5.02.2 | 11.03.3 | 0.4 | |
| 9 | 12:15:38.15 | 36:20:51.2 | 19.74.5 | 1.01.0 | 15.74.0 | 3.01.7 | |
| 10b | 12:15:38.16 | 36:19:45.1 | 70.08.5 | 11.33.5 | 45.76.8 | 13.03.6 | |
| 11b | 12:15:38.25 | 36:19:21.4 | 547.823.5 | 94.49.8 | 308.717.7 | 144.712.1 | |
| 12 | 12:15:39.39 | 36:20:55.4 | 8.63.0 | 5.62.5 | 3.01.7 | – | |
| 13 | 12:15:40.01 | 36:18:41.1 | 8.63.0 | 5.02.2 | 2.01.4 | 1.61.5 | |
| 14 | 12:15:40.86 | 36:19:39.9 | 15.84.2 | 1.01.0 | 9.83.4 | 5.02.2 | |
| 15b | 12:15:41.40 | 36:21:14.7 | 151.112.3 | 26.55.2 | 86.09.3 | 38.56.3 | |
| 16 | 12:15:44.76 | 36:18:46.8 | 10.63.3 | 1.01.0 | 2.81.7 | 6.82.7 | |
| 17 | 12:15:45.90 | 36:21:37.5 | 7.82.8 | – | 5.82.5 | 2.01.4 | |
| 18 | 12:15:46.61 | 36:20:07.8 | 10.03.2 | 10.03.2 | – | – | |
| 19 | 12:15:47.46 | 36:21:25.4 | 11.03.3 | 4.02.0 | 4.02.0 | 3.01.7 | |
| 20 | 12:15:49.24 | 36:21:45.7 | 11.63.5 | 1.01.0 | 1.61.5 | 9.03.0 |
For all of the detected point sources, the detected counts were extracted for four different energy bands; firstly over the whole energy range (0.3–8.0 keV), then in a soft (S) band (0.3–0.8 keV) a medium (M) band (0.8–2.0 keV) and finally a hard (H) band (2.0–8.0 keV). Background counts were taken from the background annulus corresponding to each source for each band, and were subtracted from the total. The background subtracted values for each band are shown in Table 2. For two sources, namely Srcs 2 and 8, there is a negative number of counts in one of the energy bands due to the poor statistics.
Just 4 sources have counts; Srcs 2, 10, 11 and 15. This is sufficient for a spectral fit to be made, and these sources are discussed further in Section 3.2. For the remaining 16 sources the Portable, Interactive Multi-Mission Simulator, PIMMS333Available at http://asc.harvard.edu/toolkit/pimms.jsp, was used to predict a flux assuming the exponent of the power law component =1.8 and a column density, , equal to the Galactic value of .
We find that the luminosity lower-limit for a reliable detection in the Chandra observation, assuming that the source is at the distance of NGC 4214, is erg s-1.
Comparing the point sources in the NGC 4214 observation with the results from the Chandra Deep Field-South observation reported on by Rosati et al. (2002), we expect on average of the sources seen in this observation to be background objects and of the sources within the NGC 4214 ellipse to be background objects. This suggests that the majority of sources detected in this observation are associated with NGC 4214.
3.1 Hardness Ratios
Most of the sources detected in this observation are very faint; there are only two sources with counts and just two more with . However, for faint sources it is possible to derive some spectral information using hardness ratios. Hardness ratios provide information about both the absorption and the temperature of point sources. For data of sufficient quality it is possible to use a hardness ratio plot to distinguish between different classes of sources such as supernova remnants, supersoft sources, X-ray binaries and AGN; Prestwich et al. (2003) describe the classification of sources using this method.
The counts in the S, M and H bands were used to calculate 2 hardness ratios using (HM)/(H+M) and (MS)/(M+S) (Summers et al., 2003a). Fig. 4 shows the hardness ratio plot. Two sources had no counts in 2 of the energy bands, and hence are not included in the plot; neither were the two sources for which negative values were found in one of the energy bands.
PIMMS was used to predict colours for point sources with both thermal bremsstrahlung and power law models, with varying and respectively. In addition, models have been calculated with both Galactic absorption, (), and with the column density derived from a spectral fit of the X-ray emission from the entire ellipse of NGC 4214 (). The details and further parameters obtained from this fit are discussed in Section 5.2. The theoretical tracks produced by these results are also shown in Fig. 4.
There is no real correlation seen between the two hardness ratios. There appear to be two distinct groups of sources; those with the smallest errors correspond to the sources with the largest number of counts and fall in the same region of the diagram. These points all fall to the right of the track obtained using the higher absorption component implying that is a lower limit on the value of absorption for each source. None of the sources within the ellipse are dominated by counts in the hard band, and there are 4 sources that have no counts in the hard band at all. This information agrees with the previous assertions that the majority of the point sources observed are associated with the galaxy and are not objects such as background quasars.

3.2 Individual Point Sources
Four sources (Srcs 2, 10, 11 and 15) have counts, and these were fitted individually using a power law model with an absorption component frozen at the Galactic value of and with a further absorption component allowed to fit freely. The spectra were grouped so that there were a minimum of 5 counts in each bin, with a minimum of 10 for Src 11. Srcs 2 and 10 do not have sufficient counts to allow the power law component to fit freely, and hence it was frozen at a value of . In the analysis of sources 11 and 15 this parameter was allowed to vary freely. The results of the spectral fits are shown in Table 3.
| Source | ) | /d.o.f. | ||
|---|---|---|---|---|
| 2 | 1.8(frz) | 0.57/10 | ||
| 10 | 1.8(frz) | 1.12/10 | ||
| 11 | 1.8 | 0.8/44 | ||
| 15 | 1.4 | 1.2/24 |
Cross-correlating with the APM catalogue 1 optical source was found to correspond to an X-ray detection. It corresponds to Src 15, at a separation of in RA and in Dec. The position of the optical source was at , , compared to , for Src 15.
Src 10 corresponds to the position of a weak H source observed by MacKenty et al. (2000) (denoted as NGC 4214-IIIs in that paper). A source at this position was also observed by Fanelli et al. (1997) in an band image of the galaxy, but not in the FUV. It is likely that this source is at the dynamical centre of the galaxy, a view supported by the HI observations of McIntyre (1998) which place the rotational centre of the galaxy close to the position of Src 10.
For a comparison, Grimm, Gilfanov & Sunyaev (2003) suggest that the number of high mass X-ray binaries present in a galaxy is proportional to the star formation rate, and use data from a number of galaxies to derive the following relation between the number of bright X-ray sources (those with ) and the SFR of the galaxy:
| (1) |
Using the current SFR of calculated by Thronson et al. (1988) it is predicted that in NGC 4214 there should be between 1 and 3 sources with . We detect one such source in this observation, Src 11. While many ultraluminous X-ray sources (ULXs), which typically have X-ray luminosities of – erg s-1 have been observed in other star-forming galaxies (e.g. the Antennae; see Zezas et al. 2002), none are detected in NGC 4214.
3.3 The Luminosity Function
Since the launch of Chandra it has been possible to study the X-ray point source populations in nearby galaxies in great detail. Studying the luminosity function of a galaxy provides an insight into its star formation history, and the luminosity functions of different types of galaxy can be compared to look for common trends. The point sources observed in NGC 4214 are most likely X-ray binaries. An X-ray binary remains active for a time which is dependent on the lifetime of its companion star. In the case of a high mass X-ray binary (HMXB) the companion is an OB star with a lifetime of around years, however the low mass companions of low mass X-ray binaries (LMXBs) usually have a longer lifetime, and so LMXBs remain active for a longer period but at a lower luminosity than HMXBs (Wu, 2001). Luminosity functions for objects with a substantial young population, such as starburst galaxies, will be dominated by the HMXBs with no significant contribution from LMXBs, however as the HMXBs reach the end of their X-ray activity the LMXBs will start to dominate (Kilgard et al., 2002). Any HMXBs observed must be relatively young objects, and will have formed during the central starburst of NGC 4214. LMXBs have a lower luminosity limit of erg s-1 (Schulz 1999, Hertz & Grindlay 1983), which is roughly the detection limit of this observation, but although some of the fainter X-ray sources could be LMXBs, due to the relatively short period since the starburst it is likely that the point source population is dominated by HMXBs.
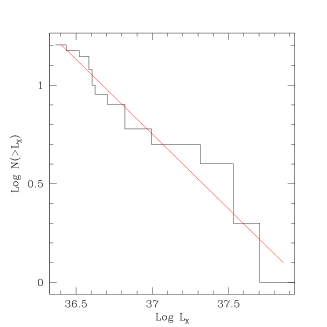
As discussed in Section 3, the predicted fluxes for the 17 point sources within the ellipse of the galaxy were obtained by assuming a power law model with an exponent of , assuming that they are all at the distance of NGC 4214. Figure 5 shows the plot for these sources. The data are best fitted with a power law with a slope of . It can be seen that below a luminosity of the data appear to be flatter than the fitted slope – this is likely due to an incompleteness in the detection of the point sources due to the limits of the instrument. The luminosity function of NGC 4214 in comparison to those of other galaxies is discussed further in Section 5.1.
4 Diffuse Emission
The faint diffuse emission from NGC 4214 can be seen in the centre of the Chandra image shown in Fig. 1. It is clear that the diffuse emission comes from a region far smaller than the ellipse, as was shown in the blow-up of the central region in Fig. 2.
The X-ray contours in Fig. 2 show that there is a bright ring of emission with a diameter of very roughly (510pc). In addition, three point sources close to the edge of the ring can be seen. The diffuse emission from the galaxy can be seen to a greater extent in the XMM-Newton image (Fig. 3); in fact the radius of this emission is around , almost twice that than detected by Chandra. However the spatial resolution is not good enough to clearly distinguish the point sources observed with Chandra from the rest of the central diffuse emission. Although the detection limit of the Chandra observation is similar to the lower luminosity limit of LMXBs it is possible that if several sources are present within a small area, for example in a cluster or association, they will not be distinguishable as separate individual sources and their emission is likely to contaminate that of the observed diffuse emission.
4.1 X-ray Analysis
The X-ray spectrum of the diffuse emission of NGC 4214 from the Chandra observation was extracted using standard CIAO software, in an energy range of 0.3–8.0 keV, excluding the three point sources from the analysis. The background used was from the blank-sky background files associated with the data set – this allowed the background to be taken from the same position in the instrument as the source emission. The region used for extraction was an ellipse with axes of and (pc) chosen to encompass the diffuse emission.
The diffuse emission spectrum contains 470 counts and was fitted with several different models in an attempt to obtain the best fit, each with a component, , due to Galactic absorption fixed at .
The model which provided the best fit to the data was which consists of two absorbed thermal components (the components model the emission spectrum from hot gas and include line emission from several elements) and a power law component to account for any unresolved point sources. The statistics of the fit give a reduced of 0.77 for 33 degrees of freedom. The two thermal components both have absorptions of cm-2 and temperatures of 0.14 keV and 0.52 keV respectively, with the power law component having a photon index of . The unabsorbed flux of the diffuse emission is erg s-1cm-2 (0.3–8.0 keV), which corresponds to an unabsorbed luminosity of erg s-1 (non-absorption corrected erg s-1). Of this emission around % was due to the softer component, % to the harder and % to the power law component. The errors on these percentage contributions show that while there is a degree of uncertainty as to the percentage contribution of the softer and harder thermal components, the division of the emission between the combination of the two thermal components and the power law component appears to be fairly well constrained.
The parameters of the fit, together with the errors at the confidence level (1.64) are shown in Table 4. It is noted that if the abundances are allowed to vary (as opposed to being frozen at solar) unphysical values from the fit are obtained - this is most likely due to there being too many free parameters for values to be constrained.
The spectral response of the ACIS CCDs is known to vary over time due to both the evolution of the electronic gain of the CCDs, and the variance of their charge transfer inefficiency (CTI). A correction for the time dependence of the gain of the ACIS chips using the tool 444contributed CXC software, see http://asc.harvard.edu/cont-soft/software/corr_tgain.1.0.html, was applied to the data. When the data were reanalysed with this correction it was seen that the values of the absorption and temperature components changed very little, although the slope of the power law component of the spectrum fitted to the diffuse emission became flatter. The effect of this correction was small, and is not yet an official CXC product, so as such the results presented here and used for further analysis are those from the uncorrected data.


Concerning the XMM-Newton data, although XMM-Newton is more sensitive than Chandra it is hampered by the fact that its spatial resolution is poorer. From the Chandra analysis it is known that there are three point sources (Srcs 10, 11 and 14) amongst the diffuse emission in the centre of the galaxy, and these could be excluded from the Chandra analysis. However, in the XMM-Newton observation these cannot be distinguished from the diffuse emission with sufficient accuracy to allow them to be excluded without removing significant parts of the diffuse emission as well. To take into account these 3 sources an additional absorbed power law component with values frozen at cm-2 and was included in the models (the values used were based on those obtained from the fits to Srcs 10 and 11 – see Table 3). The spectra were again fitted with a model, with the additional component to take into account the central point sources included. It was found that the spectra from the two MOS cameras showed good agreement with the results obtained from Chandra; however, when the results from the PN were included a fit with unphysical values was obtained. The discrepancy between the different cameras is most probably due to the differences in calibration between them. The fits were thus carried out using the MOS cameras only.
The fit to the XMM-Newton data gives two absorption components of cm-2 and cm-2, a temperature for the softer component of keV and for the harder of keV and a power law component with a photon index of . The results of the fit, together with the errors on the fitted values are given in Table 4. The unabsorbed luminosity was found to be erg s-1, higher than that obtained from the Chandra fit which is to be expected due to the inclusion of point source emission. Indeed, when the calculated contribution of Srcs 10, 11 and 14 is subtracted from this value a luminosity of erg s-1 is obtained which is in better agreement with that from the Chandra observation. The contribution of the various components to this emission was found to be for the cold component, for the hot, due to the power law component, and due to the Chandra sources 10, 11 an 14. The results from the XMM-Newton data appear to broadly confirm those obtained from Chandra.
| Chandra Data | XMM-Newton Data | |
| () | 0.19 | 0.17 |
| (keV) | 0.14 | 0.23 |
| () | 0.19 | 0.85 |
| (keV) | 0.52 | 0.59 |
| 1.56 | 1.93 | |
| /d.o.f. | 0.77/31 | 1.11/40 |
| () |
By making some basic assumptions it is possible to calculate additional parameters of the gas components of NGC 4214. The following calculations were carried out using the results obtained from the Chandra analysis. Maíz-Apellániz et al. (1999) suggest that NGC 4214, which we are observing face on, has an unusually thin disk with a total height of around 200pc extended by outflows by perhaps a further 200pc. As such a cylindrical geometry for the galaxy is assumed with a thickness of 200pc and a diameter of (510pc) which corresponds to that of the observed emitting region.
The mass of the emitting gas can be calculated from the normalisations of the model components. The normalisation, is given by
| (2) |
where Mpc, is the volume of the emitting region, and and are the number densities of electrons and hydrogen ions respectively. We assume that the gas is fully ionised (). The total mass of the emitting gas is M⊙ with the two thermal components and one power law component contributing M⊙, M⊙ and M⊙ respectively. We note the dependence on , the volume filling factor of the X-ray emitting material – see Strickland & Stevens (2000) for a discussion of its properties. We make no assumptions about th value of , but Strickland & Stevens (2000) find that it could be quite low () for soft emission; if this is the case both the mass and energy content of the gas are reduced.
Further parameters of the emitting gas can be calculated by making some basic assumptions about its properties. Using the emission integral, , from Equation 2, ((), the electron density can be calculated using , assuming the emitting volume, , calculated previously. The dynamical pressure, , of the gas is obtained using , and the thermal energy, , of the gas from . Finally the cooling time, , of the gas is calculated using where . The results of these calculations for the two components of the gas are shown in Table 5.
| Emission | Softer | Harder |
|---|---|---|
| component | component | |
| (keV) | 0.14 | 0.52 |
| (K) | 1.62 | 6.04 |
| () | 2.48 | 5.57 |
| () | 0.10 | 0.03 |
| (erg) | 1.44 | 1.61 |
| () | 1.82 | 5.50 |
| (dyn ) | ||
| (yr)) | 1.86 | 9.32 |
4.2 Comparison with Optical Observations
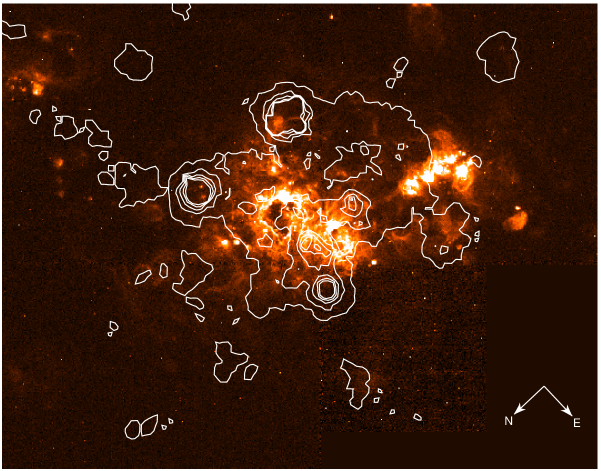
As has been noted before, excluding the point sources, the bulk of the X-ray emission from NGC 4214 comes from the central regions of the galaxy. The centroid of the X-ray emission (located at , , see Fig. 2) coincides with the NW star-formation complex, marked out by H emission, observed by MacKenty et al. (2000).
Fig. 8 shows the H emission from NGC 4214 observed by MacKenty et al. (2000) with the X-ray contours from the Chandra data overlaid. This image shows clearly that there is more X-ray emission associated with the NW star-forming complex than with the SE complex. This is perhaps to be expected as the NW complex is the more evolved and more massive of the two, hence it contains more supernovae, and any superbubble will have had more time to develop. Although the bulk of the X-ray emission is centred around the point sources in the NW complex there is emission extending away in a southerly direction which gives the impression of having a ring-like shape. This emission is most likely solely due to the ongoing star formation in the NW complex, with the shocked gas from stellar winds and supernovae preferentially expanding into regions of the ISM with lower ambient density. The geometry of the emission is somewhat reminiscent to that of a so-called ‘champagne phase’ (see Yorke 1986 for a review). There is little X-ray emission corresponding with the position of the SE complex, which is further conformation that this is the younger of the two star formation regions. It appears that substantial superbubbles have not yet had time to form, and hence the region is likely not yet able to inject significant energy into the surrounding medium.
Src 10 corresponds to the position of a star cluster believed to be the dynamical centre of the galaxy (as discussed in more detail in Section 3.2). A young SSC, of age , has been identified in optical images at , (Leitherer et al. 1996, MacKenty et al. 2000), and it appears to reside in an H cavity. At this position there is increased emission in the X-ray suggesting the presence of cluster type emission.
5 Discussion
5.1 Point Sources
The luminosity functions of galaxies can now be studied in great detail due to the fact that Chandra is able to detect many individual X-ray point sources within the galaxies. The slope of the luminosity function can be used as an indicator of some of the general properties of the host galaxy. A recent study of 32 nearby spiral and elliptical galaxies by Colbert et al. (2003) shows a clear distinction between the slopes of the luminosity functions of these two types of galaxies, with those of the spiral galaxies being much steeper than those of the ellipticals.
In those galaxies where a large number of point sources has been observed the luminosity functions are often fitted with power laws, for example NGC 4449 (Summers et al., 2003a), NGC 5253 (Summers et al., 2003b), M31 (Supper et al., 1997), and M81 (Tennant et al., 2001).
If a continuous uniform star formation process occurs then the luminosity function of the sources should appear as unbroken, but when a starburst is triggered new HMXBs will be formed which will appear as a break in the function. It is therefore not unlikely that a break in the luminosity function will be present in all starburst galaxies, the position of which will decrease in luminosity with time, perhaps providing an indicator to the time of previous bursts in the galaxy. It is possible that no break is seen in NGC 4214 due to the limited statistics and the small number of point sources observed; if there is contamination of the luminosity function by LMXBs these could mask a break in the HMXB population when there is such a small sample being considered.
The results for the X-ray luminosity function presented here for NGC 4214 can be combined with those of other dwarf starbursts and then further compared with results from a wider sample of galaxies for a range of parameters (for example Kilgard et al. 2002, see below). The relevant parameters (and sources) for each galaxy used in this study are shown in Table 6.
The blue luminosity was calculated using Tully (1988)
Kilgard et al. (2002) examined the point source luminosity functions of 7 galaxies; 4 spirals and 3 starbursts. The 3 ‘normal’ starbursts, M82, NGC 253 and the Antennae (NGC 4038/9), have flatter luminosity functions than the spirals, with slopes of 0.50, 0.81 and 0.53 respectively compared to a range of to for the spirals (see Table 6). We supplement this sample with results for the dwarf starbursts galaxies NGC 4449 (Summers et al., 2003a), NGC 5253 (Summers et al., 2003b) and NGC 4214 (this paper).
The far infrared luminosity of a galaxy can be used as an indication of a young stellar population and of its current rate of star formation (Kennicutt, 1998). Thus, if the luminosity function slope is dependent on the rate of star formation, then we might expect a correlation between the luminosity function slope and . Fig. 9 shows the luminosity function slope plotted versus , and it is obvious that the starburst galaxies have a flatter slope than the 4 normal spiral galaxies, suggesting that the higher the star formation rate the flatter the luminosity distribution. This is probably due to the fact that there is a larger proportion of young bright sources (e.g. HMXBs) in star-bursting regions than is present in spiral galaxies (Wu, 2001). However, the dwarf starbursts also have lower luminosity function slopes, but because the dwarf starburst galaxies have values comparable to the spirals there is no clear segregation on the basis of .
A clearer segregation can be seen in Fig. 10, which shows the X-ray luminosity function slope plotted against the ratio of the 60m () to 100m () flux for the spiral and starburst galaxies. Lehnert & Heckman (1996a) state that if then it is more likely that a galactic superwind will occur. As is clear from Fig. 10, this criterion is satisfied for all the starburst galaxies in the sample. A superwind is indeed observed in both M82 (e.g. Strickland et al. 1997, Lehnert et al. 1999) and NGC 253 (e.g.Strickland et al. 2000). In NGC 5253 multiple superbubbles are observed in the X-ray (Strickland & Stevens, 1999) and H filaments are seen extending away from the galaxy (Marlowe et al., 1995). From NGC 4449 both X-ray (Summers et al., 2003a) and H (Marlowe et al., 1995) emission from a superbubble is observed, but a large HI halo surrounding the galaxy may prevent the escape of material into the surrounding intergalactic medium. Using the Chandra X-ray data it has been calculated that NGC 4214 is likely to undergo a blow-out; this is discussed in more detail in Section 5.3. As the Antennae are two merging galaxies as yet no superwind has formed due to the disruption from the ongoing interaction.
Fig. 11 shows the luminosity function slope against the 60m flux scaled to the area of the ellipse as a measure of the star formation rate per unit area. Unsurprisingly, this tends to be higher for the starburst galaxies than for the spirals (with the exception of M83), and again we see a segregation in luminosity function slope with star-forming activity. M83 has been classified as a nuclear starburst galaxy, and HST observations show a large number of young, massive clusters in the nuclear region (Harris et al., 2001). Kilgard et al. (2002) state that most of the detected point sources used in the analysis of the luminosity function of M83 are from regions outside the central star-bursting region. The fact that only the disk population is analysed means that it can be grouped with the other spirals in the sample when considering the luminosity function slope. However, other values such as the optical luminosity () and the far infrared luminosity () will have this central region included which will affect the results. Indeed, inspection of the 60m IRAS image of M83 shows a large variation of emission across the galaxy, with the highest contribution coming from the centre. For analysis purposes, however, the flux from the entire galaxy was used. This explains why M83 seems to agree with the properties of spirals in respect to the luminosity function, but for other properties relating to the whole galaxy it is more similar to what is seen in the starbursts. The luminosity function of M82, another starburst galaxy with localised star formation, contains point sources from the entire galaxy including the regions of star formation. Unlike M83 the luminosity function slope of M82 shows agreement with those of the other starburst galaxies.
Typically scales with for normal galaxies, but in strong starbursts is seen to increase more rapidly than . Fig. 12 shows the slope of the luminosity function plotted against . In general, the starburst galaxies in the sample have a higher ratio, which is to be expected, but if we exclude M83 again there is still evidence of a change in luminosity function slopes at a value of . M83 has the highest ratio of the spiral sample; this could again be due to the fact that it has had some recent star formation.
We note in passing that we can compare the total number of sources in each galaxy with (a luminosity level which provides a compromise in that sources this faint are detected in more distant and massive galaxies such as the Antennae and sources this bright are detected in smaller and nearby dwarfs such as NGC 4214 and NGC 5253). If we plot this number against then we find a linear correlation with on average X-ray sources with erg s-1 for each in .
| Distance | LF slope | 60m flux | 100m flux | area | ||||
|---|---|---|---|---|---|---|---|---|
| Galaxy | (Mpc) | (Jy) | (Jy) | (erg s-1) | (erg s-1) | (arcmin2) | ||
| NGC 4214 | 2.9 | 0.70 | 17.9a | 29.0a | 0.62 | 41.96 | 42.62 | 29.2 |
| NGC 4449 | 2.9 | 0.51 | 36.0b | 73.0b | 0.49 | 42.30 | 42.72 | 5.3 |
| NGC 5253 | 3.2 | 0.54 | 10.5c | 29.4c | 1.04 | 41.90 | 42.43 | 3.3 |
| M82 | 5.2 | 0.50 | 1313.5a | 1355.4a | 0.97 | 44.26 | 43.49 | 4.0 |
| NGC 253 | 3.0 | 0.81 | 931.7a | 1861.7d | 0.50 | 43.73 | 43.52 | 31.1 |
| Antennae | 25.5 | 0.51 | 48.7a | 82.0a | 0.59 | 44.28 | 44.15 | 12.6 |
| NGC 1291 | 8.6 | 1.07 | 1.8d | 10.1d | 0.17 | 42.18 | 43.89 | 70.3 |
| M83 | 4.7 | 1.38 | 266.0d | 638.6d | 0.42 | 43.61 | 43.84 | 110.8 |
| NGC 3184 | 8.7 | 1.11 | 8.9a | 29.0a | 0.31 | 42.74 | 43.51 | 32.0 |
| IC 5332 | 8.4 | 1.30 | 0.8c | 5.1c | 0.16 | 41.85 | 43.12 | 25.3 |


It is worth noting that NGC 4214 was analysed with a correction for the low energy quantum efficiency degradation of Chandra (see Section 2.1), which gave slightly different values than when it was analysed without this correction. The rest of the data was obtained from previously published material which was analysed before the correction was available and it is not known how much this will have affected the validity of the results. However, this problem is getting worse with time and will therefore have had less of an effect on observations such as these which were taken early in Chandra’s lifetime, and so it is assumed that it is still valid to compare the results obtained.
5.2 Star Formation Rate of NGC 4214
Ranalli, Comastri & Setti (2003) propose that the X-ray luminosities of star-forming galaxies can be used as an indication of the SFR of the galaxy. They derive the following relation between the 2-10 keV X-ray luminosity and the SFR:
| (5) |
The spectrum of the total X-ray emission within the ellipse of the galaxy was extracted from the Chandra data and fitted with an absorbed thermal component plus power law model within XSPEC. The absorbing column density was divided into 2 components, with one frozen at the Galactic column density and the other allowed to fit. The exponent of the power law component was frozen at a value of to take into account the point sources emission. The fitted column for the additional absorbing component, local to NGC 4214, was found to be , giving a total column of . This basic spectral analysis provided an unabsorbed 2–10 keV X-ray luminosity of . When combined with the relation from Ranalli et al. (2003) this gives a value of 0.07 for the SFR of NGC 4214.
Kennicutt (1998) derives the following relation between SFR and the FIR luminosity in a galaxy:
| (6) |
Using a value of (estimated using Eqn. 4) the Kennicutt relation gives a SFR of 0.04, in good agreement with the value obtained using the X-ray properties of the galaxy.
5.3 Diffuse X-ray Emission and IR Properties
In this observation we have been able to resolve point sources and diffuse emission in the central regions of NGC 4214. This in turn enables us to reliably estimate, for the first time, the energy present in the ISM and ultimately whether we expect an outflow from NGC 4214.
Metals and gas are potentially ejected from dwarf starburst galaxies into the surrounding intergalactic medium, powered by the strong stellar winds from OB stars, and then after Myr predominantly by the energy injected by supernovae, which adds to the mass loss from the galaxy. Indeed, observations of NGC 1569 (Martin et al., 2002) show that the diffuse X-ray emitting gas has a supersolar /Fe ratio. These results suggest that the hot diffuse gas has been enriched by the ejecta of explosions Type II supernovae injecting heavy elements into the surrounding medium. The winds from the stars and supernovae in clusters and stellar associations will combine, sweeping up the surrounding interstellar medium, creating a superbubble of hot, X-ray emitting gas. Surrounding the superbubble will be a cooler shell of material which emits H line emission. If instabilities within the bubble occur they can cause the shell to rupture, allowing gas to escape in the form of a superwind.
Weaver et al. (1977) model bubbles for single stars, and these results are often used to model the formation of bubbles around clusters and associations that contain many massive stars. However, this model must be used with caution. In the case of NGC 4214 there are several separate superbubbles that have been observed, which correspond to the different clusters and associations at the centre of the galaxy. MacKenty et al. (2000) observe bubbles around the star forming regions in the NW complex that are around 30% smaller than expected using the Weaver et al. (1977) model, and conclude that the model cannot be applied in this case. Summers, Stevens & Strickland (2001) find that the predicted expansion velocity for the dwarf starburst galaxy Markarian 33 from using the Weaver model is less than that observed.
In their observations of NGC 4214 Maíz-Apellániz et al. (1999) observe no bubbles surrounding the three star clusters in the SE complex. They suggest that observations of the SE complex do not agree with a blow-out having occurred, and that despite the Weaver model predicting that there should be a superbubble with R70pc and 14 km s-1 it is likely that a superbubble does not actually exist. MacKenty et al. (2000) suggest that there is a delay in the formation of a superbubble in clusters of about 2 Myr due to the time it takes for the high number of individual stellar bubbles produced to combine and break out of the surrounding medium. If this is indeed the case it would explain why X-ray emission is seen to predominantly coincide with the position of the somewhat older NW complex, where cluster superbubbles have had time to form, but not with the SE complex where there is a lack of shocked, hot gas. The time delay in the formation of these clusters could have an impact on estimations of the amount of energy released by the galaxy (Maíz-Apellániz et al., 1999). The mechanical energy could be dissipated via the heating of interstellar gas, which would lead to an overestimation of the energy released, as would the fact that stellar synthesis models assume that the massive stars would appear earlier than is in fact the case.
Mac Low & McCray (1988) derive the following criteria for whether a blow-out from a galaxy is to be expected:
| (7) |
where is the mechanical energy luminosity in units of erg s-1, is the scale height of the galaxy in kpc, is the initial pressure of the ISM in units of and is the initial density of the ISM. is a measure of the rate of kinetic energy injection, and if then a blow-out will occur. From Table 5, the total thermal content of the X-ray emitting gas is around 3.1erg s-1. Assuming that the observed diffuse X-ray emission comes from the most recent burst of star-formation associated with the NW complex, with an age of Myr (MacKenty et al., 2000), we estimate that erg s-1. The initial pressure of the ISM is assumed to be equal to that of the Milky Way, i.e. . For plausible values of the initial gas density (such as the initial density being greater than the current derived densities in Table 5, cf Summers et al. 2003a) for and a blow-out to occur then we require kpc. Obviously the derived upper limit for the scale height necessary for a blow-out to occur is very weakly dependent on the assumed value of . The assumed pressure is comparable to that of Mac Low & Ferrara (1999) who assume . Indeed, if the lower value of Mac Low & Ferrara (1999) is used it makes little difference to the result (kpc). The estimated value of is significantly larger than the optically observed dimensions of the galactic disk (Maíz-Apellániz et al., 1999), and as such we conclude that in this galaxy a blow-out from the disk ISM is likely to occur.
We note that Wilcots & Thurow (2001) calculate to be , a factor of ten smaller than the value obtained from our analysis. However, if is indeed a factor of ten smaller this will reduce the scale height by a factor of , which will still be larger than the observed size of the optical disk.
Lehnert & Heckman (1996a) have studied a large sample of starburst galaxies, looking at which properties make them conducive to galactic superwinds being formed, and find that those galaxies with extreme IR properties are far more likely to have a superwind present. One of the criteria is that the galaxy has a ratio of ; NGC 4214 has a value of 0.62, implying that a superwind is a possibility. However, NGC 4214 fails to meet the other two criteria; that and . These results appear to suggest that there is not a high chance of this galaxy forming and supporting a galactic superwind, however it should be noted that the galaxies used by Lehnert & Heckman (1996a) to derive these criteria were mainly spiral galaxies, and as such the results may not be quite so relevant for a dwarf starburst such as NGC 4214.
In the sample of 9 galaxies used in this to study the properties of luminosity functions of starbursts, all of the starbursts have (note that NGC 4449 has a value of 0.49). However, with the exception of M82, with , none meet the other criteria for the formation of a superwind to be likely.
6 Summary and Conclusions
We have presented the results from both Chandra and XMM-Newton observations of NGC 4214, which show the diffuse X-ray emission from this dwarf starburst galaxy. The high spatial resolution of Chandra has allowed the detailed structure of the X-ray emission of NGC 4214 to be observed for the first time. 17 point sources were observed within the ellipse of the galaxy, and further analysis of these suggest that the majority are HMXBs associated with the galaxy as opposed to being background AGN.
The luminosity function of the point sources is similar to those seen in other starbursts such as NGC 5253 and NGC 4449. Indeed, when combined with those of NGC 4449 and NGC 5253 and added to the sample of Kilgard et al. (2002) this data strengthens the argument that the luminosity functions of starburst galaxies are flatter than those seen in normal spirals, and indeed extends this result to include dwarf starburst galaxies. It is seen that the starburst galaxies tend to have a higher 60m to 100m flux ratio than spirals, a criteria for being more likely to produce a galactic superwind (Lehnert & Heckman, 1996a). However, there is no clear segregation between the spirals and the starbursts when the luminosity function slopes are compared to the ratio of . Lehnert & Heckman (1996a) state that for a superwind to form a large excess of IR luminosities is needed, and although this criteria is not met in our sample overall the starbursts show a larger ratio than the spirals, as would be expected. In general the starbursts have a larger amount of star formation per unit area (using the ellipse area as a scaling parameter).
The diffuse emission from the galaxy is observed in both the Chandra and XMM-Newton observation, and is seen to almost twice the extension in XMM-Newton (radius ) than in Chandra. The data suggest the presence of gas at two separate temperatures, with Chandra analysis providing values for these of around 0.3 and 4.6 keV and a combined absorption corrected flux of erg s-1cm-2 corresponding to an unabsorbed luminosity of erg s-1. Using derived X-ray properties the SFR of NGC 4214 is calculated as 0.07, in reasonable agreement with the value of 0.04 derived using .
The X-ray emission coincides with regions of H emission and hence is coincident with star forming regions. The presence of X-ray emission coincident with the NW complex, but not the SE complex of H emission agrees with previous speculation that there is a time delay before the wind from a cluster of stars can break out and start interacting with the surrounding medium. Using some basic assumptions about the properties of the X-ray emitting gas is has been calculated that it is likely that a blow-out will occur from the disk of NGC 4214, enriching the surrounding medium with materials from this starburst.
Acknowledgements
JMH and LKS acknowledge funding from PPARC studentships, and IRS from a PPARC Advanced Fellowship. DKS is supported by NASA through Chandra Postdoctoral Fellowship Award Number PF0-10012, issued by the Chandra X-ray Observatory Center, which is operated by the Smithsonian Astrophysical Observatory for and on behalf of NASA under contract NAS8-39073. We thank Jesús Maíz-Apellániz for supplying the H image.
References
- Allsopp (1979) Allsopp N. J., 1979, MNRAS, 188, 765
- Colbert et al. (2003) Colbert A. J. M., Heckman T. M., Ptak A. F., Strickland D. K., Weaver K. A., 2003, astro-ph/0305476
- De Young & Heckman (1994) De Young D. S., Heckman T. M., 1994, ApJ, 431, 598
- Dekel & Silk (1986) Dekel A., Silk J., 1986, ApJ, 303, 39
- Devereux & Eales (1989) Devereux N. A., Eales S. A., 1989, ApJ, 340, 708
- Drozdovsky et al. (2002) Drozdovsky I. O., Schulte-Ladbeck R. E., Hopp U., Greggio L., Crone M. M., 2002, AJ, 124, 811
- Fanelli et al. (1997) Fanelli M. N., Waller W. W., Smith D. A., Freedman W. L., Madore B., Neff S. G., O’Connell R. W., Roberts M. S., Bohlin R., Smith A. M., Stecher T. P., 1997, ApJ, 481, 735
- Ferrara & Tolstoy (2000) Ferrara A., Tolstoy E., 2000, MNRAS, 313, 291
- Grimm et al. (2003) Grimm H.-J., Gilfanov M., Sunyaev R., 2003, MNRAS, 339, 793
- Harris et al. (2001) Harris J., Calzetti D., Gallagher J. S., Conselice C. J., Smith D. A., 2001, AJ, 122, 3046
- Hertz & Grindlay (1983) Hertz P., Grindlay J. E., 1983, ApJ, 275, 105
- Huchra et al. (1983) Huchra J. P., Geller M. J., Gallagher J., Hunter D., Hartmann L., Fabbiano G., Aaronson M., 1983, ApJ, 274, 125
- Kennicutt (1998) Kennicutt R. C., 1998, ARA&A, 36, 189
- Kennicutt (1998) Kennicutt R. C., 1998, ApJ, 498, 541
- Kilgard et al. (2002) Kilgard R. E., Kaaret P., Krauss M. I., Prestwich A. H., Raley M. T., Zezas A., 2002, ApJ, 573, 138
- Kobulnicky & Skillman (1996) Kobulnicky H. A., Skillman E. D., 1996, ApJ, 471, 211
- Lehnert & Heckman (1996a) Lehnert M. D., Heckman T. M., 1996a, ApJ, 462, 651
- Lehnert & Heckman (1996b) Lehnert M. D., Heckman T. M., 1996b, ApJ, 472, 546
- Lehnert et al. (1999) Lehnert M. D., Heckman T. M., Weaver K. A., 1999, ApJ, 523, 575
- Leitherer et al. (1996) Leitherer C., Vacca W. D., Conti P. S., Filippenko A. V., Robert C., Sargent W. L. W., 1996, ApJ, 465, 717
- Mac Low & Ferrara (1999) Mac Low M., Ferrara A., 1999, ApJ, 513, 142
- Mac Low & McCray (1988) Mac Low M., McCray R., 1988, ApJ, 324, 776
- McIntyre (1998) McIntyre V. J., 1998, Publications of the Astronomical Society of Australia, 15, 157
- MacKenty et al. (2000) MacKenty J. W., Maíz-Apellániz J., Pickens C. E., Norman C. A., Walborn N. R., 2000, AJ, 120, 3007
- Maíz-Apellániz et al. (2002) Maíz-Apellániz J., Cieza L., MacKenty J. W., 2002, AJ, 123, 1307
- Maíz-Apellániz et al. (1999) Maíz-Apellániz J., Muñoz-Tuñón C., Tenorio-Tagle G., Mas-Hesse J. M., 1999, A&A, 343, 64
- Marlowe et al. (1995) Marlowe A. T., Heckman T. M., Wyse R. F. G., Schommer R., 1995, ApJ, 438, 563
- Martin et al. (2002) Martin C. L., Kobulnicky H. A., Heckman T. M., 2002, ApJ, 574, 663
- Moshir & et al. (1990) Moshir M., et al. 1990, IRAS Faint Source Catalogue, version 2.0.
- Navarro et al. (1995) Navarro J. F., Frenk C. S., White S. D. M., 1995, MNRAS, 275, 56
- Ott et al. (2003) Ott J., Martin C. L., Walter F., 2003, ApJ, 594, 776
- Plucinsky et al. (2003) Plucinsky P. P., Schulz N. S., Marshall H. L., Grant C. E., Chartas G., Sanwal D., Teter M., Vikhlinin A. A., Edgar R. J., Wise M. W., Allen G. E., Virani S. N., DePasquale J. M., Raley M. T., 2003, X-Ray and Gamma-Ray Telescopes and Instruments for Astronomy. Edited by Joachim E. Truemper, Harvey D. Tananbaum. Proceedings of the SPIE, Volume 4851, pp 89–100
- Prestwich et al. (2003) Prestwich A. H., Irwin J. A., Kilgard R. E., Krauss M. I., Zezas A., Primini F., Kaaret P., Boroson B., 2003, ApJ, 595, 719
- Ranalli et al. (2003) Ranalli P., Comastri A., Setti G., 2003, A&A, 399, 39
- Rice et al. (1988) Rice W., Lonsdale C. J., Soifer B. T., Neugebauer G., Koplan E. L., Lloyd L. A., de Jong T., Habing H. J., 1988, ApJS, 68, 91
- Rosati et al. (2002) Rosati P., Tozzi P., Giacconi R., Gilli R., Hasinger G., Kewley L., Mainieri V., Nonino M., Norman C., Szokoly G., Wang J. X., Zirm A., Bergeron J., Borgani S., Gilmozzi R., Grogin N., Koekemoer A., Schreier E., Zheng W., 2002, ApJ, 566, 667
- Schulz (1999) Schulz N. S., 1999, ApJ, 511, 304
- Soifer et al. (1989) Soifer B. T., Boehmer L., Neugebauer G., Sanders D. B., 1989, AJ, 98, 766
- Stevens & Strickland (1998a) Stevens I. R., Strickland D. K., 1998a, MNRAS, 294, 523
- Stevens & Strickland (1998b) Stevens I. R., Strickland D. K., 1998b, MNRAS, 301, 215
- Strickland et al. (2000) Strickland D. K., Heckman T. M., Weaver K. A., Dahlem M., 2000, AJ, 120, 2965
- Strickland et al. (1997) Strickland D. K., Ponman T. J., Stevens I. R., 1997, A&A, 320, 378
- Strickland & Stevens (1999) Strickland D. K., Stevens I. R., 1999, MNRAS, 306, 43
- Strickland & Stevens (2000) Strickland D. K., Stevens I. R., 2000, MNRAS, 314, 511
- Suchkov et al. (1994) Suchkov A. A., Balsara D. S., Heckman T. M., Leitherner C., 1994, ApJ, 430, 511
- Summers et al. (2001) Summers L. K., Stevens I. R., Strickland D. K., 2001, MNRAS, 327, 385
- Summers et al. (2003a) Summers L. K., Stevens I. R., Strickland D. K., Heckman T. M., 2003a, MNRAS, 342, 690
- Summers et al. (2003b) Summers L. K., Stevens I. R., Strickland D. K., Heckman T. M., 2003b, submitted
- Supper et al. (1997) Supper R., Hasinger G., Pietsch W., Truemper J., Jain A., Magnier E. A., Lewin W. H. G., van Paradijs J., 1997, A&A, 317, 328
- Tennant et al. (2001) Tennant A. F., Wu K., Ghosh K. K., Kolodziejczak J. J., Swartz D. A., 2001, ApJ, 549, L43
- Thronson et al. (1988) Thronson H. A., Greenhouse M., Hunter D. A., Telesco C. M., Harper D. A., 1988, ApJ, 334, 605
- Thronson et al. (1987) Thronson H. A., Hunter D. A., Telesco C. M., Decher R., Harper D. A., 1987, ApJ, 317, 180
- Tully (1988) Tully R. B., 1988, Nearby galaxies catalog. Cambridge and New York, Cambridge University Press, 1988, p.221
- Walter et al. (2001) Walter F., Taylor C. L., Hüttemeister S., Scoville N., McIntyre V., 2001, AJ, 121, 727
- Weaver et al. (1977) Weaver R., McCray R., Castor J., Shapiro P., Moore R., 1977, ApJ, 218, 377
- Wilcots & Thurow (2001) Wilcots E. M., Thurow J. C., 2001, ApJ, 555, 758
- Wu (2001) Wu K., 2001, Publications of the Astronomical Society of Australia, 18, 443
- Yorke (1986) Yorke H. W., 1986, ARA&A, 24, 49
- Zezas et al. (2002) Zezas A., Fabbiano G., Rots A. H., Murray S. S., 2002, ApJS, 142, 239