A new strongly X-ray flaring M9 dwarf in the solar neighborhood††thanks: Based on observations collected with the ESO 1.54 m/DFOSC and NTT/EMMI at the European Southern Observatory, La Silla, Chile (ESO programmes 69.D-0605 and 69.D-0486).
We report on the discovery of a very low mass (VLM) star in the solar neighborhood, originally identified as an optical counterpart of a flaring Xray source detected in the ROSAT All-Sky survey. Optical spectroscopy and infrared photometry consistently reveal a spectral type of and a distance of 11 2 pc. The optical counterpart of 1RXS~J115928.5$-$524717 shows a large proper motion of 1.080.06 /year. 1RXS~J115928.5$-$524717 is the fourth object among the VLM stars displaying a huge Xray flare, reaching the unprecedent value of 0.1.
Key Words.:
methods: data analysis – Xrays: stars – stars: low-mass, brown dwarfs – stars: distances – stars: flare: – stars: individual: 1RXS J115928.55247171 Introduction
Imaging sky surveys performed during the last decade at different wavelengths (optical, near–infrared) have uncovered a large population of very low–mass (VLM) stars and brown dwarf candidates in star forming regions, open clusters and in the general galactic field.
According to an estimate presented by Reid et al. (reid2003 (2003)) the current 10 pc sample is only 75% complete and the level of incompleteness is somewhat higher in the southern sky and with the latest type objects.
With spectral types of M7 and later, these objects, sometimes called “ultracool M dwarfs”, are so faint optically that even nearby ones eluded searches based on the optical, near–infrared and high proper motion sky surveys, and, therefore a detection of a new VLM star in the solar vicinity is of vital importance in the determination of fundamental parameters such as the luminosity function, the mass function, the kinematics of those stars and other properties.
The strength of H-emission increases as cooler, lower-mass stars are considered (Hawley et al. haw96 (1996); Gizis et al. gizis00 (2000)). The emission is up to 100% at spectral types M7-M9. The observed decline in H-emission for old (1 Gyr) L-type dwarfs in the field suggests that the activity borderline is close to objects of substellar masses (Gizis et al. gizis00 (2000); Basri basri01 (2001); Mohanty & Basri mohanty (2003)).
Analyzing Xray properties of VLM stars based on ROSAT observations, Fleming et al. (Fleming93 (1993)) showed that there is no apparent decrease in Xray flux (hence coronal heating efficency) down to spectral type M5, as was suggested by Mullan (mullan (1984)) analyzing Einstein data.
Flares as another property of chromospheric and coronal activity represent a phenomenon which is important in ultracool dwarfs, because at these low temperatures (and masses) these objects are fully convective, and variability is often attributed to rotational modulation of star spots produced by magnetic activity. In solar-type stars it is believed to be due to the so-called dynamo. This mechanism no longer operates in VLM stars and brown dwarfs, but as these objects are fully convective, a turbulent dynamo could come into operation (see Chabrier & Baraffe chabrier00a (2000) and references therein). This means that the change in interior structure is expected to result in a change of the field sustaining dynamo, and, therefore Xray emission properties of late-type stars.
Flares were reported for a number of VLM stars, observed in ultraviolet, Xray, and radio frequencies, as well as in optical spectra or via photometry. Bursts of Xray emission interpreted as coronal flares were detected from the long-known M8V dwarf vB 10 (Fleming et al. vb10 (2000)), the M9V dwarf LHS~2065 (Schmitt & Liefke lhs2065 (2002)) by ROSAT and the M9 brown dwarf LP~944$-$20 (Rutledge et al. lp944 (2000)) by Chandra observations.
vB 10 showed a far-ultraviolet flare observed by Linsky et al. (linsky (1995)) using the GHRS on the Hubble Space Telescope. Radio emission has been observed from LP~944$-$20 and some other ultracool dwarfs (Berger et al. berger01 (2001), Berger berger02 (2002)). From the intensity of the continuous emission and flaring at 8.5 GHz detected in these objects, Berger (berger02 (2002)) concluded that the emission mechanism is most likely synchrotron radiation and not of thermal origin. This indicates the presence of magnetic fields and electron column densities similar to those inferred for earlier-type flaring M dwarfs.
H-flares were observed on several occasions, e.g. in the M8.5 APMPM~J2354$-$3316CM9.5 (Scholz et al. 2003a ) and M9.5 dwarfs 2MASSW~J0149090$+$295613 (Liebert et al. liebert99 (1999)), BRI~0021$-$214 (Reid et al. reid99 (1999)) and even in the cooler L5-dwarf 2MASS~J01443536$-$0716142 (Liebert et al. liebert03 (2003)).
Thus, it has become apparent that the level of quiescent chromospheric and coronal activity as measured by the H emission line and Xray fluxes relative to the total bolometric flux generally declines with spectral type later than M7.
However, no clear change in flare activity diagnostics is found in VLM stars (Fleming et al. Fleming95 (1995); Mokler & Stelzer mokler (2002); Martín & Bouy martin (2003)).
We performed a systematic search for Xray variability in the ROSAT All-Sky survey data (Hambaryan et al. skymi (2001)). Our technique is customized for the detection of flare-like variability. Here we report on the identification of the optical counterpart of the strong flaring Xray source 1RXS~J115928.5$-$524717 as a new ultracool dwarf star in the solar neighborhood by optical spectroscopy and astrometry.
2 Observational data and reduction
2.1 Xray data
During the ROSAT All–Sky Survey (RASS) the whole sky was observed in an unbiased fashion. This, therefore, is well suited to study of variability in different types of celestial objects in the Xray range (0.12.4 keV).
Using a Bayesian change point detection method (see Sect. 3.1), we analyzed the RASS Bright Source Catalog (BSC) for variability. The method works on unbinned data, i.e. the photon arrival times of RASS event tables. We found that out of 18811 BSC sources 642 show significant variations (Hambaryan et al. skymi (2001)).
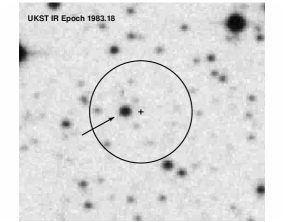
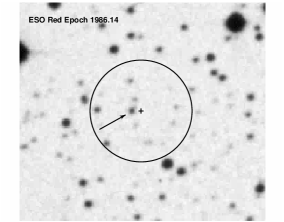
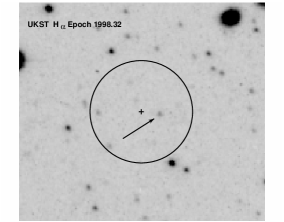
In the framework of this project the Xray source 1RXS~J115928.5$-$524717 was identified as variable111This source was included in the search list of Xray afterglows from gamma–ray bursts by Greiner et al. (jochen (2000)). It is also included in the catalogue of variable sources of RASS as a flaring object (Fuhrmeister & Schmitt fuhr (2003)).. Our identification procedure of optical counterparts of RASS sources typically consists of several steps and first includes the automatic extraction of DSS images and a visual search for possible counterparts in an error circle with radius 25. In this particular case, as one sees in Fig. 1, there is no unique optical counterpart of 1RXS~J115928.5$-$524717 and our dedicated followup optical spectroscopy in such a case starts with the brightest object in the Xray error circle. However, while inspecting finding charts obtained at different epochs, we found that the brightest object in the DSS II R-band image (epoch 1991.12, the closest one to the RASS observation, cf. Table 2) has changed its position significantly. Further investigation showed that it is a high proper motion star and also bright on an H image taken by the UKST (epoch 1998.32).
Other fainter objects in the Xray error circle cannot be completely removed from further consideration as the counterpart of the 1RXS~J115928.5$-$524717. Nevertheless, we concentrated in our followup study on the brightest one.
The RASS was performed in such a way that the sky was scanned along great circles with the ROSAT Xray telescope; the scanning period was equal to the orbital period, i.e. 96 minutes. A given source was scanned for at least 2 days and during a single scan, it remained in the field of view for typically 1030 seconds.
The Xray source 1RXS~J115928.5$-$524717 is included in the RASS Source Catalogue (1RXS) with a count rate of cts s-1 and was observed during January 911, 1991 (ROR number 932622).
The arrival times of photons registered in the RASS during this observation of 1RXS~J115928.5$-$524717 were extracted using the position and extraction radius available in the BSC (Voges et al. bsc99 (1999)). The Good Time Intervals were determined in a manner described by Belloni et al. (bellonietal (1994)), in which the whole extraction circle () was completely within the field of view of the detector.
2.1.1 Optical data
Low-resolution spectroscopy and photometry were performed with DFOSC at the 1.54 m Danish telescope at ESO on July 14 and 17, 2002. The nights were not exactly photometric but sufficient for the spectroscopy. We obtained three spectra of 1RXS~J115928.5$-$524717 with the DFOSC grism #5 and grism #15.
Standard calibration exposures were taken for bias subtraction, flat fielding and flux calibration with spectrophotometric standard stars. Wavelength calibration was done with arc-lamp spectra and additionally inspected with the night-sky lines.
We also obtained two medium-resolution spectra of the likely counterpart of 1RXS~J115928.5$-$524717 on 4 August, 2002 at the 3.5 m-New Technology Telescope (NTT) of European Southern Observatory (ESO) at La Silla with the ESO Multi Mode Instrument (EMMI) in the red medium dispersion mode. Grating #6 was used, providing a FWHM spectral resolution of Å (with the 1.0 slit) and covered a spectral range of Å.
All reductions were performed with MIDAS. The CCD 44-82 currently in use with DFOSC is a thinned chip, so there is strong fringing seen on the red side of 7000 Å, and it is also visible in Gunn- images. For the spectra, the fringing could be satisfactory removed with the flat-field below 8000 Å. For the -band images the dome flat-field correction removed the fringes completely.
3 Data analysis and Results
3.1 Xray flare
3.1.1 Light curve
In order to study the time behavior of 1RXS~J115928.5$-$524717 we performed a timing analysis of the dataset using a Bayesian change point detection approach developed by Scargle (scar1 (1998, 2000)). It is very well suited for a statistical examination when the arrival times of individual Xray photons are registered (see Hambaryan et al. arajin (1999); Schwope et al. erkrord (2002)).
The essence of the method is that it subdivides a given data set into intervals with a piecewise constant Xray count rate according to Poissonian statistics. The application of this procedure to the RASS-detected photons finds three change points, i.e. the data set was decomposed into four observational segments with no variation within them and highly significant variations of count rates between them.
Fig. 2 and Table 1 show the RASS Xray lightcurve of 1RXS~J115928.5$-$524717 in the form of average count-rate for each observational interval. In Fig. 2 the PSPC count rate is plotted vs. time in Julian days. The most dominant light curve feature is a giant Xray flare that occurred between JD 2448266.0 and JD 2448266.3. Owing to the data gaps and sparse statistics it is not possible to determine the flare onset time.
In total (source+background), 52 photons were registered during the RASS observations. As a background level we used a value given in the ROSAT BSC (Voges et al. bsc99 (1999)) for this observation, estimated for the field of view (vignetting corrected 0.00087 counts/sec/arcmin2). Thus, from these, 52 photons 323.68 28 are attributed to the flare of 1RXS~J115928.5$-$524717. They were recorded in the two subsequent observational intervals OBI # 5 and 6 (cf. Table 1). In OBI #7 just one photon was registered, while during the next one (OBI # 8) out of 5 registered photons 3 are attributed to the source. In order to estimate the intrinsic source count rate and confidence limits for each observational interval we used a Bayesian approach for low numbers of counts developed by Kraft et al. (kraft (1991)). Instead of the widely used approach of simply subtracting the mean number of background counts from the observed number of counts it correctly takes into account Poissonian fluctuations in the number of counts.
In the last two columns of Table 1 a mode of the probability distribution function of vignettingcorrected intrinsic source count rates and credible regions of the source count rates are given. In Fig. 2 these Bayesian credible regions (posterior bubble 0.6827) for each estimated value of the source count rate are plotted.
An estimate of the quiescent Xray count rate is possible after exclusion of the flare OBIs. Excluding OBIs #5 and 6 and application of the above procedure to all remaining photons gives an upper limit to the count rate of 0.015 s-1, excluding OBI #8 as well gives an upper limit of 0.011 s-1. It should be noted that the source was clearly detected during three observational intervals (OBI # 5,6 and 8).
| OBI | JD | Expo | cts | Back- | Source | Credible |
|---|---|---|---|---|---|---|
| +2448266 | (s) | (s+b) | ground | regions | ||
| 1 | 0.05456019 | 9.00 | 1 | 0.613 | 0.054 | 0.000-0.269 |
| 2 | 0.12127315 | 13.00 | 0 | 0.885 | 0.000 | 0.000-0.110 |
| 3 | 0.18798611 | 15.00 | 0 | 1.021 | 0.000 | 0.000-0.096 |
| 4 | 0.92155093 | 27.00 | 0 | 1.838 | 0.000 | 0.000-0.053 |
| 5 | 0.98826389 | 27.00 | 22 | 1.838 | 0.933 | 0.731-1.167 |
| 6 | 1.05497685 | 27.00 | 10 | 1.838 | 0.378 | 0.246-0.542 |
| 7 | 1.12168981 | 28.00 | 1 | 1.906 | 0.000 | 0.000-0.071 |
| 8 | 1.18840278 | 28.00 | 5 | 1.906 | 0.138 | 0.053-0.253 |
| 9 | 1.45490741 | 28.00 | 1 | 1.906 | 0.000 | 0.000-0.071 |
| 10 | 1.85520833 | 25.00 | 3 | 1.702 | 0.065 | 0.000-0.157 |
| 11 | 1.92192130 | 23.00 | 1 | 1.566 | 0.000 | 0.000-0.089 |
| 12 | 1.98863426 | 23.00 | 0 | 1.566 | 0.000 | 0.000-0.062 |
| 13 | 2.05534722 | 22.00 | 0 | 1.498 | 0.000 | 0.000-0.065 |
| 14 | 2.12206019 | 20.00 | 0 | 1.362 | 0.000 | 0.000-0.072 |
| 15 | 2.18877315 | 19.00 | 2 | 1.294 | 0.046 | 0.000-0.163 |
| 16 | 2.25520833 | 11.00 | 2 | 0.749 | 0.142 | 0.018-0.339 |
| 17 | 2.45530093 | 11.00 | 1 | 0.749 | 0.029 | 0.000-0.213 |

Assuming an exponential flare decay we determined the flare decay e-folding time for two cases, either including or excluding OBI #7. This can be justified by assuming that the flaring structure is hidden behind the star due to rotation. In the first case the e-folding time is = 0.04 days, in the second case it is 0.07 days.
3.1.2 Spectral analysis
Despite the observed small number of counts (Source+Background=52 and Background=20) we performed a crude spectral analysis, binning the data with a constant Signal/Noise ratio of 2, i.e. into bins, which contained between 3 and 7 (S+B) and between 0 and 2 (B) counts, respectively, in the energy range 0.112.46 keV. Note that no photons were registered above 1.25 keV in the S+B region. We fit the resulting spectrum with an assumed Raymond-Smith plasma model with negligible absorption, implemented in XSPEC version 11.1 (Arnaud arnaud (1996)). Indeed, applying from Paresce (P84 (1984)) and using a distance of 11.1 pc (see 3.2.1) we obtain N . With this fixed interstellar absorption parameter the best fit according to the C statistics gives (90% confidence) and a timeaveraged unabsorbed flux of .
An application to the data of OBI #5 and #6 separately gives and unabsorbed flux of in the energy range 0.1-2.4 keV for OBI #5 and and for OBI #6, respectively.
3.2 Optical spectroscopy
3.2.1 Spectral type and absolute magnitude
The spectrum of the proper motion object taken by us with DFOSC is shown in Fig. 3. For comparison we show the spectra of the late M dwarfs vB 8 (spectral type M7) and LP~944$-$20 (spectral type M9.5) taken with the same instrumental set up in the same observing run. The likely counterpart of 1RXS~J115928.5$-$524717 shows similar spectral features as the two template stars.


To assign a spectral type to our object we used two
different approaches based on the strengths of spectral features
and the slope of the spectrum. First we compiled a set of spectral
standards using 74 late type dwarfs (from M0 to L8)222
available at http://www.physics.upenn.edu/inr
and
http://www.astro.washington.edu/covey/research/research.html and
then employed spectral classification methods. In the first
method, spectral indices of individual features (in total 16) were
measured and compared with a standard sequence, following Cruz &
Reid (cruz_reid (2002)) and Hawley et al. (haw02 (2002)). We
computed their spectral indices to determine the
relationships between spectral type and individual spectral
features, suggested by the same authors. In Fig. 4 some of
these relationships are shown.
The second method, described by Henry et al. (h02 (2002)), tries to match the overall shape of the observed spectrum to template spectra (see also Hawley et al. haw02 (2002)).

The method works very well for the known late-type M dwarfs LP~944$-$20 and vB 8 also observed by us. We could reproduce the published spectral subclass with an uncertainty of half a subclass (see Fig. 4).
For each of these relations one gets an independent estimate of the spectral class. We take the spectral type to be the average of those estimates rounded to the nearest half spectral type. The resulting spectral type of 1RXS~J115928.5$-$524717 determined consistently by both methods is M9 0.5.
We identified 1RXS~J115928.5$-$524717 with the Two Micron All Sky Survey source 2MASS~11592743$-$5247188 with magnitudes and . Following Gizis et al. (gizis00 (2000)) we estimate from the color using the relation
with a scatter of magnitudes. The relation is valid for dwarfs in the color range J-K corresponding typically to dwarfs later than M7. The relation gives , the implied distance to 1RXS~J115928.5$-$524717 is .
If we instead derive the absolute magnitude of the likely counterpart of 1RXS~J115928.5$-$524717 via the spectral type,
(Dahn et al. dahn (2002)), we arrive at very similar results. Indeed, for spectral types M8.5, M9 and M9.5 we get , and , correspondingly.
3.3 Proper motion
While the large proper motion of the object was already discovered during the visual inspection of Digitized Sky Survey data at two epochs only, an accurate proper motion determination was done on the basis of a larger set of measurements with different epochs available in SuperCOSMOS Sky Survey (SSS) data (Hambly et al. 2001a , 2001b , 2001c ). With a location in the overlap region between two UK Schmidt telescope (UKST) survey fields we were lucky to identify the object in the SSS catalogues at eight different epochs with three different passbands (, and ). In addition to the SSS data, two further measurements from the SuperCOSMOS H-alpha survey (SHS) (Parker & Phillips parker98 (1998)) were available (see Table 2).
The position of the object in the recently completed all sky data release of the Two Micron All Sky Survey (2MASS, Cutri et al. cutri03 (2003)) and in the second release of DENIS (DEep Near-Infrared Survey, Epchtein et al. denis (1997)) now available at http://vizier.u-strasbg.fr/viz-bin/Cat?B/denis was included in the proper motion solution. The 2MASS and DENIS photometry is also listed in Table 2.
The most recent epoch astrometry was obtained from DFOSC acquisition images in the and bands. The astrometric calibration was done using the ESO Skycat tool with 16 faint SSS reference stars located around the target, which did not show significant proper motions and which were not affected by image crowding in the SSS data. Two independent astrometric calibrations for the DFOSC and image yielded very similar results. The average result was used as one additional epoch in the proper motion solution.
| (J2000) | (J2000) | epoch | photometry | note |
|---|---|---|---|---|
| 11 59 30.178 | -52 47 15.85 | 1976.26 | =21.00 | 1 |
| 11 59 30.147 | -52 47 17.04 | 1977.41 | =20.75 | 1, |
| 11 59 29.665 | -52 47 16.28 | 1980.23 | =14.49 | 1 |
| 11 59 29.340 | -52 47 16.65 | 1983.18 | =13.76 | 1 |
| 11 59 29.089 | -52 47 16.92 | 1985.19 | =17.70 | 2 |
| 11 59 28.996 | -52 47 16.55 | 1986.14 | =17.44 | 2, |
| 11 59 28.425 | -52 47 17.45 | 1991.12 | =17.66 | 1, |
| 11 59 28.268 | -52 47 17.98 | 1992.24 | =18.07 | 1 |
| 11 59 27.531 | -52 47 18.64 | 1998.32 | =17.30 | 3 |
| 11 59 27.515 | -52 47 18.56 | 1998.39 | =17.96 | 3 |
| 11 59 27.43 | -52 47 18.8 | 1999.36 | =11.430 | 4 |
| =10.763 | 4 | |||
| =10.322 | 4 | |||
| 11 59 27.32 | -52 47 19.0 | 2000.78 | 14.499 | 5, |
| 11.398 | 5 | |||
| 10.343 | 5 | |||
| 11 59 27.047 | -52 47 19.32 | 2002.55 | 17.08 | 6 |
Notes:
1 – SSS measurements of UKST plates.
2 – SSS measurements of ESO Schmidt plates.
3 – SHS film scans.
4 – 2MASS all-sky data release.
5 – DENIS second data release.
6 – Position from two DFOSC acquisition images ( and ).
– Measurements not used in final proper motion solution, due to
overlap with a background object. Photometry is also affected.
Since our object (1RXS~J115928.5-524717) is moving across a crowded field of background stars, some of the SSS measurements are affected by overlapping images, as can also be noted in the SSS image parameters. There also seems to be a large error (1″) in the coordinate of the DENIS data. Therefore, we excluded three of the SSS positions and the DENIS position given in Table 2 from the final proper motion solution, yielding a significant improvement in the proper motion accuracy (see Table 3).
| positions used in solution | ||
|---|---|---|
| [mas/yr] | ||
| 13 (all available) | 1083.911.6 | 119.011.3 |
| 12 (excl. epoch 1977) | 1069.87.8 | 133.86.3 |
| 11 (excl. 1977, 1986) | 1069.58.4 | 130.93.9 |
| 10 (excl. 1977, 1986, 1991) | 1069.48.5 | 130.72.5 |
| 9 (excl. 3 SSS and DENIS)# | 1076.65.1 | 130.72.9 |
Note: # – finally adopted proper motion solution.
4 Discussion and summary
The object 1RXS~J115928.5$-$524717 was detected in the RASS due to the presence of a huge Xray flare. This was uncovered by our time variability analysis of all RASS-BSC sources. The quiescence Xray flux is consistent with the background level.
Our follow-up optical spectroscopy and proper motion study allowed us to determine the spectral type, M, and the absolute magnitude of the most likely optical counterpart of the flaring Xray source. It turned out that this object is a nearby, pc, high proper motion, 1.080.06/yr, previously unknown member of the solar neighborhood.
In order to compare the Xray properties of 1RXS~J115928.5$-$524717 with other ultracool stars we estimated . From a spectral fit (Sect. 3.1) we estimated time averaged and flare peak Xray luminosities of and , using unabsorbed fluxes in the passband keV. The luminosity uncertainties were determined by a combination of uncertainties of the distance and of the parameters of the spectral fit.
For an estimate of an upper limit of the Xray luminosity of 1RXS~J115928.5$-$524717 in its quiescent state we converted from upper limit count rates (0.011 and 0.015) to fluxes by means of an energy conversion factor which was computed by us in XSPEC assuming a Raymond-Smith plasma (model raymond ) with temperature and absorption column density N (see also Hünsch et al. huensch99 (1999), Fleming et al. fleming03 (2003)). Using a distance of pc we arrived at an upper limit value of for the quiescent Xray emission of 1RXS~J115928.5$-$524717.
Dahn et al. (dahn (2002)) list bolometric magnitudes for two M8.5, five M9 and three M9.5 dwarfs in the immediate solar neighborhood333 for CTI~0126+28; for T513-46546; for BRI~1222-12; for T868-110639; for LHS~2065; for LHS~2924; for LP~944-20; for BRI~0021-02; for 2M~0149+29; and for PC~0025+04.. An average gives magnitudes.
This leads to the . Therefore, we estimate the ratios at the flare peak and an upper limit of in the quiescent state which can be compared with measurements of other late-type dwarfs.
In Fig. 5 we display the dependence of Xray activity on spectral type for M dwarfs, using data from the RASS catalogue of nearby stars (Hünsch et al. huensch99 (1999)). To derive bolometric magnitudes we used the relation
(Mullan mullan (1984)) which has a typical scatter of 0.36 mag.
We also include in this diagram the only four known examples of VLM stars with detected Xray emission in the solar neighborhood. All these stars have quiescent Xray fluxes which are compatible with zero. They all show pronounced Xray flares, the newly discovered object 1RXS~J115928.5$-$524717 being the most luminous among them.
The ROSAT surveys of both field and cluster stars show a maximum value of about . Since this ratio may be regarded as an efficiency measure of the coronal heating processes and of the activity related phenomena, the maximum value indicates a still not well understood saturation phenomenon.
While the final word on the quiescent Xray emission down to the bottom of the main sequence at spectral type M8/9 is not known, (see also the discussions in Fleming et al. Fleming95 (1995, 2003); Mokler & Stelzer mokler (2002); Martín & Bouy martin (2003)) the flare observations of the very late M dwarfs suggest that their Xray luminosity is independent of the spectral subclass.

Any nearby ultracool dwarf, like this new one, is a promising target for direct imaging searches for sub-stellar companions, because the primary is nearby (i.e. high physical separation) and faint (i.e. no overshining companions)444See e.g. Neuhäuser et al (ralph_denis (2002)) on DENIS-P~J104814.7$-$395606 and Scholz et al. (2003b ) on Indi system..
Acknowledgements.
We thank our colleagues T. Granzer (Astrophysikalisches Institut Potsdam) and R. Schwarz (Universitäts-Sternwarte Göttingen) for their assistance in the reduction of DFOSC photometric data. We have made use of the ROSAT Data Archive of the Max-Planck-Institut für extraterrestrische Physik (MPE) at Garching, Germany, data products from the SuperCOSMOS Sky Surveys at the Wide-Field Astronomy Unit of the Institute for Astronomy, University of Edinburgh and of the ESO Skycat Tool (version 2.5.3.). We have also used data products from the Two Micron All Sky Survey, which is a joint project of the University of Massachusetts and the Infrared Processing and Analysis Center/California Institute of Technology, funded by the National Aeronautics and Space Administration and the National Science Foundation. This project is supported in part by the German BMBF under DLR grant 50 OX 0201.References
- (1) Arnaud, K. A. 1996,in ASP Conf. Ser. 101, Astronomical Data Analysis Software and Systems V, ed. George H. Jacoby and Jeannette Barnes, p. 17
- (2) Basri, G. 2001, in ASP Conf. Ser. 223, 11th Cambridge Workshop on Cool Stars, Stellar Systems and the Sun, ed. R. J. García Lopez R, Rebolo & M. R. Zapaterio Osorio, 261
- (3) Belloni, T., Hasinger, G., & Izzo, C. 1994, A&A, 283, 1037
- (4) Berger, E. 2002, ApJ, 572, 503
- (5) Berger, E., Ball, S., Becker, K.M., et al. 2001, Nature, 410, 338
- (6) Chabrier, G., & Baraffe, I. 2000, ARA&A, 33, 337
- (7) Cruz, K. L., Reid, I. Neill 2002, AJ, 123, 2828
- (8) Cutri, R. M., Skrutskie, M. F., Van Dyk, S., et al. 2003, The 2MASS All-Sky Catalog of Point Sources, University of Massachusetts and Infrared Processing and Analysis Center (IPAC/California Institute of Technology)
- (9) Dahn, C. C., Harris, H. C., Vrba, F. J., et al. 2002, AJ, 124, 1170
- (10) Epchtein, N., de Batz, B., Capoani, L., et al. 1997, The Messenger, 87, 27
- (11) Fleming, T. A., Giampapa, M. S., & Garza, D. 2003, ApJpreprint doi:10.1086/376968.
- (12) Fleming, T. A., Giampapa, M. S., & Schmitt, J. H. M. M 2000, ApJ, 533, 372
- (13) Fleming, T. A., Schmitt, J. H. M. M., & Giampapa, M. S. 1993, ApJ, 410, 387
- (14) Fleming, T. A., Schmitt, J. H. M. M., & Giampapa, M. S., 1995, ApJ, 450, 401
- (15) Fuhrmeister, B., & Schmitt, J. H. M. M. 2003, A&A, 403, 247
- (16) Gizis, J. E., Monet, D. G., Reid, I. N., Kirkpatrick, J. D., Liebert, J., & Williams, R.J. 2000, AJ, 120, 1085
- (17) Greiner, J., Hartmann, D. H., Voges, W., Boller, T., Schwarz, R., & Zharikov, S. V. 2000, A&A, 353, 998
- (18) Hambaryan, V., Neuhäuser, R., & Stelzer B. 1999, A&A, 345, 121
- (19) Hambaryan, V., Schwope, A., Hasinger, G., Neuhäuser, R., & Voges, W. 2001, in Mining the Sky, Proceedings of the MPA/ESO/MPE Workshop, ed. A. J. Banday, S. Zaroubi, & M. Bartelmann. Heidelberg: Springer-Verlag, 508
- (20) Hambly, N. C., Irwin, M. J., MacGillivray, H. T. 2001b, MNRAS, 326, 1295
- (21) Hambly, N. C., MacGillivray, H. T., Read, M. A., et al. 2001a, MNRAS, 326, 1279
- (22) Hambly, N. C., Davenhall, A. C., Irwin, M. J., & MacGillivray, H. T. 2001c, MNRAS, 326, 1315
- (23) Hawley, S. L., Gizis, J. E., & Reid, I. N., 1996, AJ, 112, 2799
- (24) Hawley, S. L., Covey, K. R., Knapp, G. R., et al., 2002, AJ, 123, 2002
- (25) Henry, T. J., Walkowicz, L. M., Barto, T. C., & Golimowski, D.A. 2002, AJ, 123,2002
- (26) Hünsch, M., Schmitt, J. H. M. M., Sterzik, M. F., & Voges, W. 1999, A&AS, 135, 315
- (27) Kraft, R. P., Burrows, D. N., & Nousek, J. A. 1991, ApJ, 374, 344
- (28) Liebert, J., Kirkpatrick, J. D., Reid, I. N., & Fisher, M. D. 1999, ApJ, 519, 345
- (29) Liebert, J., Kirkpatrick, J. D., Cruz, K.L, et al. 2003, AJ, 125, 343
- (30) Linsky, J. L., Wood, B. E., Brown, A., Giampapa, M. S., & Ambruster, C. 1995, ApJ, 455, 670
- (31) Martín, E. L., & Bouy, H. 2003, New Astronomy, 7, 595
- (32) Mokler, F., & Stelzer, B. 2002, A&A, 391, 1025
- (33) Mohanty, S., & Basri, G. 2003, ApJ, 583, 451
- (34) Mullan, D. J. 1984, ApJ, 282, 603
- (35) Neuhäuser, R., Guenther, E. W., Alves, J., et al. 2002, Astron. Nachr., 323, 447
- (36) Paresce, F. 1984, AJ, 89, 1022
- (37) Parker, Q. A., & Phillips, S. 1998, Proc. Astron. Soc. Aust., 15, 28
- (38) Reid, I. N., Hawley, S. L., & Gizis, J. E. 1995, AJ, 110, 1838
- (39) Reid, I. N., Kirkpatrick, J. D., Gizis, J.E., & Liebert, J. 1999, ApJ, 527, L105
- (40) Reid, I. N., Cruz, K. L, Laurie, S. P., et al. 2003, AJ, 125, 354
- (41) Rutledge, R. E., Basri, G., Martín, E. L., & Bildsten, L. 2000, ApJ, 538, L141
- (42) Scargle, J. 1998, ApJ, 504, 405
- (43) Scargle, J. 2000, in AIP Conference Proceedings 567, 19th International Workshop on Bayesian Inference and Maximum Entropy Methods (MaxEnt ’99), ed. J. Rychert, G. Erickson, & R. Smith, 245
- (44) Schmitt, J. H. M. M., & Liefke, C., 2002, A&A, 382, L92
- (45) Scholz, R.-D., Lodieu, N., Ibata, R., et al. 2003a, submitted.
- (46) Scholz, R.-D., McCaughrean, M. J., Lodieu, N., & Kuhlbrodt, B. 2003b, A&A, 398, 29.
- (47) Schwope, A. D., Hambaryan, V., Schwarz, R., Kanbach, G., & Gänsicke, B. T. 2002, A&A, 392, 541
- (48) Tinney, C. G. 1996, MNRAS, 281, 644
- (49) Tinney, C. G. 1998, MNRAS, 296, L42
- (50) Voges, W., Aschenbach, B., Boller, Th., et al. 1999, A&A, 349, 389