VLT + UVES Spectroscopy of the Low-Ionization Intrinsic Absorber in SDSS J001130.56005550.7 ††thanks: Based on observations collected at the European Southern Observatory, Cerro Paranal, Chile (ESO 267.A-5698)
We analyse high-resolution VLT+UVES spectra of the low-ionization intrinsic absorber observed in the BAL QSO SDSS J001130.56005550.7. Two narrow absorption systems at velocities 600 km s-1 and 22000 km s-1 are detected. The low-velocity system is part of the broad absorption line (BAL), while the high-velocity one is well detached. While most narrow absorption components are only detected in the high-ionization species, the lowest velocity component is detected in both high- and low-ionization species, including in the excited Si ii⋆ and C ii⋆ lines. From the analysis of doublet lines, we find that the narrow absorption lines at the low-velocity end of the BAL trough are completely saturated but do not reach zero flux, their profiles being dominated by a velocity-dependent covering factor. The covering factor is significantly smaller for Mg ii than for Si iv and N v, which demonstrates the intrinsic nature of absorber. From the analysis of the excited Si ii⋆ and C ii⋆ lines in the lowest velocity component, we find an electron density 103 cm-3. Assuming photoionization equilibrium, we derive a distance 20 kpc between the low-ionization region and the quasar core. The correspondence in velocity of the high- and low-ionization features suggests that all these species must be closely associated, hence formed at the same distance of 20 kpc, much higher than the distance usually assumed for BAL absorbers.
Key Words.:
Quasars: general – Quasars: absorption lines1 Introduction
Intrinsic absorption lines in quasars are usually classified as broad absorption lines (BALs) or narrow absorption lines (NALs). These absorption line systems are to be distinguished from cosmologically “intervening” systems unrelated to the quasar environment (Barlow et al. bar1997b (1997)).
Broad (velocity width FWHM 2000 km s-1) troughs (BALs) are detected in roughly 15% of optically selected quasars (Hewett & Foltz hf2003 (2003), Reichard et al. 2003b ). They are blueshifted with respect to the QSO emission lines. BAL outflows occur at velocities of typically 0.1 (Weymann et al. wey1991 (1991)). Most BAL QSOs have absorption in high-ionization species like C iv 1549, Si iv 1397 and N v 1240. A minority of them also show absorption due to lower ionization species (LoBAL) such as Mg ii 2798 or Al iii 1857.
NALs have velocity widths of at most a few hundred km s-1. NALs are not only observed at redshifts but also at blueshifted velocities comparable to those seen in BAL QSOs (Barlow et al. bar1997b (1997), Hamann et al. 1997a ). NALs can also appear redshifted up to 2000 km s-1even though they are frequently blueshifted. Since common doublet transitions are resolved in NALs using high-resolution spectroscopy, they constitute useful diagnostics of the quasar environment. The so-called mini-BALs (e.g. Churchill et al. chu1999 (1999)) have intermediate absorption widths, i.e. FWHM between a few hundred and 2000 km s-1.
BALs and NALs indicate that outflows from Active Galactic Nuclei span a large range of velocity widths. While it is known that NALs may form in various environments (Hamann et al. ham2001 (2001) and references therein), it is not clear whether at least some of them are directly related to the BAL phenomenon. In some rare cases, NALs and BALs may be observed in the same quasar, providing an opportunity to directly investigate this issue.
In this paper we report high-resolution spectroscopy of SDSS J001130.56005550.7 (hereafter SDSS J00110055; Schneider et al. sch2002 (2002)) discovered in the Sloan Digital Sky Survey (York et al. yor2000 (2000)). This object is one of the 105 quasar candidates (Richards et al. ric2002 (2002)) for which the survey is obtaining redshifts, in addition to the galaxies which comprise the bulk of the spectroscopic targets (Blanton et al. bla2003 (2003)), selected from astrometrically calibrated drift-scanned imaging data (Gunn et al. gun1998 (1998), Pier et al. pie2003 (2003)) on the SDSS AB asinh magnitude system (Fukugita et al. fuk1996 (1996), Lupton et al. lgs1999 (1999), Hogg et al. hog2001 (2001), Stoughton et al. sto2002 (2002), Smith et al. smi2002 (2002)).
SDSS J00110055 has strong intrinsic absorption extending up to a velocity of 5500 km s-1 in C iv. It just misses formal classification as a BAL QSO: the balnicity index defined by Weymann et al. (wey1991 (1991)) is measured to be zero using the method of Reichard et al. (2003a ). However, it has a value of 2040 km s-1 on the absorption index scale designed by Hall et al. (hal2002 (2002)) to include troughs too narrow or close to the quasar redshift for consideration by the balnicity index. Since the formal classification is rather arbitrary and non-physical, we consider SDSS J00110055 as a BAL QSO in the following.
SDSS J00110055 shows both high- and low-ionization absorptions resolved into narrow components, together with a well-detached high-velocity narrow line system. Because some absorption arises from excited levels, SDSS J00110055 also provides a rare opportunity to derive the electron gas density and to constrain the distance to the absorber.
Observations are reported in Sect. 2 and the characteristics of the spectrum in Sect. 3. The narrow lines are analysed in Sect. 4 in order to establish their intrinsic nature, to evaluate the covering factor of the different ions, and to estimate the electron density in the flow using excited lines. Discussion and conclusions form the last section.
2 UVES observations
Observations of several SDSS BAL quasars were obtained on UT 10-12 Aug 2001 using the ESO Very Large Telescope (VLT) Unit 2 (Kueyen) and the Ultraviolet-Visual Echelle Spectrograph (UVES). Part of these observations are reported in Hall et al. (hal2003 (2003)).
For SDSS J00110055 two hour-long exposures were secured in the UVES DIC2 437+860 standard setting (Kaufer et al. kau2001 (2001)) with the depolarizer inserted. A 1 slit and a 22 CCD binning were used, yielding an overall spectral resolution (7.5 km s-1). Taking into account the fact that some orders are not useful due to bad signal to noise and/or strong artifacts, good quality spectra were obtained in the spectral ranges 3760–4980 Å, 6700–8510 Å and 8660–10420 Å.
Each exposure was reduced individually using the dedicated UVES pipeline (Ballester et al. bal2000 (2000)) developed within the ESO Munich Image Data Analysis System (MIDAS). Optimal extraction of the spectra was performed, including simultaneous rejection of cosmic ray hits and subtraction of the sky spectrum. Telluric absorption lines were removed for the red setting with the use of observations of telluric standard stars, shifted in velocity according to the different times of the observations and scaled in intensity according to the airmass difference. Additional cosmic ray rejection was done by a detailed comparison of the two exposures, before co-addition and merging. The final 1-D spectrum was rebinned on a vacuum heliocentric scale.
3 Overview of the spectrum
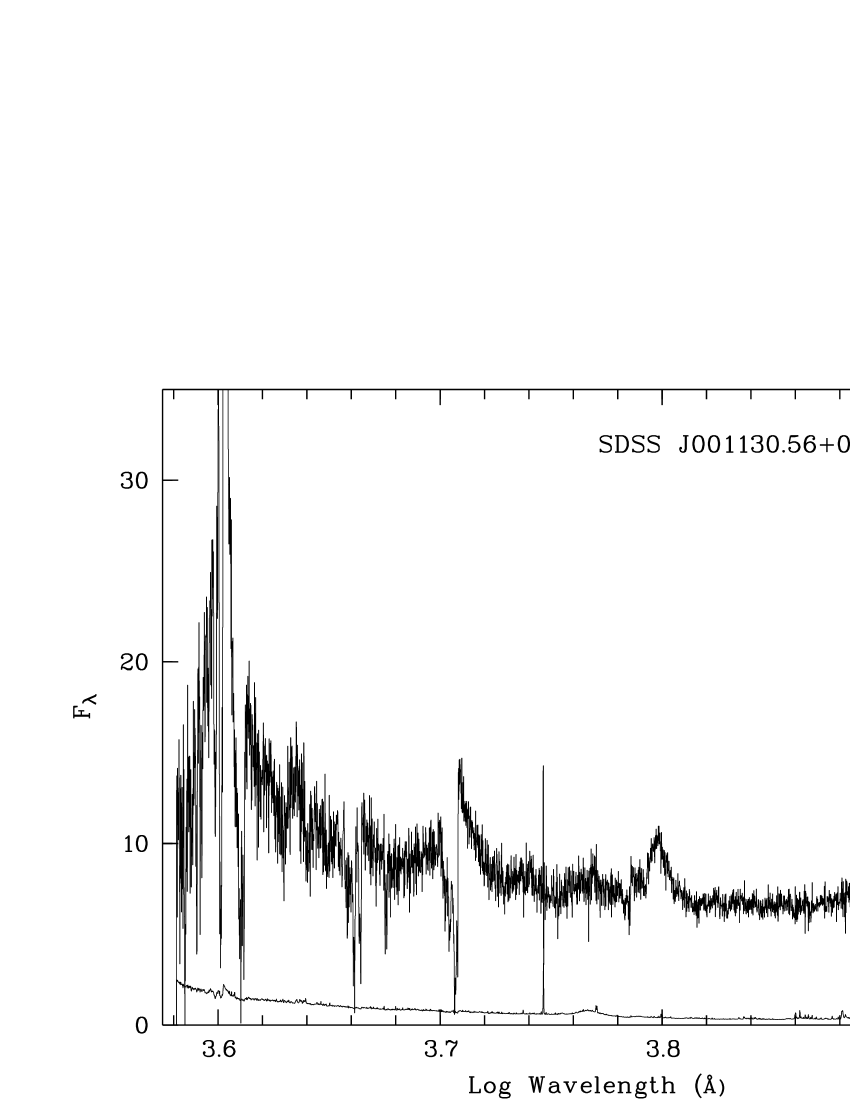
SDSS J00110055 is a high redshift () low-ionization BAL QSO. Since only the rest-frame 1140–1510 Å, 2040–2590 Å and 2630–3160 Å are covered by UVES spectra, C iv 1549 is not observed. We show in Fig. 1 a portion of the SDSS spectrum illustrating this spectral region (Schneider et al. sch2002 (2002)).
From the peak of the Mg ii emission line at 2803 Å in the UVES spectrum, we adopt a systemic redshift of = 2.29263. This is slightly lower than the SDSS redshift of (Schneider et al. sch2002 (2002)), but the SDSS spectrum does not include the Mg ii emission line. The exact value does not particularly matter, since all our discussions are in velocity space.
| System | FWHM | |
|---|---|---|
| A1 | 2.29071 0.00004 | 174 |
| A2 | 2.28724 0.00002 | 27 |
| A3 | 2.28626 0.00003 | 62 |
| B1 | 2.05844 0.00002 | 104 |
| B2 | 2.05740 0.00003 | 24 |
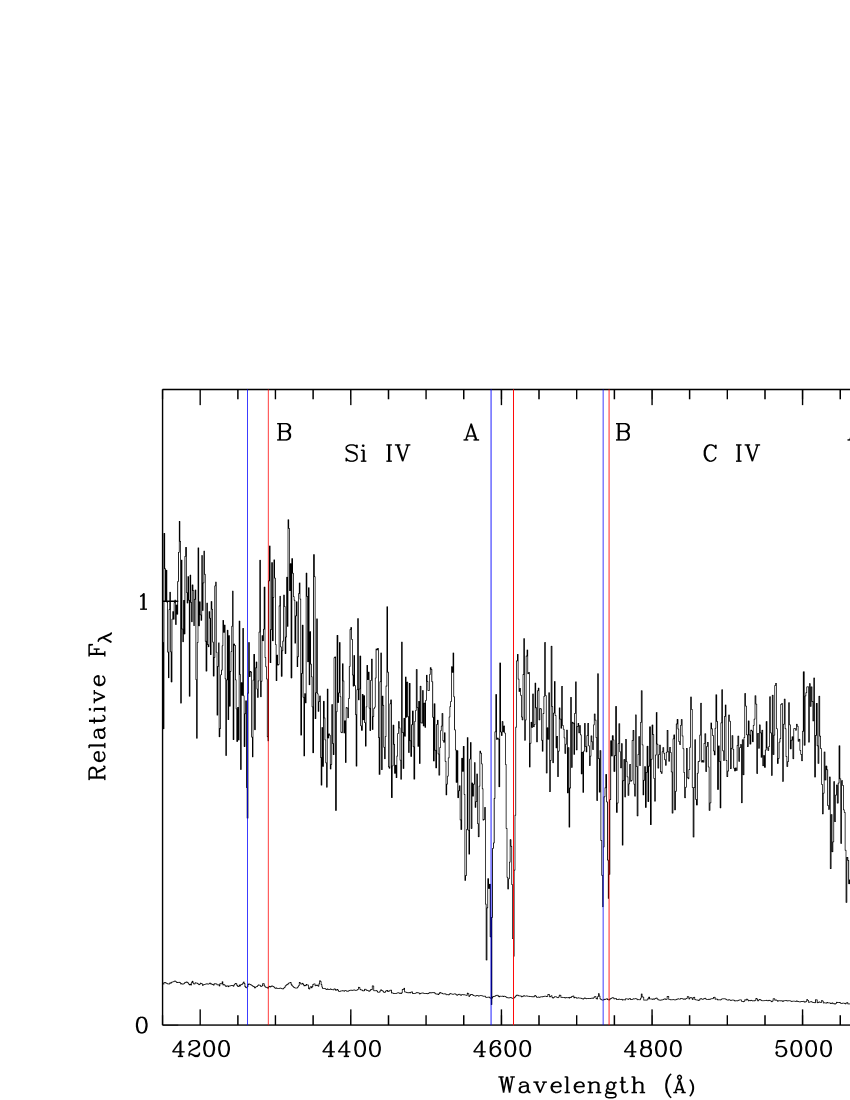
Several narrow absorption line systems may be identified in the UVES spectrum of SDSS J00110055. The characteristics of the systems studied in the present paper are reported in Table 1. FWHM (in km s-1) are measured from the Si iv and C iv lines for which these absorption lines are best seen. System A consists of a cluster of resolved narrow lines at the low-velocity end of the BAL trough seen in the SDSS low resolution spectrum (Fig. 1). It is well defined and resolved in Si iv as well as in Mg ii, making this system well suited for a detailed analysis. The higher velocity components seen in the C iv BAL trough (Fig. 1) appear broad, shallow or blended in the UVES spectrum of Si iv and N v and undetected in Mg ii such that they are not further considered in the analysis. While system A is part of the BAL and superimposed on the broad emission, system B is a high-velocity narrow absorption system well detached from the BAL trough and the broad emission (Fig. 1). Additional (FWHM km s-1) intervening systems are also detected at = 1.77889 in C iv, Si iv and Mg ii, at = 1.77791 in C iv, and at = 0.48727 in Mg ii.
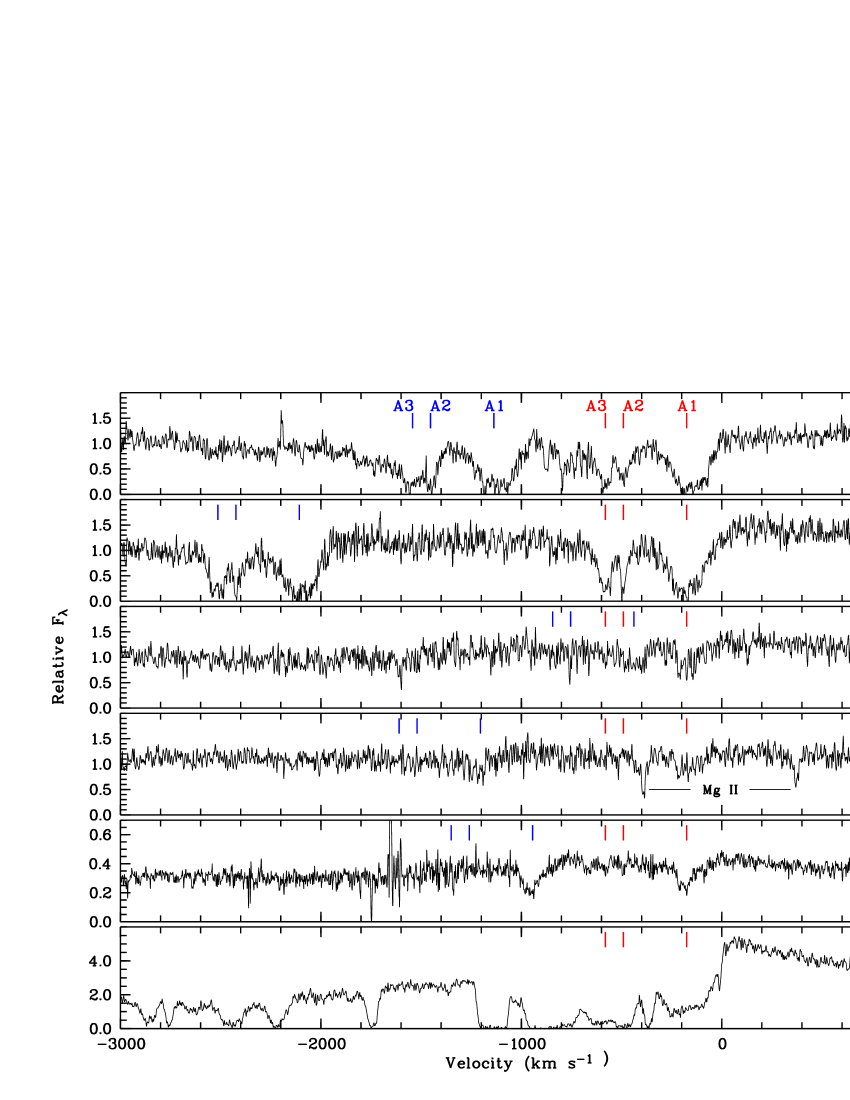
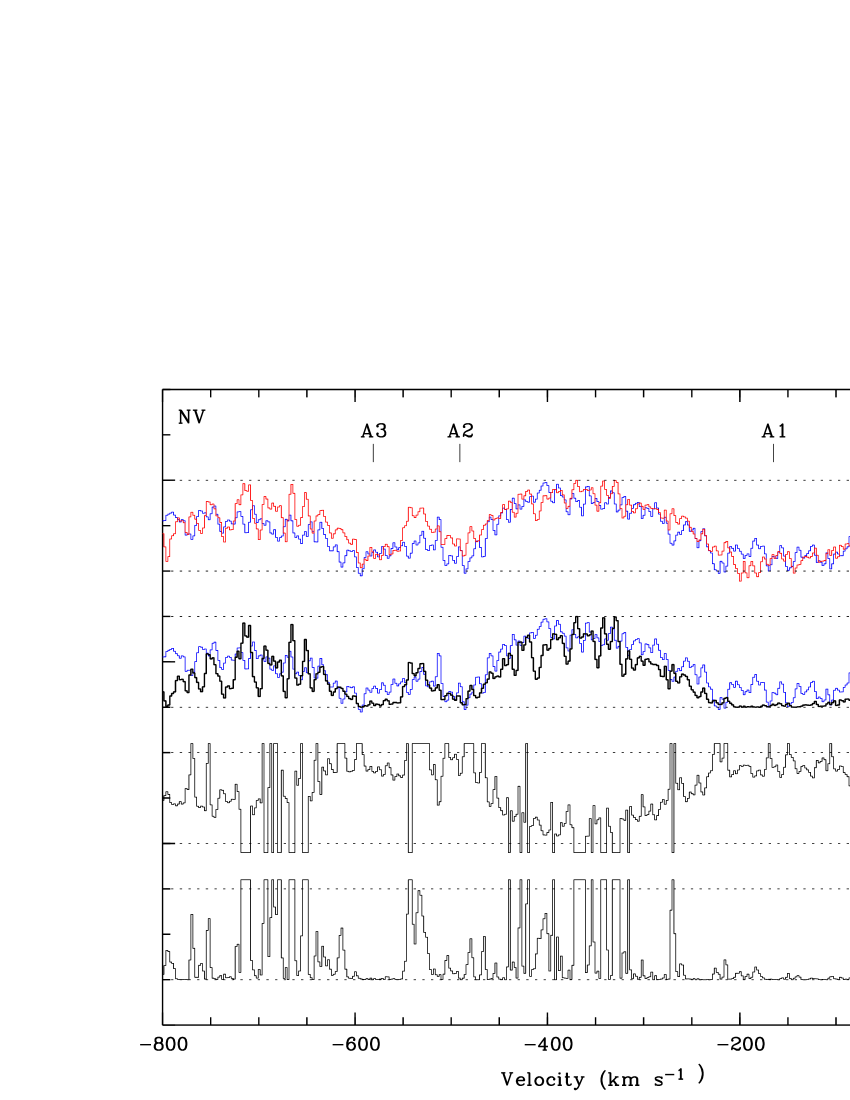
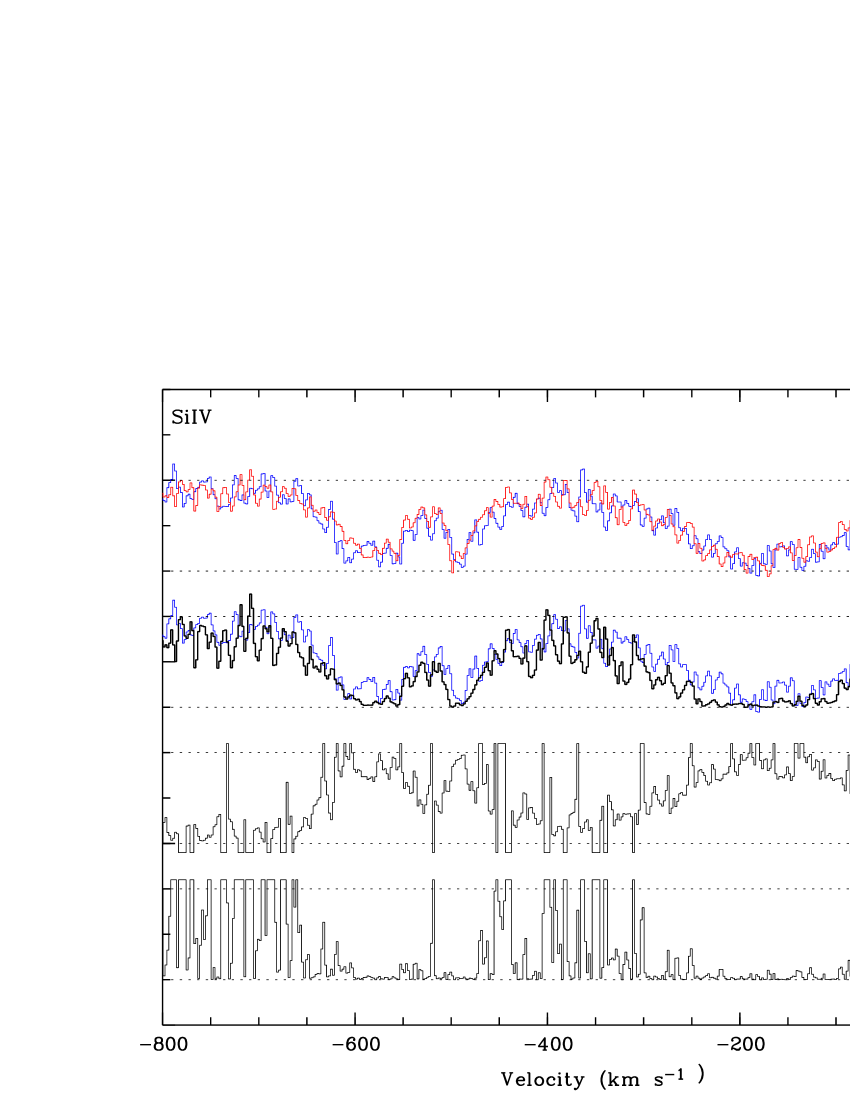
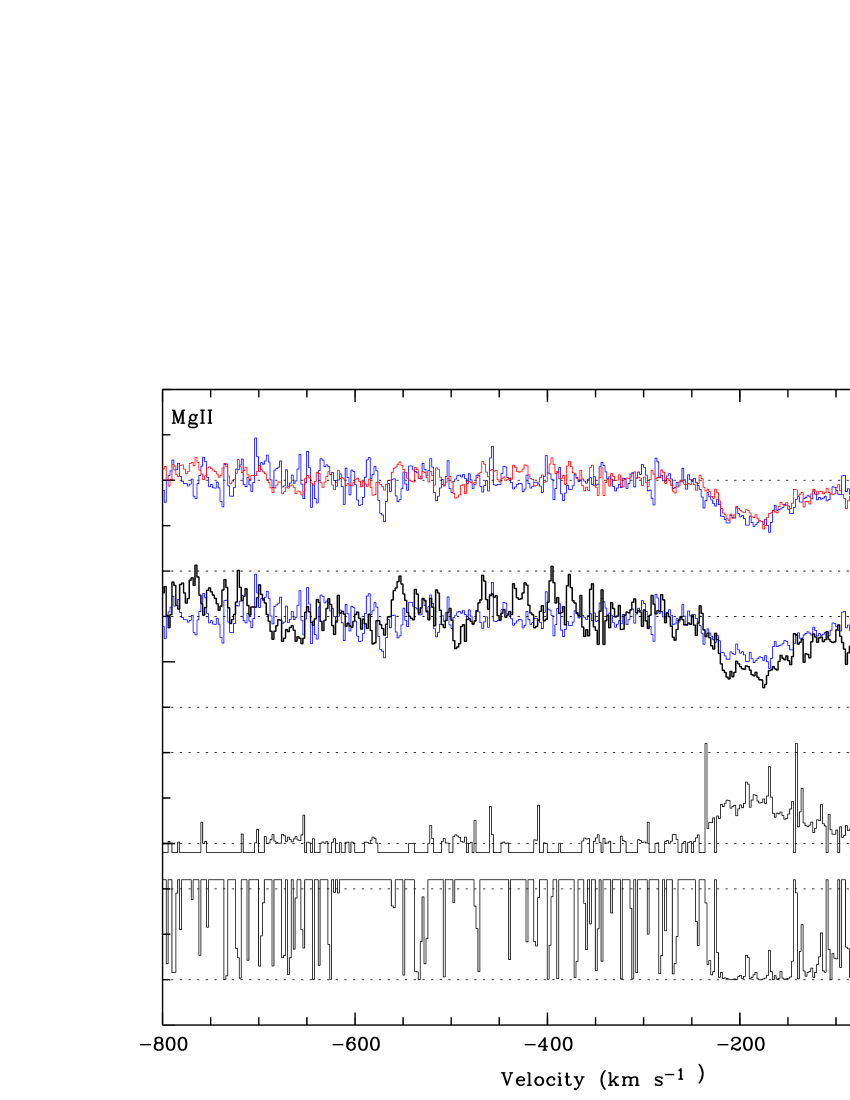
Portions of the UVES spectrum are illustrated in Fig. 2. The absorption system A1 is seen in the high- and low-ionization species N v, Si iv, Mg ii, Si ii, C ii and H i, including Si ii⋆ and C ii⋆ excited states. No Fe ii absorption is detected. The velocity correspondence indicates that all the observed species must be physically associated. Component A1 is definitely broader than the typical thermal velocity width ( 10 km s-1, Barlow & Sargent bar1997a (1997)). No ionization dependent velocity stratification can be observed in this component. Different behavior is seen in components A2 and A3, which are not detected in the low-ionization species but only in N v, Si iv, and Ly. It is worth emphasizing that broad absorption at higher velocity is seen in C iv, Si iv and N v while only the narrow component A1 is clearly detected in Mg ii in agreement with the fact that low-ionization features are more often found at the low-velocity ends of BAL troughs (Voit et al. voi1993 (1993)). Note that the important diagnostic line Mg i 2853 is not detected in SDSS J00110055.
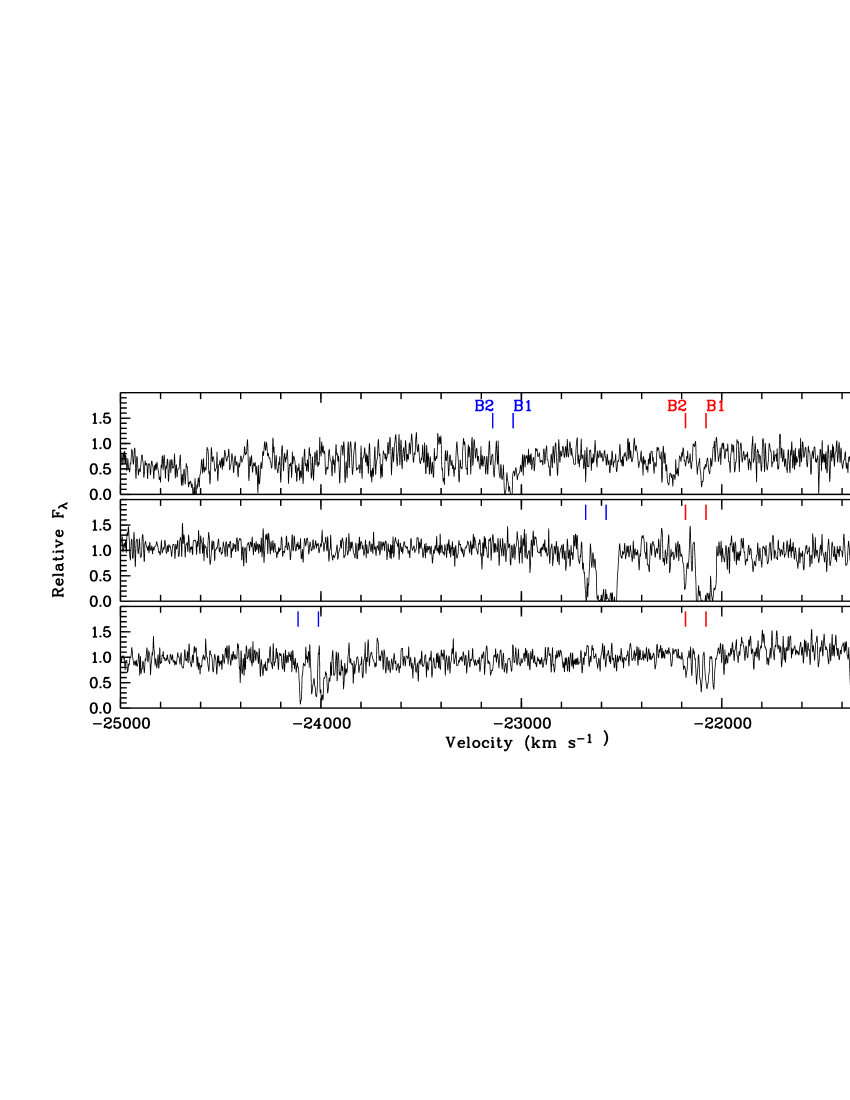
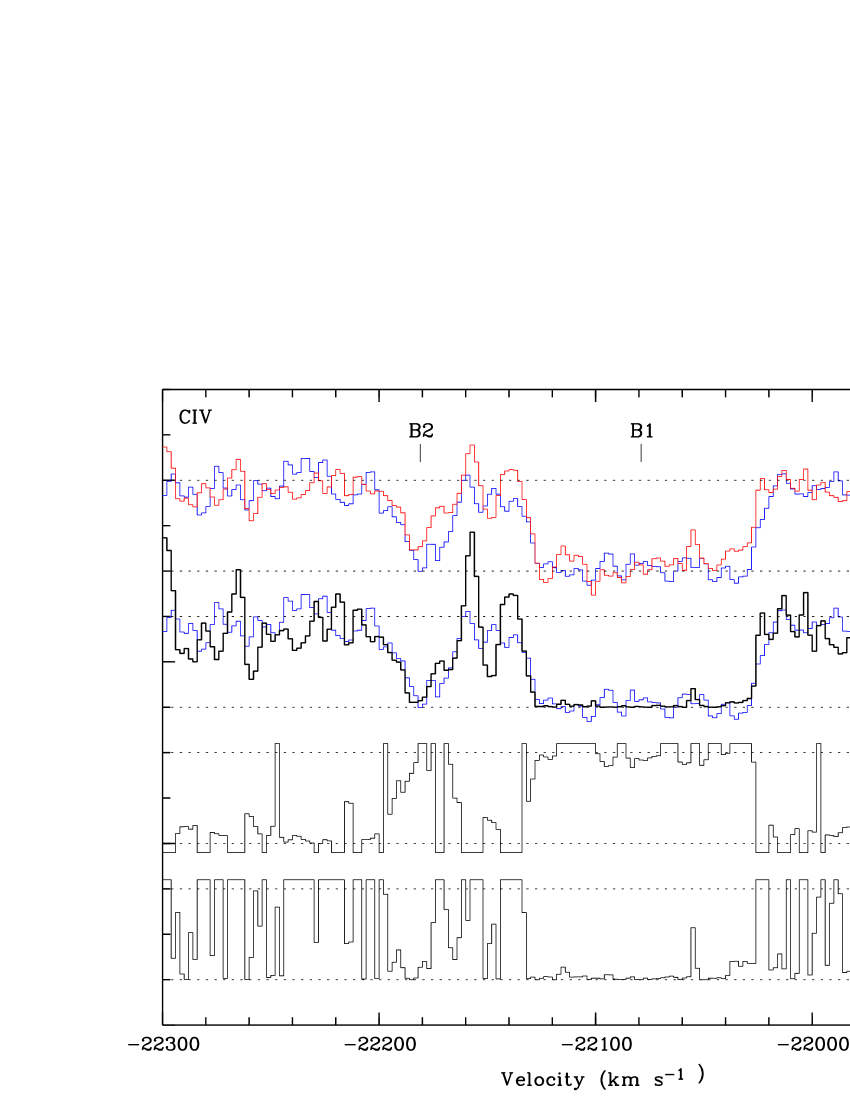
The other interesting feature is the detached narrow absorption system with a velocity 20000 km s-1. This high-velocity system is detected in the high-ionization species only and not in the low-ionization ones (i.e. not in Si ii nor C ii; Mg ii and Ly at 2.05 are not in the observed UVES spectral range). It is relatively narrow and clearly separated from the BAL trough, which reaches only km s-1 (Fig. 1). Two major components (named B1 and B2) are identified in the C iv line, while several narrower (15 – 20 km s-1 FWHM) components form the unsaturated Si iv line. The fact that component B1 is detected in N v is suggestive of an intrinsic origin.
4 Analysis of the spectrum
4.1 Partial line-of-sight covering
The ability to measure unblended features from two lines of the same ion allows us to solve separately for the effective covering factor and real optical depth, and to establish the intrinsic nature of the absorbers (e.g. Barlow & Sargent bar1997a (1997)).
If the absorption region covers a fraction of the quasar light with an optical depth , then for unblended doublet absorption lines we have (e.g. Hall et al. 2003):
| (1) |
from which we derive
| (2) |
where and are the normalized residual intensities in the blue and red lines of the doublet (when the blue line is also the strongest). The solution for –and – is only physical ( when . When , and the line profile is determined solely by the opacity. implies . When , and the line profile is saturated and essentially determined by the covering factor.
This analysis requires the residual intensities to be normalized to the underlying continuum. Since the absorption lines at 2.29 deeply cut the broad emission, we assume that the absorption also covers the emission, and we adopt a local continuum that includes the broad emission. We will see below that this hypothesis is adequate.
4.1.1 The low-velocity absorption system
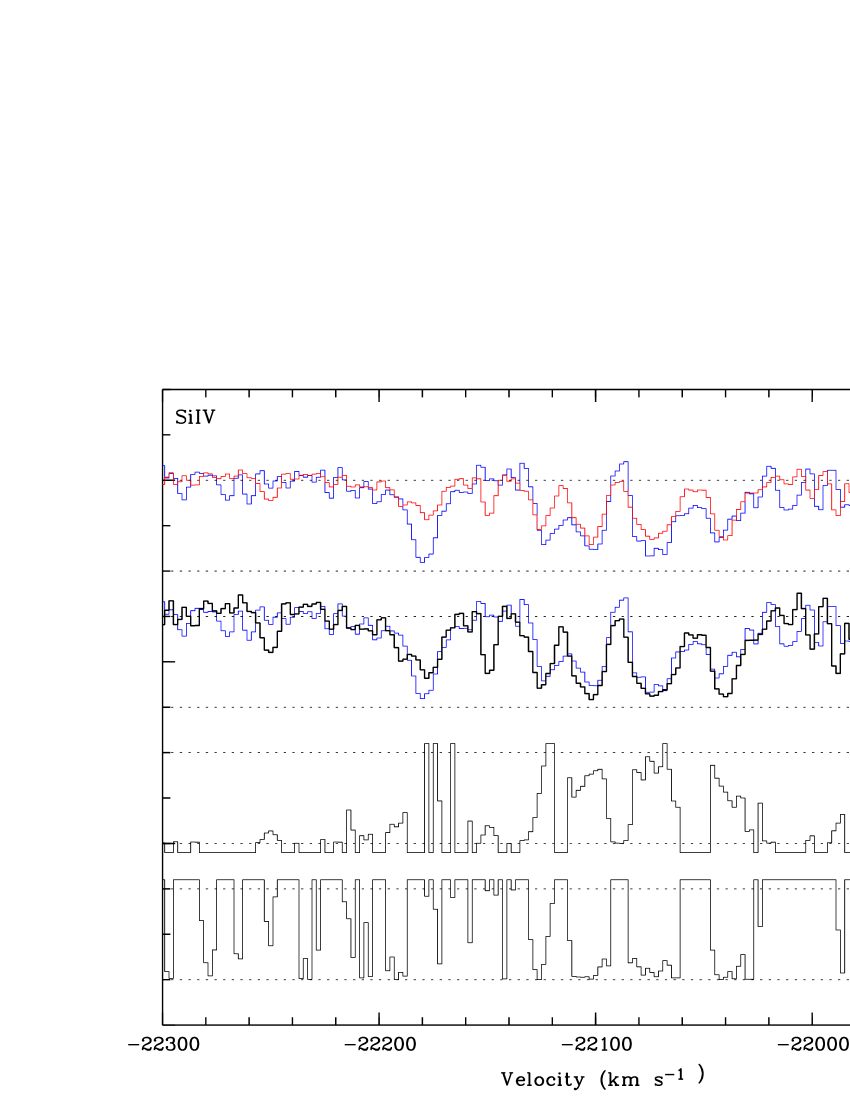
Results for the low-velocity absorption system A are given in Fig. 3. Although some parts of the line profiles are noisy or saturated, a solution to Eqs. (1) - (2) is found for most data points in the absorption profiles, apart from a few relatively narrow “spikes” due to photon noise, incorrect background subtraction, or contamination by other lines. These results are not very sensitive to small modifications to the adopted local continuum.
A clear trend is observed especially in the lowest velocity component A1: the line profiles are mostly determined by the velocity-dependent covering factor while the absorption is completely saturated; remarkably all throughout the profiles. This complete saturation prevents the determination of column densities. For Mg ii and Si iv it is quite clear that the normalized residual intensites and are identical within the uncertainties. Since these intensities were normalized to a local continuum including different amounts of broad emission at the wavelength of each doublet, the absorption must cover part of the broad emission region, justifying our hypothesis a posteriori. Components A2 and A3 in Si iv and N v do follow the same trend, although a spike obviously contaminates the N v profile between components A2 and A3.
The covering factor is also dependent on the ionization. Apart from the fact that the components A2 and A3 are not seen in Mg ii, the covering factor of the Mg ii component A1 reaches a maximum value of only 0.5, smoothly decreasing to lower and higher velocities. For Si iv and N v the derived covering factor has a broader profile with a maximum value reaching nearly complete covering. No significant difference is seen between Si iv and N v.
4.1.2 The high-velocity absorption system
Results for the high-velocity narrow absorption system B are given in Fig. 4. N v data are not illustrated due to the poor signal to noise (Fig. 2). Moreover N v in the higher velocity component B2 is contaminated by intervening Ly absorption, and nothing clear can be derived about its nature.
The C iv B1 component appears black and saturated at all velocities indicating that it must fully cover the continuum emitting region (there is no longer emission at these velocities).
More interesting is the covering factor derived for Si iv. Although the data are noisier than in system A, for the four absorption sub-troughs seen in the B1 component, corresponding to a velocity-dependent covering factor varying between 0.9 and 0.5. This indication of partial covering supports the hypothesis that this high-velocity component is intrinsic to the QSO. Detection of variability would nevertheless be useful to confirm this result.
Confirming the intrinsic nature of this high-velocity narrow component would be interesting: high-velocity NALs are not uncommon but they are rarely seen in BAL QSOs (Hamann et al. 1997a ).
4.2 Absorption from excited levels: electron density and distance to the absorbers
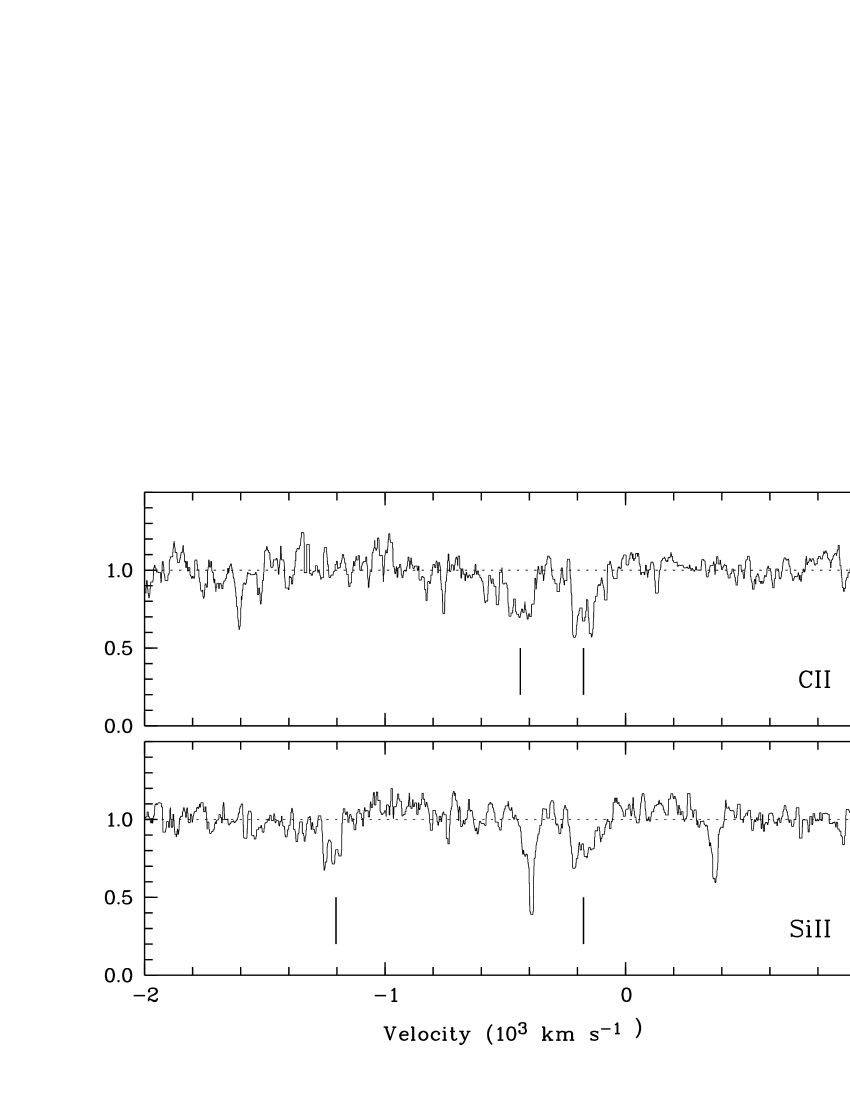
Excited-state narrow absorption lines of C ii⋆ 1335.7 and Si ii⋆ 1264.8 are clearly detected in the component A1 in the spectrum of SDSS J00110055 (Fig. 5). These features arise from ground multiplets that behave approximately as two-level atoms, the level populations being controlled by collisional processes and radiative decays (Bahcall & Wolf bah1968 (1968), Morris et al. mor1986 (1986), Osterbrock ost1989 (1989)). The strength of the absorption lines from the excited fine-structure levels C ii⋆ 1335.7 and Si ii⋆ 1264.8 can be directly compared to the resonance transitions C ii 1334.5 and Si ii 1260.4 in order to estimate the electron density needed to populate the upper level. Note that the very close transitions Si ii⋆ 1264.74 and Si ii⋆ 1265.00 –as well as C ii⋆ 1335.66 and C ii⋆ 1335.71– are considered as a single transition at the -weighted wavelength, keeping in mind that one of the transitions is much stronger. Also note that the weaker transitions Si ii 1304.37 and Si ii⋆ 1309.27 are not detected, despite of confusion with Si iv from absorption system B and an instrumental artifact (seen in all UVES spectra from the observing run), respectively.
The population ratio of the upper excited level 2 to the lower resonance level 1 may be written (Osterbrock ost1989 (1989))
| (3) |
assuming equilibrium between collisional excitation, collisional de-excitation and radiative de-excitation111In principle, excitation by infrared radiation is also possible. However, for this excitation mechanism to be significant, very low electron densities are required, hence extremely large distances of the low-ionization clouds from the photoionization source. Even if the infrared source is extended, this requires infrared flux densities much larger than expected for a typical quasar, and SDSS J00110055, undetected by IRAS, is not an infrared-luminous quasar.. is the radiative de-excitation rate; is the electron density; = and = ; = 2 and = 4 are the statistical weights of levels 1 and 2; is the difference of energy between levels 1 and 2; is the electron temperature; and is the collision strength, which is only slightly dependent on the temperature (e.g. Hayes & Nussbaumer hay1984 (1984)). For Si ii⋆ 1264.8, = 2.13 10-4 s-1, = 5.58, and = 3.56 10-2 eV (corresponding to the fine-structure transition [Si ii] at 34.8 m); for C ii⋆ 1335.7, = 2.29 10-6 s-1, = 2.90, and = 7.86 10-3 eV (corresponding to the fine-structure transition [C ii] at 158 m) (data from Osterbrock 1989, and from The Atomic Line List v2.04).
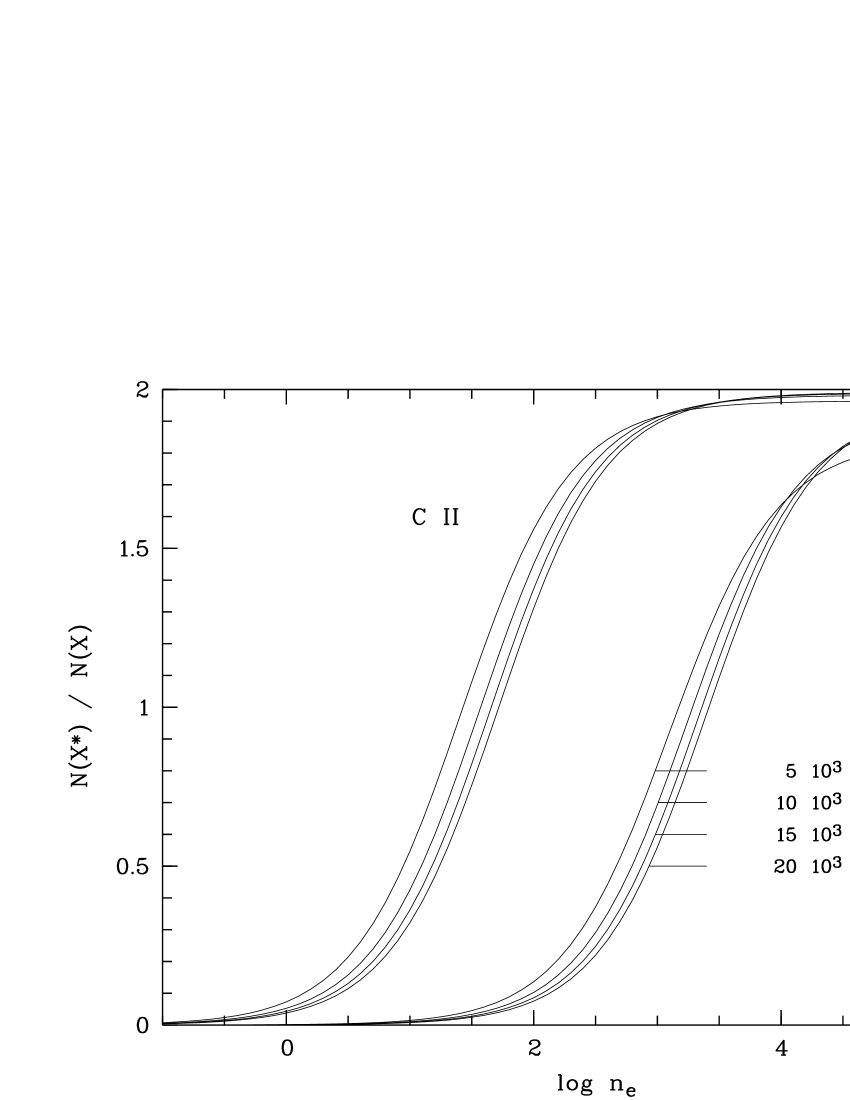
Eq. (3) has been used to compute the C ii and Si ii column density ratios for several values of the electron density and temperature. Results are illustrated in Fig. 6 and can be used as a diagnostic. It is interesting to note that Si ii and C ii are sensitive to different –although overlapping– electron density ranges.
Looking at Fig. 5 we can see that C ii⋆ 1335.7 is stronger than C ii 1334.5 while Si ii⋆ 1264.8 is approximately equal to Si ii 1260.4. Although the signal to noise is not optimal and uncertainties on the location of the continuum are large, we estimate (C ii⋆)/(C ii) 1.60.3 and (Si ii⋆)/(Si ii) 1.10.35. These values were first obtained by integrating the optical depths over the excited- and ground-state line profiles, and then computing their ratio. Also, in order to ensure that the same parts of the profiles are considered, the optical depth ratio was computed as a function of the velocity, and then the mean ratio evaluated. Both methods give similar results. The uncertainties are estimated by considering the ratios obtained with these two methods, as well as various binning values and locations of the underlying continuum.
According to Fig. 6, the measured values roughly agree within the uncertainties to indicate an electron density 3, the value derived from C ii being smaller than the one derived from Si ii. The overall agreement between the C ii and Si ii behaviors supports the assumptions underlying Eq. (3). However, these column density ratios have been computed assuming complete covering (), which is most probably not true. When there is partial covering, unabsorbed flux is added to the line profiles with the result that intensity differences between two lines are attenuated. Correcting for partial covering will restore these differences. Taking partial covering into account could then increase (C ii⋆)/(C ii) and decrease (Si ii⋆)/(Si ii), which would result in a better agreement between the electron densities derived from both species. In the following we conservatively adopt , the lower and higher values corresponding to the values obtained from C ii and Si ii respectively, with K.
With the reasonable assumption that the gas is in photoionization equilibrium with the quasar radiation field, the electron density can be combined with the ionization parameter to estimate the distance between the absorber and the quasar. Hamann et al. (ham2001 (2001)) give
| (4) |
where is the luminosity density at the Lyman limit, is the total hydrogen density, and the power-law spectral coefficient in the Lyman continuum. The ionization parameter is constrained by the simultaneous presence of Mg ii and N v in the narrow component A1, which requires for ionization fractions for both ions, according to the calculations of Hamann & Ferland (ham1999 (1999)). We adopt for ease of comparison with Hamann et al. (ham2001 (2001)). We estimate 2.5 1030 ergs s-1 Hz-1 by extrapolating the flux measured in the low-resolution SDSS spectrum (assuming a cosmology with = 70 km s-1 Mpc-1, , and , Pen et al. pen1999 (1999)). Adopting , and , again for ease of comparison with Hamann et al. (ham2001 (2001)), we find a distance 9 kpc 37 kpc. This range of values reflects only the uncertainties on ; the distance would be 30% smaller if we had used . We emphasize that this distance is only a rough estimate, and in particular relies upon the assumption of a uniformly dense outflow, as discussed in the next section.
5 Discussion and Conclusions
One of the main results of our study is that the narrow absorption components seen at the low-velocity end of the BAL troughs are completely saturated, their profiles being dominated by the covering factor. Velocity and ionization dependent partial covering is often seen in NALs (Barlow & Sargent bar1997a (1997), Hamann et al. ham2001 (2001)), and has also been reported for mini-BAL and BAL QSOs (Arav et al. ara1999b (1999), Srianand & Petitjean sri2000 (2000), de Kool et al. dek2001 (2001), 2002b , Hall et al. hal2003 (2003)). The partial covering proves the intrinsic nature of the absorbers.
However, our most intriguing result is the distance between the ionizing source and the absorber that we derived on the basis of the excited lines. BALs are usually thought to be formed much closer to the central engine, at distances 0.1 – 1 pc, roughly four to five orders of magnitude smaller than the distance of 20 kpc we have measured. Our estimate is clearly uncertain, but the errors cannot explain such a large difference.
Note that the C ii⋆ and Si ii⋆ must be related to the other absorption features. The correspondence in velocity of the high- and low-ionization features in component A1 (Figs. 2 and 5) clearly indicate that all species must form at roughly the same location. Also, the continuity of the opacity and covering factor properties towards the higher velocity components A2 and A3 (Fig. 3) suggests a common formation for these components too. The components of the absorbing system A are definitely part of the BAL outflow because of their association with the high-ionization features seen in the wider C iv BAL (cf. the SDSS low-resolution spectrum in Fig. 1).
It is therefore likely that the BAL formation region (BALR) in SDSS J00110055 — at least for component A — is at much higher distance than commonly thought. In fact, small BALR distances are based more on theoretical considerations than on direct observational evidence. Here we summarize the few direct estimates that have been made of the distances to confirmed intrinsic outflows; all distances have been converted to our cosmology (Sect. 4.2).
Two NALs that have undergone time variability have thereby confirmed themselves as intrinsic and yielded upper limits to their distances in the kiloparsec range: 1 kpc in UM 675 (Hamann et al. 1997b ), and 2 kpc in QSO 2343+125 (Hamann et al. 1997c ).
Large distances have been inferred from the presence of C ii⋆ or Si ii⋆ absorption in two other NALs which are known to be intrinsic absorbers due to partial covering: 20 kpc for 3C 191 (Hamann et al. ham2001 (2001))222Note that 3C 191 is a radio-loud quasar, whereas SDSS J00110055 is radio-quiet by virtue of its non-detection in the FIRST survey (Becker et al. bwh1995 (1995)). Absorbers apparently can be found at large distances from the ionizing source in both RLQs and RQQs., and 570 pc for APM 08279+5255 (Srianand & Petitjean sri2000 (2000)).
A related but distinct technique is the use of numerous Fe ii absorption lines to estimate absorber distances. Using this method, 310 pc has been measured for the low-velocity system in FIRST J084044.5+363328, whereas 1.35 pc is found for the high-velocity system in the same object using different diagnostic (de Kool et al. 2002b ). However, analysis of the similar NAL in FIRST J121442.3+280329 yielded a small distance range 1 – 30 pc for the entire outflow (de Kool et al. 2002a ), similar to that found for LBQS 0059-2735 (Wampler et al. wam1995 (1995)). The largest distance found by this method has been for the low-ionization BAL in FIRST J104459.6+365605 (de Kool et al. dek2001 (2001)). On the basis of excited Fe ii lines and velocity correspondence between Fe ii and Mg ii lines, 630 pc was found. We emphasize that – again based on velocity correspondence – our high distance estimate in SDSS J00110055 also applies to the high-ionization absorbers and not only to the low-ionization ones, as found in FIRST J104459.6+365605.
However, Everett et al. (eka2002 (2002)) model a multiphase outflow at only 4 pc that can reproduce the observations of FIRST J104459.6+365605, including the density measurements used by de Kool et al. to infer a much larger distance. In their model the intrinsic outflow does not have a constant density, but instead consists of a relatively low-density, high-ionization wind with embedded higher-density, lower-ionization clouds. Absorption in the high-ionization wind modifies the spectrum seen by the outer region of the wind and the low-ionization clouds, effectively reducing the value of in Eq. (4) and thereby decreasing the inferred distance. The ionization and density in the wind decrease with increasing distance until species such as Fe ii and Mg ii are present at the required . Denser clouds embedded in the flow at that distance are invoked to produce Mg i absorption at the same velocities as Fe ii and Mg ii.
Everett et al. claim that a multiphase outflow at a small distance from the ionizing source could also explain the absorption in 3C 191. Hamann et al. do in fact state that the outflow in 3C 191 must span a range of densities (or distances) to explain the presence of N v and Mg i at the same velocities. A range of densities could also be present in SDSS J00110055 but is not required, because Mg i is not detected. In any case, the density diagnostics used to infer large absorber distances in SDSS J00110055 and 3C 191 are different than those used in FIRST J104459.6+365605. Therefore, detailed modeling should be done to determine whether or not a multiphase outflow at small distances can indeed reproduce the observed densities, column densities and velocity structure of all ions observed in these objects. A further observational test of a multiphase model for SDSS J00110055 and 3C 191 could come from spectra extending shortward of Ly past the Lyman limit, directly measuring and constraining any modification of the spectrum by the inner wind. It would also be worth monitoring objects with large inferred distances, to search for time variable NALs which could require much smaller distances.
If they are confirmed, large distances from the continuum source and the broad emission line region may be difficult to reconcile with the evidence of velocity and ionization dependent partial covering in these absorbers. On the one hand, partial covering implies only that the projected size scale of the absorber is less than or comparable to that of the emitting region. That inferred size for the absorber is independent of the distance from the source, as long as the distance is small compared to the angular diameter distance to the quasar. Partial covering by outflows at kpc-scale distances is therefore possible, at least in principle. However, it is difficult to understand how such distant outflows could be common, for several reasons. The usual problems of cloud (or density inhomogeneity) survival and confinement (e.g. Hamann et al. ham2001 (2001), de Kool et al. dek2001 (2001)) are exacerbated by the requirement that such structures must survive for the time needed to reach such large distances. Also, if such outflows are seen in 10% of quasars, they cover somewhere between 10% of the unobscured lines of sight around all quasars and all such sightlines in 10% of quasars at distances of 10 kpc, implying outflows of very large masses (; Hamann et al. ham2001 (2001)).
It is worth noting that the observed partial covering may in fact be due to additional emission from an extended region of scatterers comparable in size to the BALR. Such a region has already been suggested to explain spectropolarimetric measurements (Cohen et al. coh1995 (1995), Goodrich & Miller goo1995 (1995)) but its size and location have never been directly measured. Resonance scattering in a roughly axially symmetric BALR could also explain abnormal doublet line ratios usually interpreted as partial covering (e.g. Branch et al. bra2002 (2002)). Spectropolarimetry could provide some tests of these hypotheses.
Whether our results are generic to BAL QSOs is not clear. The objects for which BALR sizes have been measured so far show absorption somewhat intermediate between mini-BALs and BALs, rather than the very wide and deep troughs often seen in BAL QSOs. Perhaps these intermediate objects have different outflows, or represent an older evolutionary stage of the BAL QSO phenomenon when most of the material has dissipated, preferentially leaving behind denser clumps.
Clearly these results are puzzling and raise many questions. To determine the range of distances spanned by intrinsic outflows will require detailed study of other, similar objects with C ii⋆ and Si ii⋆ absorption, including photoionization modeling to determine if multiphase models can explain such outflows.
Acknowledgements.
We acknowledge use of data from the Atomic Line List v2.04 (http://www.pa.uky.edu/peter/atomic/). PBH acknowledges support from Fundación Andes. Funding for the creation and distribution of the SDSS Archive has been provided by the Alfred P. Sloan Foundation, the Participating Institutions, the National Aeronautics and Space Administration, the National Science Foundation, the U.S. Department of Energy, the Japanese Monbukagakusho, and the Max Planck Society. The SDSS Web site is http://www.sdss.org/. The SDSS is managed by the Astrophysical Research Consortium (ARC) for the Participating Institutions. The Participating Institutions are The University of Chicago, Fermilab, the Institute for Advanced Study, the Japan Participation Group, The Johns Hopkins University, Los Alamos National Laboratory, the Max-Planck-Institute for Astronomy (MPIA), the Max-Planck-Institute for Astrophysics (MPA), New Mexico State University, University of Pittsburgh, Princeton University, the United States Naval Observatory, and the University of Washington.References
- (1) Arav, N., Korista, K.T., de Kool, M., et al., 1999, ApJ, 516, 27
- (2) Bahcall, J.N., Wolf, R.A., 1968, ApJ, 152, 701
- (3) Ballester, P., Modigliani, A., Boitquin, O., et al., 2000, The Messenger, 101, 31
- (4) Barlow, T.A., Sargent, W.L.W., 1997, AJ, 113, 136
- (5) Barlow, T.A., Hamann, F., Sargent, W.L.W., 1997, In: Arav N., Shlosman I., Weymann R.J. (eds), Mass Ejection from Active Galactic Nuclei, ASP Conf. Ser. Vol. 128, p. 13
- (6) Becker, R.H., White, R.L., Helfand D.J., 1995, ApJ, 450, 559
- (7) Blanton, M.R., Lupton, R.H., Miller Maley, F., et al., 2003, AJ, in press (astro-ph/0105535)
- (8) Branch, D., Leighly, K., Thomas, R.C., Baron, E., 2002, ApJ, 578, L37
- (9) Cohen, M.H., Ogle, P.M., Tran, H.D., et al., 1995, ApJ, 448, L77
- (10) Churchill, C.W, Schneider, D.P., Schmidt, M., Gunn, J., 1999, AJ, 117, 2573
- (11) de Kool, M., Arav, N., Becker, R.H., et al., 2001, ApJ, 548, 609
- (12) de Kool, M., Becker, R.H., Gregg, M.D., et al., 2002a, ApJ, 567, 58
- (13) de Kool, M., Becker, R.H., Arav, N., et al., 2002b, ApJ, 570, 514
- (14) Everett, J., Königl, A., Arav, N., 2002, ApJ, 569, 671
- (15) Fukugita, M., Ichikawa, T., Gunn, J.E., et al., 1996, AJ, 111, 1748
- (16) Goodrich R.W., Miller J.S., 1995, ApJ, 448, L73
- (17) Gunn, J.E., Carr, M., Rockosi, C., et al., 1998, AJ, 116, 3040
- (18) Hamann, F., Barlow, T.A., Cohen, R.D., et al., 1997a, In: Arav N., Shlosman I., Weymann R.J. (eds), Mass Ejection from Active Galactic Nuclei, ASP Conf. Ser. Vol. 128, p. 19
- (19) Hamann, F., Barlow, T.A., Junkkarinen, V., Burbidge, E.M., 1997b, ApJ, 478, 80
- (20) Hamann, F., Barlow, T.A., Junkkarinen, V., 1997c, ApJ, 478, 87
- (21) Hamann, F., Ferland, G.J., 1999, ARA&A, 37, 487
- (22) Hamann, F., Barlow, T.A., Chaffee, F.C., et al., 2001, ApJ, 550, 142
- (23) Hall, P.B., Anderson, S.F., Strauss, M.A., et al., 2002, ApJS, 141, 267
- (24) Hall, P.B., Hutsemékers, D., Anderson, S.F., et al., 2003, ApJ, 593, 189
- (25) Hayes, M.A., Nussbaumer, H., 1984, A&A, 134, 193
- (26) Hewett, P.C., Foltz, C.B., 2003, AJ, 125, 1784
- (27) Hogg, D. W., Finkbeiner, D.P., Schlegel, D.J., and Gunn, J.E. 2001, AJ, 122, 2129
- (28) Kaufer, A., D’Odorico, S., Kaper, L., 2001, UV-Visual Echelle Spectrograph (UVES) User Manual, European Southern Observatory
- (29) Lupton, R.H., Gunn, J.E., and Szalay, A.S. 1999, AJ, 118, 1406
- (30) Morris, S.L., Weymann, R.J., Foltz, C.B., et al., 1986, ApJ, 310, 40
- (31) Osterbrock, D.E. 1989, Astrophysics of Gaseous Nebulae and Active Galactic Nuclei (Mill Valley: University Science Press)
- (32) Pier, J.R., Munn, J.A., Hindsley, R.B., et al., 2003, AJ, 125, 1559
- (33) Pen, U., 1999, ApJS, 120, 49
- (34) Reichard, T.A., Richards, G.T., Schneider, D.P., et al., 2003a, AJ, 125, 1711
- (35) Reichard, T.A., Richards, G.T., Hall, P.B., et al., 2003b, AJ, submitted
- (36) Richards, G.T., Fan, X., Newberg, H.J., et al., 2002, AJ, 123, 2945
- (37) Schneider, D.P., Richards, G.T., Fan, X., et al., 2002, AJ, 123, 567
- (38) Smith, J.A., Tucker, D.L., Kent, S., et al., 2002, AJ, 123, 2121
- (39) Srianand, R., Petitjean, P., 2000, A&A, 357, 414
- (40) Stoughton, C., Lupton, R.H., Bernardi, M., et al., 2002, AJ, 123, 485
- (41) Voit, G.M., Weymann, R.J., Korista, K.T., 1993, ApJ, 413, 95
- (42) Wampler, E.J., Chugai, N.N., Petitjean, P., 1995, ApJ, 443, 586
- (43) Weymann, R.J., Morris, S.L., Foltz, C.B., Hewett, P.C., 1991, ApJ, 373, 23
- (44) York, D. G., Adelman, J., Anderson, J. E., et al., 2000, AJ, 120, 1579