Hot Dust in Radio-Loud Active Galactic Nuclei
Abstract
We have measured mid-infrared (MIR) fluxes of 3C sources on images taken with ISOCAM onboard the Infrared Space Observatory (ISO). The photometric data were combined with existing photometry at other wavelengths to assemble the spectral energy distribution (SED) for each galaxy from infrared to radio wavelengths. In addition, we used ISOPHOT spectra to compute average MIR spectra for different types of Active Galactic Nuclei (AGNs). The MIR emission of 53 of our sources shows evidence of dust. We find a clear correlation between the SEDs, emission from polycyclic aromatic hydrocarbons (PAHs), and the type of AGN. Specifically, we find that in broad emission line radio galaxies (BLRGs), the dust emission peaks at m and PAH bands are weak, whereas emission in comparable narrow line radio galaxies (NLRGs) peaks at a longer wavelength of m and the PAH bands are much stronger. Although less pronounced, a similar trend is seen when comparing quasars (QSOs) with high-luminosity NLRGs. We used dust radiative transfer models with a central heating source to describe the SEDs. The difference in the dust emission appears to be the effect of heating by radiation from the central engine. In type 1 AGNs (BLRGs and QSOs), the broad line region (BLR) is directly visible and therefore hot () dust dominates the emission. In this region, PAHs are destroyed which explains the weak PAH emission. On the other hand, the BLR is hidden in type 2 AGNs (NLRGs). Their SEDs are therefore dominated by cooler dust including PAHs.
1 Introduction
The widely accepted paradigm for the power source of AGNs is a massive black hole. In this picture, accretion of dust and gas powers the AGN. Beamed radiation escapes from the central engine and affects the surrounding gas and dust. The effect on gas can directly be observed in close-by AGNs through the spatial separation of ionized and neutral gas (e.g. Tadhunter and Tsvetanov 1989, Prieto and Freudling 1993). The impact of this radiation on dust, if present, is expected to be similarly dramatic. The intense radiation field in the immediate vicinity of the central engine prevents dust from forming and evaporates any dust approaching that region. In this region, PAHs cannot exist. At somewhat larger distances from the nucleus, the radiation field heats the dust to just below its evaporation temperature. Dust at such distances will have temperatures of about 1500K. Cold dust () should exist only at distances greater than several hundred pc to a few kpc. At intermediate distances, a region should exist were large quantities of dust are significantly heated by the AGN to temperatures of a few hundred Kelvin and should therefore be detectable at MIR wavelengths.
Unfortunately, detailed mapping of dust temperatures in AGN host galaxies is not feasible at present. Our knowledge of dust in 3C sources is therefore based on low spatial resolution photometry. Observations with the Infrared Astronomical Satellite (IRAS) showed that 3C sources which are bright at m are typically much fainter or not detectable at m (Heckman et al., 1994, and references therein). This signature of cold dust is also seen in the more recent data presented by Meisenheimer et al. (2001). Heckman et al. (1994) find that the NLRGs are about a factor of 4 to 5 fainter in the MIR than BLRGs, but are similar to BLRGs at m. These differences are qualitatively consistent with unification schemes since hotter dust is visible in BLRGs due to their viewing angle.
ISOCAM was more than an order of magnitude more sensitive than IRAS at MIR wavelengths. It was able to detect the hot dust component in 3C sources at much higher redshifts and therefore expand comparison of type 1 and 2 AGNs to a much wider range of luminosities. In this letter, we report first results from a program to investigate the hot dust component in 3C sources based on ISOCAM observations. A detailed discussion of our data reduction and modelling procedures as well as a full presentation of our data are deferred to a later paper (Siebenmorgen et al., 2003a, hereafter SFKH).
2 Observations and Data Reduction
2.1 The Sample
The goal of our program is to investigate dust emission in AGNs, and in particular to search for differences related to the orientation of the central engine. Constraining the SED emission of both hot and cold dust requires infrared photometry covering the full wavelength range from m to mm wavelengths. We used the 3CR catalogue as our parent catalogue because its 178 MHz selection should be essentially unbiased in its inclusion of AGNs at different viewing angles. In addition, photometric measurements at far infrared (FIR) and mm wavelengths are available for large subsamples of the catalogue (e.g. Meisenheimer et al., 2001; Haas et al., 2003b). By complementing these available data with our new MIR measurements, we were able to construct SEDs from optical to mm wavelengths.
We have compiled our sample by cross-correlating the position of 3C sources with the list of ISOCAM observations available from the ISO post mission archive. We then extracted all ISOCAM images which potentially include 3C sources. Each reduced image was visually inspected and the pointing of the spacecraft was verified using stellar and other sources contained in the images. We report here on that subsample of our data for which the combined ISOCAM photometry, data from the literature and ISOPHOT photometry by Haas et al. (2003b) suffice to constrain the full infrared SED of our sources.
2.2 Data Reduction
ISOCAM images in the ISO archive have been obtained for a variety of programs and purposes and therefore vary in depth, resolution, used wavelength band and dither strategy. We re-processed the raw data using a common set of procedures aimed at obtaining the best possible calibration and homogeneity of our photometric measurements. We followed the ISOCAM handbook (Blommaert et al., 2001) and used the CIA software (Ott et al., 2000) to subtract darks, remove cosmic rays hits, remove the effect of flux transients, and finally flatfield, re-sample and co-add the individual exposures. The typical useful field of view of the images is about sampled with pixels. Most of the detected 3C sources were not or only barely spatially resolved by ISOCAM. In those cases, apertures with a radius of 10 arcsec were used, and aperture losses were modelled using synthetic point spread functions (Okumura, 1998). For extended sources, we chose apertures which measure the spatially integrated flux of the source.
For most 3C sources, photometric information at optical, near-infrared and/or far-infrared, and mm wavelengths is available. We compiled SEDs between 0.5 and 1300 m for all sources in our sample using data listed in the NASA Extragalactic Database (NED), the ISOPHOT measurement given in Haas et al. (2003b) and other recent papers (see SFKH). In compiling the SEDs, we only used photometric data which includes, like our own ISOCAM photometry, the integrated flux from the whole host galaxy. For each SED, we estimated the contribution of synchrotron radiation to the MIR fluxes by extrapolating the radio core flux. We found that the synchrotron radiation is a negligible contribution to the MIR flux for all SEDs used in this paper.
3 Results
We retrieved ISOCAM images for a total of 88 sources. The rms noise in the reduced images ranges from 0.5 to 5 mJy. We detected a total of 71 galaxies. The high detection rate indicates that hot dust is common in radio-loud AGNs, and that 3C sources are bright enough in the MIR so that they will be readily accessible to detailed studies by future instruments such as SIRTF.
A steep rise of the flux from optical wavelengths below 1m to the MIR indicates the presence of a significant amount of dust at K for a large fraction of our sample. In order to estimate the contribution of stars to the MIR, we fitted 4000K black body spectra to the short wavelength part of the SEDs. This temperature deliberately was taken to be on the low side of the range of possible average stellar temperatures so that the MIR emission attributed to stars is an upper limit. Taking this stellar contribution into account, we found clear evidence of dust in 53 sources, i.e. 60% of our initial sample. The highest redshift source with a clear detection of hot dust is 3C324 at a redshift of 1.2. For a total of 27 sources, our data suffice to construct SEDs. The measured ISO fluxes for them are presented in table 1.
4 SED Modelling
Interpretation of the IR spectra requires detailed knowledge of the energy sources and the distribution and composition of gas and dust which absorbs and re-transmits the radiation. In the case of the AGNs discussed in this paper, the primary energy source is the central engine in the nucleus enshrouded by dust clouds. Dust close to the nucleus absorbs the radiation from the nucleus and re-radiates it. This emission depends mostly on the total power and spectrum of the central engine, and the distribution and properties of dust. While the composition of the dust can reasonably assumed to be similar to local dust and is therefore well constrained, its distribution around the power source of the AGN is largely unknown. It is generally assumed that the geometrical distribution of dust around AGNs is similar to a torus or warped disk (e.g., Urry and Pdovani, 1995). However, observations of dust features close to the nucleus of AGNs with the HST reveal a variety of morphologies (Martel et al., 2000). These observations and the fact that dust at distance much larger than the size of the putative torus shapes the MIR spectrum (Farrah et al., 2003) motivated us to adopt a simple approach to the modelling of dust SEDs in AGNs. Instead of choosing between possible geometrical configurations, we carried out spherical radiative transfer calculations with a central heating source. In this approach, the size of the model sphere depends on the viewing angle because of the intrinsic asymmetry of AGNs. We used a power law between Å and m as the input spectrum of the central sources. The exciting radiation field is therefore significantly harder than for star bursts leading to stronger photo-destruction of small grains (Siebenmorgen, R. et al., 2003b). Had we used a more distributed source of energy within the nucleus, the predicted PAH emission would have been much stronger.
We numerically solved the radiative transfer equations for a grid of models, varying the total luminosity of the central engine, the total extinction and the outer radius of the dust clouds. The dust in our model consists of carbon grains, silicate grains and PAHs. The initial density within the sphere is constant, but dust evaporation and PAH destruction are taken into account in a self-consistent way. We computed model SEDs for outer radii ranging from 0.125 to 16kpc, luminosities ranging from to L⊙, and visual extinction ranging from 1 to 128 magnitudes. The full set of models is available at http://eso.org/~rsiebenm/agn_models.html. The parameters of the best fitting model for each observed SED are listed in table 1. In our modelling, all emission from the central engine is reprocessed by dust. The input power to our models is therefore identical to the total dust luminosity, which we use below to divide our sample into subsamples.
5 Discussion
5.1 Averaged SEDs
In order to investigate differences in dust emission for AGNs of type 1 and 2, we divided our sample into four different subsamples. Type 1 AGNs were subdivided into BLRGs and QSOs. Type 2 AGNs with dust luminosities fainter then L⊙were assigned to a low luminosity NRLG subsample, and those which are as bright or brighter than this limit to an equivalent high luminosity subsample. This luminosity limit was chosen so that the average dust luminosities of the high, respectively low luminosity NLRGs resemble those of the QSOs, respective BLRGs. This subdivision also led to samples comparable in redshift and extended radio emission. Specifically, the mean redshift and extended radio luminosity of the high-luminosity NLRGs ( and W/Hz/sr) match those of the QSOs ( and W/Hz/sr), and the redshifts and radio luminosities of the low luminosity NLRGs ( and W/Hz/sr) resemble those of the BLRGs ( and W/Hz/sr).
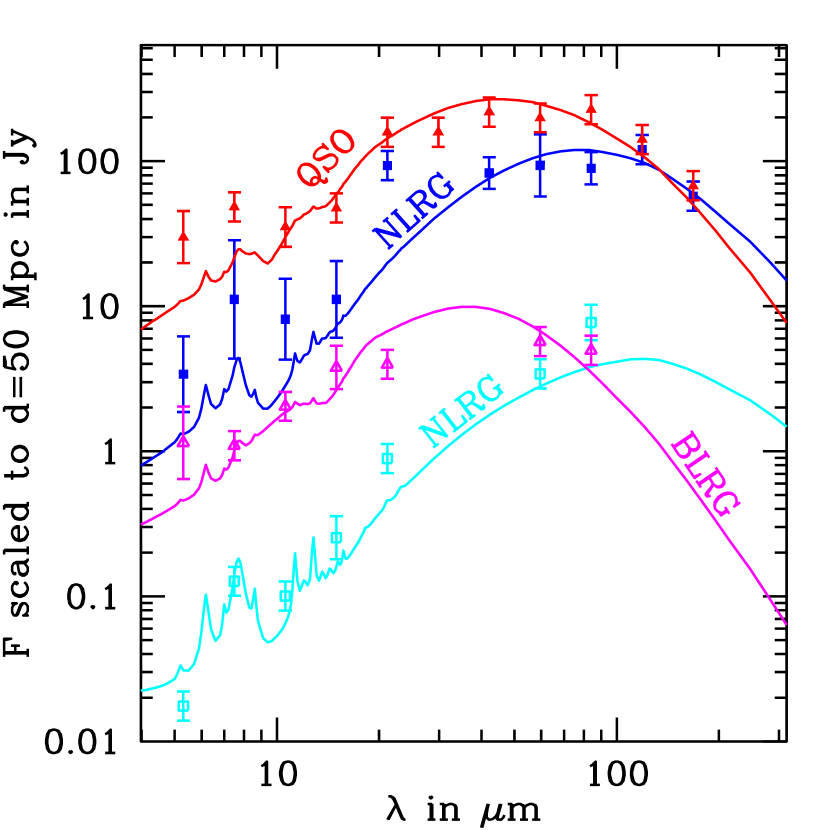
We computed logarithmically averaged SEDs for each subsample to search for differences in their shapes. Specifically, the procedure we used was the following. First, we redshifted each observed SED to the restframe, and scaled it to the same interpolated flux at m. Next, we computed logarithmic flux averages in wavelength bins. The averaged SEDs were then scaled so that their integrated fluxes equal the average of the integrated fluxes of all corresponding spectra. The same procedure without the wavelength binning was used on the model SEDs for each contributing source. The resulting averaged observed and model SEDs are shown in Figure 1. We have also used different averaging procedures and found that they did not alter the conclusions presented in this paper.
Figure 1 shows some clear and highly significant differences in the average SEDs of different AGN types. The dust emission peaks at to m for QSOs and BLRGs, and around 70 to 100m for NLRGs. This difference in the peak wavelength by a factor of about 2 between type 1 and 2 objects seems to be virtually independent of luminosity. The difference reflects different temperature distributions of large dust grains and can be understood within the framework of unified models. For type 1 AGNs where the BLR is visible, unobscured hot dust dominates the SED. By contrast, the NLRG’s large extinction obscures the BLR and pre-dominantly colder dust is visible.
5.2 Strength of PAH bands
A more specific test of the heating mechanism is the strength of PAH bands. As discussed in section 4, the PAH strength is a sensitive indicator of the heating source because PAHs are destroyed by hard ionizing radiation. Despite the low spectral resolution of the SEDs shown in figure 1, some indications of the PAH bands are visible in the SEDs of the type 2 AGNs, but not for the type 1 AGNs. This observation seems to confirm the destruction of PAHs near the central heating source.
We used ISOPHOT spectra of AGNs to investigate the strength of PAH bands as a function of AGN type in more detail. For that purpose, we assembled average spectra for each AGN type. Since radio loud and radio quiet AGNs have similar IR spectra (e.g. Sanders et al., 1989), we included both kinds of AGNs in those averages. We used the spectra presented by Haas et al. (2003a) to compute an average QSO spectrum. For the BLRGs, we used ISOPHOT spectra of 3C sources available from the ISO archive and the Seyfert I spectra from Clavel et al. (2000) . Finally, we used the average spectrum of Seyfert II galaxies presented by Clavel et al. (2000) as our average type 1 AGN spectrum. The flux of each averaged spectrum was scaled to the average of the corresponding AGN type in our 3C sample. These scaled spectra are presented in Figure 2.
The spectral index was estimated by fitting to the continuum of the averaged spectra. We found for the QSOs, for the BLRGs and for the Seyfert IIs. We note that due to the similarity between the 3C spectra of type 1 and Seyfert I spectra, the continuum slope as well as the PAH strength in our average spectrum of the BLRGs is indistinguishable from that of the average spectrum of Seyfert I galaxies shown in Figure 7 of Clavel et al. (2000).
A comparison of the three spectra in Figure 2 shows a clear difference between the PAH bands in spectra of AGNs of similar luminosity but different type. PAH bands in the spectra of type 1 AGNs are more than a factor of three stronger than in the corresponding type 2 spectra.
For comparison, we plotted the SED models shown in Figure 1 for the QSO, BLRG and low-luminosity NRLG on top of the spectra in Figure 2. One can immediately recognize a basic correspondence between the continuum shapes and PAH strength of the models with the spectra. The fact that models fitted to the overall SEDs correctly predict the strength of the PAH bands in independent samples of the same AGNs type suggests a basic similarity in the physics within each of the different types of AGNs.
The relatively weak PAH bands in type 1 AGNs can be understood in terms of the unified models. In type 1 spectra, a large fraction of the visible flux originates from the BLR region where only few PAHs survive. This region is obscured in type 2 AGNs and their spectra are hence dominated by cooler dust located at larger distances from the nucleus where PAHs are shielded from the photo-destruction. Type 1 and 2 AGNs spectra differ because of the different relative contribution of hot dust to the total emission. When comparing spectra of AGNs with the same total dust luminosity, the different relative contribution of cold dust leads to the observed differences in the total PAH emission.
6 Summary and Conclusion
We have detected hot dust in ISOCAM images of 3C galaxies out to redshift z1.2. We found a clear correlation between the type of the AGN and the overall SEDs in the sense that SEDs of BLRG and QSOs are dominated by emission from dust which is about a factor of 2 hotter than the one in comparable NRLGs. MIR spectra show that PAH emission bands in spectra of type 1 AGNs are significantly weaker than the ones in spectra of type 2 AGNs with the same total dust luminosity. These trends are naturally predicted if dust in AGNs is predominantly heated by hard radiation from a central engine which destroys PAHs close to the nucleus and heats larger dust grains at intermediate distances.
References
- Blommaert et al. (2001) Blommaert J., Siebenmorgen R., Coulais A., et al., 2001,“ISO Handbook Volume III (CAM)”, SAI-99-057/Dc, http://www.iso.vilspa.esa.es
- Clavel et al. (2000) Clavel, J, Schulz, B., Altieri, B., Barr, P., Claes, P., Heras, A., Leech, K., Metcalfe, L., and Salama, A. 2000, A&A, 357, 839.
- Farrah et al. (2003) Farrah, D., Afonso, J., Efstathiou, A., Rowan-Robinson, M. and Fox, M. 2001, MNRAS 343, 585.
- Haas et al. (2003a) Haas, M. et al. 2003, A&A 402, 87
- Haas et al. (2003b) Haas, M. et al, in preparation 2003
- Heckman et al. (1994) Heckman, T.M., O’Dea, C.P., Baum, S.A., and Laurikainen, E. 1994, ApJ 428, 65
- Martel et al. (2000) Martel, A.R., Turner, N.J., Sparks, W.B., Baum, S.A. 2000, ApJS, 130, 267.
- Meisenheimer et al. (2001) Meisenheimer, K. et al. 2001, A&A 372, 719
- Okumura (1998) Okumura K., ISOCAM PSF Report, 1998. http://www.iso.vilspa.esa.es/users/expl_lib/CAM_list.html
- Ott et al. (2000) Ott S., Pollock A., Siebenmorgen R., 2000, “The ISOCAM Parallel Mode”, Proc. of a Ringberg Workshop, ISO Surveys of a Dusty
- Prieto and Freudling (1993) Prieto, A.M. and Freudling, W. 1993, ApJ, 418, 668
- Sanders et al. (1989) Sanders, D.B., Phinney, E.S., Neugebauer, G., Soifer, B.T. and Mathews, K. 1989, ApJ 347, 29
- Siebenmorgen et al. (2003a) Siebenmorgen, R., Freudling, W., Krügel, E., Haas, M., 2003a, in preparation
- Siebenmorgen, R. et al. (2003b) Siebenmorgen, Krügel, E., Spoon, H.W.W. 2003b A&A, accepted, astro-ph/0310546
- Tadhunter (1989) Tadhunter, C., and Tsvetanov, Z. 1989, Natur, 341, 422
- Urry and Pdovani (1995) Urry, C.M., and Pdovani, P., 1999, PASP 107, 715

| Name | Type | FilteraaISOCAM Filters encoded as 2=LW2 (m), 10=LW10 (m), 3=LW3 (m) | bbbased on =70 km s-1 Mpc-1, =0.70, and | |||
|---|---|---|---|---|---|---|
| mJy | kpc | L⊙ | mag. | |||
| 3C006.1 | NLRG | 0.9 0.2 | 10 | 16 | 11.75 | 32 |
| 3C020 | NLRG | 5.3 0.4 | 10 | 2 | 11.25 | 16 |
| 3C031 | LERG | 25 1 | 10 | 0.125 | 10.00 | 2 |
| 3C033.1 | BLRG | 18 1 | 10 | 0.125 | 11.25 | 16 |
| 3C048 | QSO | 59 4 | 3 | 4 | 12.75 | 32 |
| 3C061.1 | NLRG | 0.9 0.2 | 10 | 1 | 10.75 | 32 |
| 3C071 | NLRG | 50830 2540 | 3 | 2 | 11.50 | 16 |
| 3C079 | NLRG | 21 2 | 10 | 0.5 | 11.75 | 16 |
| 3C084 | NLRG | 230 20 | 2 | 2 | 11.25 | 4 |
| 3C098 | NLRG | 24 2 | 3 | 0.125 | 10.00 | 32 |
| 3C249.1 | QSO | 19 1 | 10 | 0.125 | 11.75 | 32 |
| 3C277.3 | BLRG | 8.5 0.5 | 3 | 0.25 | 10.50 | 1 |
| 3C293 | LERG | 19 2 | 10 | 8 | 10.75 | 2 |
| 3C305 | NLRG | 21 1 | 10 | 8 | 10.75 | 1 |
| 3C309.1 | QSO | 8.2 0.5 | 10 | 0.25 | 12.75 | 32 |
| 3C321 | NLRG | 27 1 | 10 | 2 | 11.50 | 16 |
| 3C324 | NLRG | 1.7 0.2 | 10 | 4 | 12.25 | 8 |
| 3C330 | NLRG | 1.7 0.2 | 10 | 0.125 | 11.75 | 32 |
| 3C338 | NLRG | 8.8 0.5 | 10 | 16 | 10.25 | 16 |
| 3C351 | QSO | 32 2 | 10 | 0.5 | 12.25 | 32 |
| 3C356 | NLRG | 0.6 0.2 | 10 | 4 | 12.25 | 64 |
| 3C380 | QSO | 14 1 | 10 | 1 | 12.50 | 32 |
| 3C381 | BLRG | 19 1 | 10 | 0.25 | 11.25 | 32 |
| 3C382 | BLRG | 85 5 | 10 | 0.125 | 11.00 | 2 |
| 3C390.3 | BLRG | 94 5 | 10 | 0.125 | 11.00 | 4 |
| 3C445 | BLRG | 210 11 | 3 | 0.125 | 11.50 | 16 |
| 3C459 | NLRG | 29.5 4 | 3 | 2 | 12.25 | 128 |