The First Stars
Abstract
We review recent theoretical results on the formation of the first stars in the universe, and emphasize related open questions. In particular, we discuss the initial conditions for Population III star formation, as given by variants of the cold dark matter cosmology. Numerical simulations have investigated the collapse and the fragmentation of metal-free gas, showing that the first stars were predominantly very massive. The exact determination of the stellar masses, and the precise form of the primordial initial mass function, is still hampered by our limited understanding of the accretion physics and the protostellar feedback effects. We address the importance of heavy elements in bringing about the transition from an early star formation mode dominated by massive stars, to the familiar mode dominated by low mass stars, at later times. We show how complementary observations, both at high redshifts and in our local cosmic neighborhood, can be utilized to probe the first epoch of star formation.
keywords:
cosmology, first stars, intergalactic medium1 INTRODUCTION
The first stars to form out of un-enriched, pure H/He gas marked the crucial transition from a homogeneous, simple universe to a highly structured, complex one at the end of the cosmic dark ages. Extending the familiar scheme of classifying stellar populations in the local universe (Baade 1944) to the extreme case of zero metallicity, the first stars constitute the so-called Population III (e.g., Bond 1981, Cayrel 1986, Carr 1987, 1994). The quest for Population III stars has fascinated astronomers for many decades, going back to the first tentative ideas of Schwarzschild & Spitzer (1953). Recently, the subject has attracted an increased interest, both from a theoretical and observational perspective. New empirical probes of the high redshift universe have become available, and our ability to carry out sophisticated numerical simulations has improved dramatically. In this review, we attempt to summarize the current state of this rapidly evolving field.
The first generation of stars had important effects on subsequent galaxy formation (see Carr et al. 1984 for an early overview). On the one hand, Population III stars produced copious amounts of UV photons to reionize the universe (e.g., Tumlinson & Shull 2000, Bromm et al. 2001b, Schaerer 2002, 2003, Tumlinson et al. 2003, Venkatesan & Truran 2003, Venkatesan et al. 2003). Recently, the Wilkinson Microwave Anisotropy Probe (WMAP) has observed the large-angle polarization anisotropy of the cosmic microwave background (CMB), thus constraining the total ionizing photon production from the first stars (e.g., Cen 2003a,b, Ciardi et al. 2003, Haiman & Holder 2003, Holder et al. 2003, Kaplinghat et al. 2003, Kogut et al. 2003, Sokasian et al. 2003a,b, Wyithe & Loeb 2003a,b). The large optical depth to Thomson scattering measured by WMAP has been interpreted as a signature of a substantial early activity of massive star formation at redshifts (see Section 5.1). Secondly, the supernova (SN) explosions that ended the lives of the first stars were responsible for the initial enrichment of the intergalactic medium (IGM) with heavy elements (e.g., Ostriker & Gnedin 1996, Gnedin & Ostriker 1997, Ferrara et al. 2000, Madau et al. 2001, Mori et al. 2002, Thacker et al. 2002, Bromm et al. 2003, Furlanetto & Loeb 2003, Mackey et al. 2003, Scannapieco et al. 2003, Wada & Venkatesan 2003, Yoshida et al. 2004). An intriguing possibility unique to zero-metallicity massive stars is the complete disruption of the progenitor in a pair-instability supernova (PISN), which is predicted to leave no remnant behind (e.g., Barkat et al. 1967, Ober et al. 1983, Bond et al. 1984, Fryer et al. 2001, Heger & Woosley 2002, Heger et al. 2003). This peculiar explosion mode could have played an important role in quickly seeding the IGM with the first metals (see Section 4.2).
To place the study of the first stars into the appropriate cosmological context, one has to ask (see Section 2): When and how did the cosmic dark ages end? The dark ages denote the cosmic time between the emission of the CMB half a million years after the big bang, when the CMB photons shifted into the infrared, so that the universe would have appeared completely dark to a human observer, and the formation of the first sources of light (see Barkana & Loeb 2001, Loeb & Barkana 2001, Miralda-Escudé 2003 for comprehensive reviews of this cosmic epoch). Historically, the evocative – and now widely used – dark age analogy was first introduced into the literature briefly after the ascent of non-baryonic, cold dark matter scenarios (e.g., Sargent 1986, Rees 1993). In the context of popular cold dark matter (CDM) models of hierarchical structure formation, the first stars are predicted to have formed in dark matter (DM) halos of mass that collapsed at redshifts (e.g., Tegmark et al. 1997, Yoshida et al. 2003a). The first quasars, on the other hand (e.g., Umemura et al. 1993, Loeb & Rasio 1994, Eisenstein & Loeb 1995), are likely to have formed in more massive host systems, at redshifts (Haiman & Loeb 2001, Bromm & Loeb 2003a), and certainly before , the redshift of the most distant quasar known (Fan et al. 2003). Here, we will not discuss quasar formation in depth, and we refer the reader to the references above.
The most fundamental question about the first stars is how massive they typically were (see Section 3). Results from recent numerical simulations of the collapse and fragmentation of primordial gas clouds suggest that the first stars were predominantly very massive, with typical masses (Bromm et al. 1999, 2002, Nakamura & Umemura 2001, Abel et al. 2000, 2002). The simulations have taught us the important lesson that regardless of the detailed initial conditions, the primordial gas attains characteristic values of temperature and density. These in turn correspond to a characteristic fragmentation scale, given approximately by the Jeans mass, and are explained by the microphysics of molecular hydrogen (H2) cooling (see Section 3.2). The minihalos which host the formation of the first stars have virial temperatures of order K, below the threshold for cooling due to atomic hydrogen lines ( K). Therefore, cooling and fragmentation inside these minihalos is possible only via rotational-vibrational transitions of H2, which can be excited even at these low temperatures (see Section 2 for details).
Despite the progress already made, many important questions remain unanswered. A particularly important one, for example, is: What is the functional form of the primordial initial mass function (IMF)? Having constrained the characteristic mass scale, still leaves undetermined the overall range of stellar masses and the power-law slope which is likely to be a function of mass (e.g., Yoshii & Saio 1986, Larson 1998, Nakamura & Umemura 2001, 2002, Omukai & Yoshii 2003). In addition, it is presently not known whether binaries or, more generally, clusters of zero-metallicity stars, can form (see Section 3.2). This question has important implications for the star formation process. If Population III star formation typically resulted in a binary or multiple system, much of the progenitor cloud’s angular momentum could go into the orbital motion of the stars in such a system. On the other hand, if an isolated formation mode were to predominate, the classical angular momentum barrier could be much harder to breach (see Larson 2003).
How was the epoch of Population III star formation eventually terminated (see Section 4)? Two categories of negative feedback effects are likely to be important, the first being radiative and the second chemical in nature (e.g., Ciardi et al. 2000b, Schneider et al. 2002a, Mackey et al. 2003). The radiative feedback consists in soft UV photons produced by the first stars photodissociating the rather fragile H2 molecules in the surrounding gas, thus suppressing the corresponding H2 cooling (e.g., Haiman et al. 1997, 2000, Omukai & Nishi 1999, Ciardi et al. 2000a, Nishi & Tashiro 2000, Glover & Brand 2001). Massive Population III stars could then no longer form. There is some debate, however, whether the radiative feedback from the first stars could not have had an overall positive sign (e.g., Ferrara 1998, Machacek et al. 2001, 2003, Oh 2001, Ricotti et al. 2001, Cen 2003b). The formation of H2 molecules is catalyzed by free electrons, and whichever process increased their presence would therefore also boost the abundance of H2. For example, an early background of X-ray photons, either from accretion onto black holes (e.g., Madau et al. 2003), or from the remnants of Population III SNe, could ionize the gas and thus increase the abundance of free electrons (e.g., Haiman et al. 2000, Venkatesan et al. 2001, Glover & Brand 2003, Machacek et al. 2003). This debate is ongoing, and it is too early for definitive conclusions (see Section 4.1 for details).
The second feedback effect that will be important in terminating the epoch of Population III star formation is chemical in nature, or, more precisely: it is due to the enrichment of the primordial gas with the heavy elements dispersed by the first SNe (see Section 4.2). Numerical simulations of the fragmentation process have shown that lower mass stars can only form out of gas that was already pre-enriched to a level in excess of the ‘critical metallicity’, estimated to be of order the solar value (Bromm et al. 2001a; see also Schneider et al. 2002a). Depending on the nature of the first SN explosions, and in particular on how efficiently and widespread the mixing of the metal-enriched ejecta proceeds, the cosmic star formation will at some point undergo a fundamental transition from an early high-mass (Population III) dominated mode to one dominated by lower mass stars (Population II).
We conclude our review with a discussion of a few select observational probes of the nature of the first stars (Section 5). Predicting the properties of the first stars is important for the design of upcoming instruments, such as the James Webb Space Telescope111See http:// ngst.gsfc.nasa.gov. (JWST), or the next generation of large (m) ground-based telescopes. The hope is that over the upcoming decade, it will become possible to confront current theoretical predictions about the properties of the first sources of light with direct observational data. The increasing volume of new data on high redshift galaxies and quasars from existing ground- and space-based telescopes, signals the emergence of this new frontier in cosmology.
2 COSMOLOGICAL CONTEXT
The establishment of the current standard CDM model for cosmological structure formation (see Kirshner 2003, Ostriker & Steinhardt 2003 for recent reviews) has provided a firm framework for the study of the first stars. Within variants of the CDM model, where larger structures are assembled hierarchically through successive mergers of smaller building-blocks, the first stars are predicted to form in DM minihalos of typical mass at redshifts (e.g., Couchman & Rees 1986). The virial temperatures in these low-mass halos, (Barkana & Loeb 2001), are below the threshold, K, for efficient cooling due to atomic hydrogen (e.g., Hutchings et al. 2002, Oh & Haiman 2002). It was realized early on that cooling in the low-temperature primordial gas had to rely on molecular hydrogen instead (Saslaw & Zipoy 1967, Peebles & Dicke 1968).
Since the thermodynamic behavior of the primordial gas thus is primarily controlled by H2 cooling, it is crucial to understand the non-equilibrium chemistry of H2 formation and destruction (e.g., Lepp & Shull 1984, Anninos & Norman 1996, Abel et al. 1997, Galli & Palla 1998, Puy & Signore 1999). In the absence of dust grains to facilitate their formation (e.g., Hirashita & Ferrara 2002), molecules have to form in the gas phase. The most important formation channel turns out to be the sequence: H + H, followed by H H H (McDowell 1961). The free electrons act as catalysts, and are present as residue from the epoch of recombination (Seager et al. 2000), or result from collisional ionization in accretion shocks during the hierarchical build-up of galaxies (e.g., Mac Low & Shull 1986, Shapiro & Kang 1987). The formation of hydrogen molecules thus ceases when the free electrons have recombined. An alternative formation channel relies on the intermediary H with free protons as catalysts (e.g., Haiman et al. 1996, Abel et al. 1997). The H- channel, however, dominates in most circumstances (e.g., Tegmark et al. 1997). Calculations of H2 formation in collapsing top-hat overdensities, idealizing the virialization of dark matter halos in CDM cosmogonies, have found a simple approximate relationship between the asymptotic H2 abundance and virial temperature in the overdensity (or halo): (Tegmark et al. 1997).
Applying the familiar criterion (Rees & Ostriker 1977, Silk 1977) for the formation of galaxies that the cooling timescale has to be shorter than the dynamical timescale, , one can derive the minimum halo mass at a given redshift inside of which the gas is able to cool and eventually form stars (e.g., Tegmark et al. 1997, Santoro & Thomas 2003). The H2 cooling function has been quite uncertain, differing by an order of magnitude over the relevant temperature regime (Hollenbach & McKee 1979, Lepp & Shull 1984). Recent advances in the quantum-mechanical computation of the collisional excitation process (H atoms colliding with H2 molecules) have provided a much more reliable determination of the H2 cooling function (see Galli & Palla 1998, and references therein). Combining the CDM prescription for the assembly of virialized DM halos with the H2 driven thermal evolution of the primordial gas, a minimum halo mass of is required for collapse redshifts . From detailed calculations, one finds that the gas in such a ‘successful’ halo has reached a molecule fraction in excess of (e.g., Haiman et al. 1996, Tegmark et al. 1997, Yoshida et al. 2003a). These systems correspond to peaks in the Gaussian random field of primordial density fluctuations. In principle, DM halos that are sufficiently massive to harbor cold, dense gas clouds could form at higher redshifts, . Such systems, however, would correspond to extremely rare, high- peaks in the Gaussian density field (e.g., Miralda-Escudé 2003).
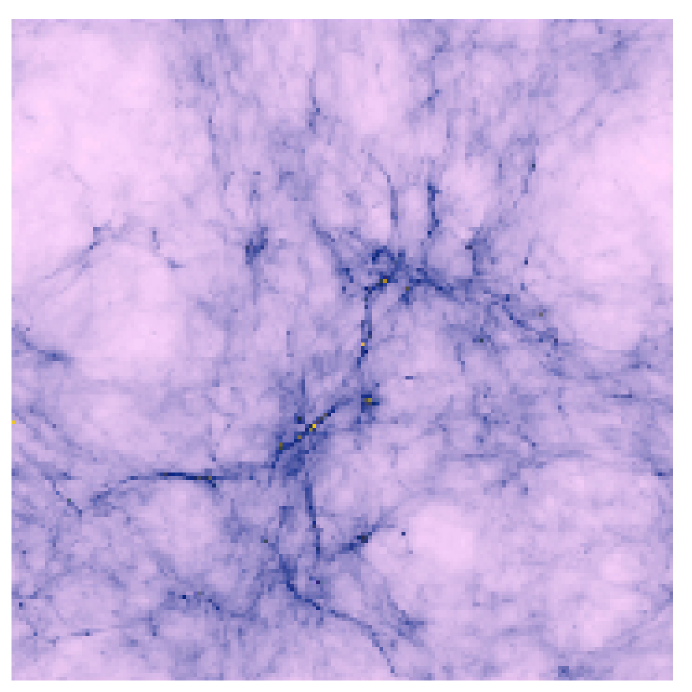
To more realistically assess the formation of cold and dense star forming clouds in the earliest stages of cosmological structure formation, three-dimensional simulations of the combined evolution of the DM and gas are required within a cosmological set-up (Ostriker & Gnedin 1996, Gnedin & Ostriker 1997, Abel et al. 1998). These studies confirmed the important role of H2 cooling in low-mass halos at high . Recently, the problem of forming primordial gas clouds within a fully cosmological context has been revisited with high numerical resolution (Yoshida et al. 2003a,b,c,d). The resulting gas density field is shown in Figure 1 for a standard CDM cosmology at . The bright knots at the intersections of the filamentary network are the star forming clouds, having individual masses (DM and gas) of . As is expected from the statistics of the high- peaks (e.g., Kaiser 1984), the primordial clouds are predominantly clustered, although there are a few cases of more isolated ones.
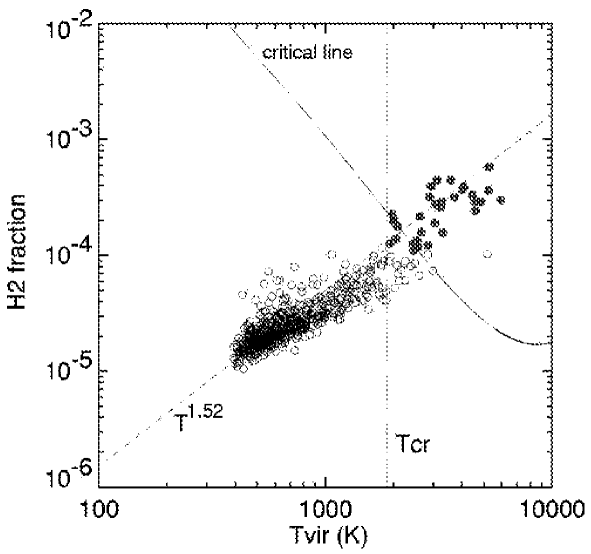
Whether a given DM halo successfully hosts a cold, dense (,cm-3) gas cloud can nicely be understood with the Rees-Ostriker criterion, as can be seen in Figure 2. Yoshida et al. (2003a) derive a minimum collapse mass of , with only a weak dependence on collapse redshift (see also Haiman et al. 1996, Fuller & Couchman 2000, Machacek et al. 2001). The dynamical heating accompanying the merging of DM halos has an important effect on the thermal and chemical evolution of the gas. Clouds do not successfully cool if they experience too rapid a growth in mass.
The primordial gas clouds that are found in the cosmological simulations are the sites where the first stars form. It is, therefore, important to learn what properties these clouds have in terms of overall size, shape, and angular momentum contents. The latter is often expressed by the familiar spin-parameter , where , , and are the total angular momentum, energy, and mass, respectively. The spin parameter is a measure of the degree of rotational support, such that the ratio of centrifugal to gravitational acceleration is given by at virialization. The spin values measured in pure DM cosmological simulations can be described by a lognormal distribution function with a mean value of , similar to what is found for larger-scale systems (Jang-Condell & Hernquist 2001). Interestingly, the resulting angular momentum vectors for the gaseous and DM components do generally not align in the simulations of Yoshida et al. (2003a). The overall sizes of the Population III star forming clouds are close to the virial radius of the host DM halo, with pc, not too different from the typical dimensions of present-day giant molecular clouds (e.g., Larson 2003). Depending on the degree of spin, the clouds have shapes with various degree of flattening (e.g., Bromm et al. 2002, Yoshida et al. 2003a). Due to the importance of pressure forces, however, overall cloud shapes tend to be rather spherical. To fully elucidate the properties of the star-forming primordial clouds, even higher resolution cosmological simulations will be necessary.
The theoretical predictions for the formation sites of the first stars sensitively depend on the exact nature of the DM component and its fluctuation spectrum. Recently, two models have been discussed that would much reduce the fluctuation power on small mass scales. The first of these, the warm dark matter (WDM) model (e.g., Bode et al. 2001), has been proposed to remedy the well-known problems of standard CDM on sub-galactic scales (e.g., Flores & Primack 1994, Moore et al. 1999). These concern the predicted large abundance of substructure or, equivalently, of satellite systems, and the high (cuspy) densities in the centers of galaxies. Both predictions are in conflict with observations. The second model, the ‘running’ spectral index (RSI) model, is suggested by the combined analysis of the WMAP data, the 2dF galaxy redshift survey, and Lyman- forest observations (Spergel et al. 2003, Peiris et al. 2003). A series of recent studies have worked out the consequences of these reduced small-scale power models on early star formation (Somerville et al. 2003, Yoshida et al. 2003b,c). Within these models, the star formation rate at is significantly reduced compared to the standard CDM case. This is due to the absence of low-mass halos and their associated gas clouds that are cooled by molecular hydrogen. We will revisit this issue when we discuss the implications of the WMAP data for early star formation (in Section 5.1).
3 FORMATION OF THE FIRST STARS
3.1 Star Formation Then and Now
Currently, we do not have direct observational constraints on how the first stars formed at the end of the cosmic dark ages. It is, therefore, instructive to briefly summarize what we have learned about star formation in the present-day universe, where theoretical reasoning is guided by a wealth of observational data (see Pudritz 2002, Ward-Thompson 2002, Larson 2003 for recent reviews).
Population I stars form out of cold, dense molecular gas that is structured in a complex, highly inhomogeneous way. The molecular clouds are supported against gravity by turbulent velocity fields and pervaded on large scales by magnetic fields. Stars tend to form in clusters, ranging from a few hundred up to stars. It appears likely that the clustered nature of star formation leads to complicated dynamics and tidal interactions that transport angular momentum, thus allowing the collapsing gas to overcome the classical centrifugal barrier (Larson 2002). The IMF of Population I stars is observed to have the approximate Salpeter form (e.g., Kroupa 2002)
| (1) |
where
| (2) |
The IMF is not observationally well determined at the lowest masses, but theory predicts that there should be a lower mass limit of about set by opacity effects. This theoretical limit reflects the minimum fragment mass, set when the rate at which gravitational energy is released during the collapse exceeds the rate at which the gas can cool (e.g., Low & Lynden-Bell 1976, Rees 1976). The most important feature of the observed IMF is that is the characteristic mass scale of Population I star formation, in the sense that most of the mass goes into stars with masses close to this value. Recent hydrodynamical simulations of the collapse and fragmentation of turbulent molecular cloud cores (e.g., Padoan & Nordlund 2002, Bate et al. 2003) illustrate the highly dynamic and chaotic nature of the star formation process222See http:// www.ukaff.ac.uk/starcluster for an animation..
The metal-rich chemistry, magnetohydrodynamics, and radiative transfer involved in present-day star formation is complex, and we still lack a comprehensive theoretical framework that predicts the IMF from first principles. Star formation in the high redshift universe, on the other hand, poses a theoretically more tractable problem due to a number of simplifying features, such as: (i) the initial absence of heavy elements and therefore of dust; (ii) the absence of dynamically-significant magnetic fields in the pristine gas left over from the big bang; and (iii) the absence of any effects from previous episodes of star formation which would completely alter the conditions for subsequent star formation. The cooling of the primordial gas then depends only on hydrogen in its atomic and molecular form. Whereas in the present-day interstellar medium, the initial state of the star forming cloud is poorly constrained, the corresponding initial conditions for primordial star formation are simple, given by the popular CDM model of cosmological structure formation. We now turn to a discussion of this theoretically attractive and important problem.
3.2 Clump Formation: The Characteristic Stellar Mass
How did the first stars form? This subject has a long and venerable history (e.g., Schwarzschild & Spitzer 1953, Matsuda et al. 1969, Yoneyama 1972, Hutchins 1976, Silk 1977, 1983, Yoshii & Sabano 1979, Carlberg 1981, Kashlinsky & Rees 1983, Palla et al. 1983, Yoshii & Saio 1986). In this review, we focus mainly on the more recent work since the renewed interest in high-redshift star formation that began in the mid-1990s (e.g., Haiman et al. 1996, Uehara et al. 1996, Haiman & Loeb 1997, Tegmark et al. 1997, Larson 1998).
The complete answer to this question would entail a theoretical prediction for the Population III IMF, which is rather challenging. A more tractable task is to estimate the characteristic mass scale, , of the first stars, and most of the recent numerical work has focused on this simpler problem. The characteristic mass is the mass below which the IMF flattens or begins to decline (see Larson 1998 for examples of possible analytic forms). As mentioned above, this mass scale is observed to be in the present-day universe. Since the detailed shape of the primordial IMF is highly uncertain, we focus here on constraining , as this mass scale indicates the typical outcome of the primordial star formation process, or where most of the available mass ends up (e.g., Clarke & Bromm 2003).
To fully explore the dynamical, thermal, and chemical properties of primordial gas, three-dimensional numerical simulations are needed, although more idealized investigations in two, one, or even zero (‘one-zone models’) dimension are important in that they allow to probe a larger parameter space. The proper initial conditions for primordial star formation are given by the underlying model of cosmological structure formation (see Section 2). It is, therefore, necessary to simulate both the DM and gaseous (‘baryonic’) components. To date, two different numerical approaches have been used to simulate the general three-dimensional fragmentation problem in its cosmological context.
The first series of simulations used the adaptive mesh refinement (AMR) technique (Abel et al. 2000, 2002; ABN henceforth). The AMR algorithm creates a nested hierarchy of ever finer grids in fluid regions where high resolution is needed (see, e.g., Balsara 2001 for a recent review). This method allows to accurately simulate problems with high dynamic range, i.e., large contrasts in density. Such a situation indeed occurs in primordial star formation where the proper initial conditions are given by the large scale ( kpc) cosmological environment, and where the collapsing gas has to be followed all the way to protostellar scales ( pc). The second series of simulations used the smoothed particle hydrodynamics (SPH) method (Bromm et al. 1999, 2002; BCL henceforth). This Lagrangian technique samples the continuous fluid with a finite number of particles whose mass is smoothed out according to a given distribution function (the SPH kernel), and it has been applied to a wide range of problems in present-day star formation (see Monaghan 1992 for a standard review).
The SPH approach cannot compete with AMR in terms of dynamic range, but it has the important advantage that it can easily accommodate the creation of sink particles (e.g., Bate et al. 1995). Quite generically, gravitational collapse proceeds very non-uniformly such that the density in a few sub-regions becomes much larger than the average. Numerically, this situation necessitates the adoption of increasingly small timesteps: whereas the simulation follows the evolution of the select density peak in detail, the overall system is essentially frozen. To study the collective properties of star formation, i.e., the formation of multiple high-density clumps that interact with each other in a complex fashion (see Bate et al. 2003), the SPH particles are merged into more massive ones, provided they exceed a given density threshold. Recently, the dynamical range of the standard SPH method has been significantly improved by implementing a ‘particle splitting’ technique (Kitsionas & Whitworth 2002, Bromm & Loeb 2003a). When the simulation reaches such high density in a certain region that a sink particle would normally be created, a complementary strategy is now adopted: Every SPH particle in the unrefined, high-density region acts as a parent particle and spawns a given number of child particles, and endows them with its properties. In effect, this is the SPH equivalent of the grid-based AMR technique.
The most important difference between these two studies lies in the way the initial conditions are implemented. The ABN simulations start at with a realistic cosmological set-up, considering a periodic volume of physical size kpc. The AMR technique allows ABN to bridge the gap from cosmological to rotostellar scales. The BCL effort, on the other hand, initializes the simulations, also at , in a more idealized way, as isolated, spherical overdensities that correspond to high- peaks in the Gaussian random field of cosmological density fluctuations (see Katz 1991).
The systems considered by BCL comprise halos of total mass that collapse at . The virialization (or collapse) redshift, , marks the approximate instant where the DM component settles into virial equilibrium (leading to: ). The BCL initial configurations are not simple ‘top-hat’ (i.e., uniform density) clouds, however, as the dynamically dominant DM component is endowed with density fluctuations according to , the asymptotic behavior of the CDM power spectrum on small mass scales (e.g., Yoshida et al. 2003d). The BCL simulations, therefore, do reflect the basic bottom-up, hierarchical merging of smaller DM halos into larger ones, and the accompanying shock heating of the gas. Because of the isolated nature of their systems, BCL had to treat the initial amount of angular momentum (or ‘spin’) as a free parameter, imparting both the DM and gaseous components with solid-body rotation around the center of mass. In the ABN simulations, tidal torques from neighboring halos generate the halo spin self-consistently. In summary, the ABN investigation is the most realistic treatment of the primordial star formation problem to date, whereas the more idealized BCL simulations, implementing the same physical ingredients as ABN, have explored a much wider range of initial conditions.
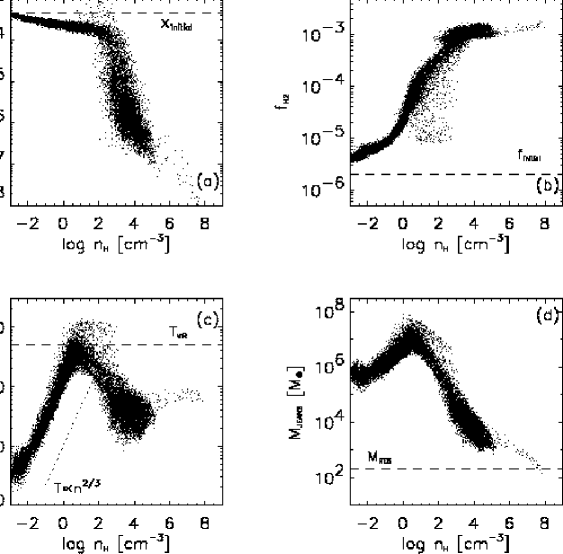
In comparing the simulations of ABN and BCL, the most important aspect is that both studies, employing very different methods, agree on the existence of a preferred state for the primordial gas, corresponding to characteristic values of temperature and density, K, and cm-3, respectively. These characteristic scales turn out to be rather robust in the sense that they are not very sensitive to variations in the initial conditions. In Figure 3 (panel c), this preferred state in the phase diagram can clearly be discerned. This figure, from the simulations of BCL, plots the respective gas properties for each individual SPH particle. The diagram thus contains an additional dimension of information: where evolutionary timescales are short, only few particles are plotted, whereas they tend to accumulate where the overall evolution is slow. Such a ‘loitering’ state is reached at and .
These characteristic scales can be understood by considering the microphysics of H2, the main coolant in metal-free, star forming gas (Abel et al. 2002, Bromm et al. 2002). At temperatures K, cooling is due to the collisional excitation and subsequent radiative decay of rotational transitions. The two lowest-lying rotational energy levels in H2 have an energy spacing of . Collisions with particles (mostly H atoms) that populate the high-energy tail of the Maxwell-Boltzmann velocity distribution can lead to somewhat lower temperatures, but cooling cannot proceed to K. This explains the characteristic temperature. The characteristic density, in turn, is given by the critical density above which collisional de-excitations, which do not cool the gas, compete with radiative decays, which lead to cooling. This saturation of the H2 cooling marks the transition from NLTE rotational level populations to thermal (LTE) ones. At densities below , the cooling rate is proportional to the density squared, whereas at higher densities, the dependence is only linear.
Once the characteristic state is reached, the evolution towards higher density is temporarily halted due to the now inefficient cooling, and the gas undergoes a phase of quasi-hydrostatic, slow contraction. To move away from this ‘loitering’ regime, enough mass has to accumulate to trigger a gravitational runaway collapse. This condition is simply , where the Jeans mass or, almost equivalently, the Bonnor-Ebert mass can be written as (e.g., Clarke & Bromm 2003)
| (3) |
Primordial star formation, where magnetic fields and turbulence are expected to initially play no important dynamical role, may be the best case for the application of the classical Jeans criterion which is describing the balance between gravity and the opposing thermal pressure (Jeans 1902).
A prestellar clump of mass is the immediate progenitor of a single star or, in case of further subfragmentation, a binary or small multiple system. In Galactic star-forming regions, like Ophiuchi, such clumps with masses close to stellar values have been observed as gravitationally bound clouds which lack the emission from embedded stellar sources (e.g., Motte et al. 1998). The high-density clumps are clearly not stars yet. To probe the further fate of a clump, one first has to follow the collapse to higher densities up to the formation of an optically thick hydrostatic core in its center (see Section 3.3), and subsequently the accretion from the diffuse envelope onto the central core (see Section 3.4). The parent clump mass, however, already sets an upper limit for the final stellar mass whose precise value is determined by the accretion process.
Although ABN and BCL agree on the magnitude of the characteristic fragmentation scale, ABN have argued that only one star forms per halo, while BCL have simulated cases where multiple clumps form, such that the number of stars in a minihalo is . Among the cases studied by BCL favoring , are high-spin runs that lead to disk-like configurations which subsequently fragment into a number of clumps, or more massive halos (with total mass ). Notice that the case simulated by ABN corresponds to a gas mass of . Such a low-mass halo is only marginally able to cool, and when BCL simulated a system with this mass, they also found that only a single star forms inside the halo. Further work is required to elucidate whether the multiple-clump formation in BCL does also occur in simulations with realistic cosmological initial conditions.
Whether indeed primordial clusters of metal-free stars are able to form in the first galaxies is an important open question. The answer will determine the proper interpretation of the primordial IMF. If Population III star formation were generally clustered, as is the case in the present-day universe, the IMF would simply describe the actual distribution of stellar masses in a given cluster. If, on the other hand, the first stars formed predominantly in isolation, the IMF would have the meaning of a probability distribution in a random process that results in only one stellar mass per ‘draw’. The present-day IMF, however, appears to be shaped largely by the chaotic interactions between many accreting protostars in a common reservoir of gas (e.g., Bate et al. 2003). If there were no cluster to begin with, how would the IMF be build up? Would there still be a self-similar extension at masses ? Progress has to rely on improved simulations in future work, and it is difficult to guess at the outcome.
A possible clustered nature of forming Population III stars would also have important consequences for the transport of angular momentum. In fact, a crucial question is how the primordial gas can so efficiently shed its angular momentum on the way to forming massive clumps. In the case of a clustered formation process, angular momentum could be efficiently transported outward by gravitational (tidal) torques. Tidal torques can then transfer much of the angular momentum from the gas around each forming clump to the orbital motion of the system, similar to the case of present-day star formation in a clustered environment (e.g., Larson 2002, Bate et al. 2003). In the isolated formation process of ABN, however, such a mechanism is not available. Alternatively, ABN have suggested the efficient transport of angular momentum via hydrodynamic shocks during turbulent collapse. Again, more work is required to convincingly sort out the angular momentum transport issue. It may be possible that magnetic fields in an accretion disk around the primordial protostar could be sufficiently amplified by dynamo action from the suspected very weak primordial values (e.g. Kulsrud et al. 1997). The dynamo activity could occur as a consequence of turbulence that is driven by gravitational instabilities in the disk (Tan & Blackman 2003), and magnetic stresses could then facilitate angular momentum transport in the accretion disk.
As pointed out above, important contributions have also been made by more idealized, two- to zero-dimensional, studies. These investigations typically ignore the dark matter component, thus implicitly assuming that the gas has already dissipatively collapsed to the point where the dark matter ceases to be dynamically dominant. Much attention has been paid to the collapse of filamentary clouds (Nakamura & Umemura 1999, 2001, 2002). Results from one- and two-dimensional simulations that otherwise include all the relevant processes for the primordial chemistry and cooling have estimated fragmentation scales and , depending on the (central) initial density. When sufficiently high (cm-3), the low-mass value is reached. This bifurcation has led to the prediction of a bimodal IMF for the first stars (Nakamura & Umemura 2001). It is however, not obvious how such a high initial density can be reached in a realistic situation where the collapse starts from densities that are typically much smaller than the bifurcation value.
Recently, the question of whether low mass metal-free stars can form has received considerable interest in connection with the discovery of extremely metal-poor (or more precisely: iron-poor) Galactic halo stars (see Section 5.2). Is it possible to place a firm lower limit on the mass of the first stars? Such a minimum mass may be given by the so-called opacity limit for fragmentation (e.g., Low & Lynden-Bell 1976, Rees 1976). The opacity limit, estimated to be in present-day star formation, is the mass of a cloud that is no longer able to radiate away its gravitational binding energy in a free-fall time. For the case of metal-free stars, one-dimensional, spherically symmetric calculations have indicated a value which is rather similar to the present-day opacity limit (Omukai & Nishi 1998; see also Section 3.3). Whereas Omukai & Nishi (1998) have included all relevant sources of opacity in metal-free gas, a somewhat more idealized study by Uehara et al. (1996) has estimated that a cloud of may become opaque to H2-line radiation. It is currently not clear how relevant the latter value is in a realistic collapse calculation.
We conclude this section with three other recent suggestions of how to produce lower-mass stars out of zero-metallicity gas. The first one is a modified version of the double-peaked (bimodal) IMF, and relies on the presence of HD, deuterium hydride (Nakamura & Umemura 2002, Uehara & Inutsuka 2000). In principle, HD is a much more efficient coolant than H2, as it possesses a permanent electric dipole moment (with Einstein coefficients that are larger by a factor of compared to the quadrupole transition probability for H2), and can cool the gas to temperatures below K due to a smaller rotational level spacing (e.g., Puy & Signore 1996, Flower et al. 2000). Bromm et al. (2002) included HD cooling in their simulations and found that it does not change the thermal evolution of the gas. It may, however, be possible to reach a regime where HD cooling becomes important when the gas cools down from temperatures above 10,000 K, e.g., in photoionization heated gas, or in shock-heated material in dwarf-galaxy size DM halos (masses ).
The second idea postulates that the fragmentation scale (in effect the Jeans mass) will be reduced in gas that is bathed in soft UV radiation, below the high masses predicted for the first stars (Omukai & Yoshii 2003). It is argued that the strong UV radiation in the vicinity of a massive Population III star will destroy H2, thus preventing the gas to reach the characteristic ‘loitering’ state. The gas may then be able to collapse, albeit at higher temperatures, to increasingly large densities (see also Omukai 2001). The 3D-simulations of Bromm & Loeb (2003a), treating a very similar case, however, have failed to show the postulated fragmentation to small masses. The final idea proposed the formation of lower-mass stars in zero-metal, shock compressed gas (Mackey et al. 2003). The required compression could, e.g., be induced by the first energetic supernova explosions. Assuming that the shock is radiative and isobaric (e.g., Shapiro & Kang 1987) one can derive the expression
| (4) |
where denotes the preshock density and the velocity of the shock. Indeed, since a metal-free population of stars with a characteristic mass intermediate between the ‘classical’ Population II and Population III cases would be quite distinct, Mackey et al. (2003) have suggested to name these hypothetical stars ‘Population II.5’. Numerical simulations of SN explosions at high redshifts have so far failed to bear this prediction out (Bromm et al. 2003), but it may be possible that Population II.5 stars can only form in more massive systems (see Salvaterra et al. 2003).
We conclude this section by pointing out that all the realistic 3D simulations of the first star formation problem to date have consistently shown that the primordial gas fragments into massive clumps. Conversely, none of the suggestions for making low mass stars out of zero-metallicity gas has yet been realized in a 3D simulation. The tentative conclusion therefore is that the typical outcome of primordial star formation consists in massive clumps, and that low-mass clumps may need very special conditions to form.
3.3 Protostellar collapse
What is the further fate of the clumps discussed above? In particular, one would like to test the notion that such a Jeans unstable clump is the immediate progenitor of a single star which forms in its center. That will evidently only be correct if the clump does not undergo further subfragmentation upon collapsing to higher densities. It has long been suspected that such subfragmentation could occur at densities in excess of cm-3, at which point three-body reactions become very efficient in converting the atomic gas (with only a trace amount of H2 molecules from the H- channel) into fully molecular form: 3H H2 + H (Palla et al. 1983). As the H2 coolant is now suddenly more abundant by a factor of , the corresponding boost in cooling could trigger a thermal instability, thus breaking up the clump into smaller pieces (Silk 1983). Both ABN and BCL have included the three-body reactions in their chemical reaction networks, and have followed their simulations to higher densities to test whether subfragmentation does occur or not (for BCL, this calculation is described in Bromm 2000). Both groups report that no further subfragmentation is seen. With hindsight, that may not be too surprising. The reason being that any small density fluctuations which are present earlier on, and which could serve as seeds for later fragmentation, will have been erased by pressure forces during the slow, quasi-hydrostatic ‘loitering’ phase at . In addition, inefficient cooling may also play a role in suppressing high-density fragmentation. Despite the increase in the cooling rate throughout the fully molecular gas, this never leads to a significant drop in temperature due to the countervailing effect of compressional heating.
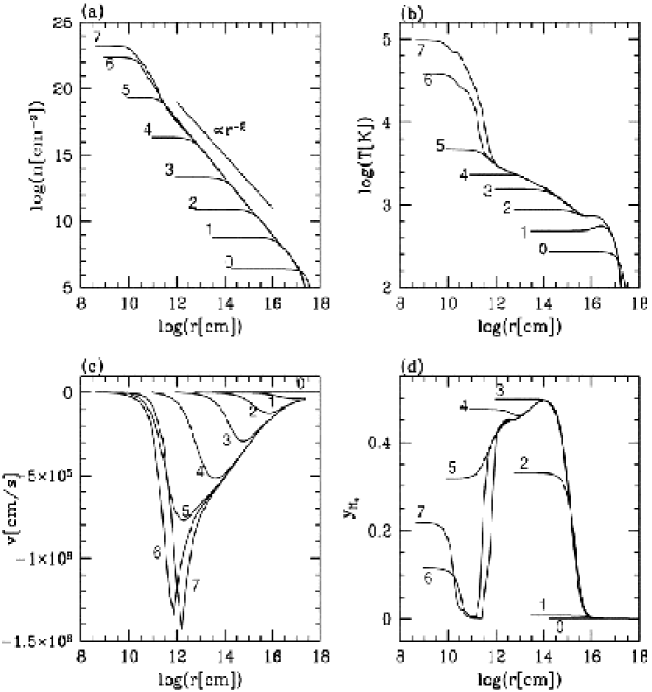
Extending the analogous calculation for the collapse of a present-day protostar (Larson 1969) to the primordial case, Omukai & Nishi (1998) have carried out one-dimensional hydrodynamical simulations in spherical symmetry. They also consider the full set of chemical reactions, and implement an algorithm to solve for the radiative transfer in the H2 lines, as well as in the continuum. The most important result is that the mass of the initial hydrostatic core, formed in the center of the collapsing cloud when the density is high enough (cm-3) for the gas to become optically thick to continuum radiation, is almost the same as the (second) core in present-day star formation: . In Figure 4, the radial profiles of density, temperature, velocity, and H2 abundance are shown (reproduced from Omukai & Nishi 1998). The profiles of density and velocity before the time of core formation (corresponding to the curves with label 6) are well described by the Larson-Penston (LP) similarity solution. Once the core has formed, the self-similarity is broken. Similar results have been found by Ripamonti et al. (2002) who have in addition worked out the spectrum of the radiation that escapes from the collapsing clump (mostly in the IR, both as continuum and line photons). This type of approximately self-similar behavior seems to be a very generic result of collapse with a simple equation of state, even when rotation and magnetic fields are included (see Larson 2003). The apparent robustness of the LP solution thus supports the results found for the Population III case.
The small value of the initial core does not mean that this will be the final mass of a Population III star. This instead will be determined by how efficient the accretion process will be in incorporating the clump mass into the growing protostar. Before we discuss the accretion process in the following section, we here briefly mention that fragments with masses close to the opacity limit could survive if the accretion process were somehow prematurely curtailed. This mechanism has been found in the simulation of a collapsing present-day, turbulent molecular cloud (Bate et al. 2003). A fraction of the accreting cores is ejected, by slingshot interactions with neighboring ones, from the natal cloud before they could grow to stellar masses, and thus end up as brown dwarfs (Bate et al. 2002). Again, such a mechanism would only work in a clustered environment, and as discussed above, this might not be valid for primordial star formation. An alternative suggestion to produce primordial brown dwarfs invokes cooling due to HD which, as pointed out above, could lead to lower temperatures and higher densities (Uehara & Inutsuka 2000).
3.4 Accretion Physics
How massive were the first stars? Star formation typically proceeds from the ‘inside-out’, through the accretion of gas onto a central hydrostatic core. Whereas the initial mass of the hydrostatic core is very similar for primordial and present-day star formation (see above), the accretion process – ultimately responsible for setting the final stellar mass – is expected to be rather different. On dimensional grounds, the accretion rate is simply related to the sound speed cubed over Newton’s constant (or equivalently given by the ratio of the Jeans mass and the free-fall time): . A simple comparison of the temperatures in present-day star forming regions ( K) with those in primordial ones ( K) already indicates a difference in the accretion rate of more than two orders of magnitude.
Extending earlier work by Stahler et al. (1986), Omukai & Palla (2001, 2003) have investigated the accretion problem in considerable detail, going beyond the simple dimensional argument given above. Their computational technique approximates the time evolution by considering a sequence of steady-state accretion flows onto a growing hydrostatic core. Somewhat counterintuitively, these authors identify a critical accretion rate, yr-1, such that for accretion rates higher than this, the protostar cannot grow to masses much in excess of a few . For smaller rates, however, the accretion is predicted to proceed all the way up to , i.e., of order the host clump.
The physical basis for the critical accretion rate is that for ongoing accretion onto the core, the luminosity must not exceed the Eddington value, . In the early stages of accretion, before the onset of hydrogen burning, the luminosity is approximately given by . By demanding it follows
| (5) |
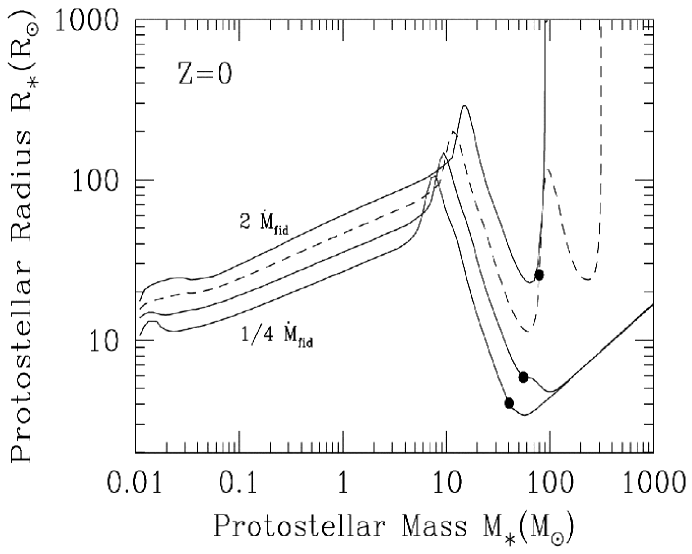
where , a typical value for a Population III main-sequence star (e.g., Bromm et al. 2001b). In Figure 5 (from Omukai & Palla 2003), the mass-radius relation is shown for various values of the accretion rate. As can be seen, the dramatic swelling in radius effectively shuts off accretion at , when the accretion rate exceeds .
Realistic accretion flows are expected to have a time-dependent rate, and the outcome will thus depend on whether the accretion rate will decline rapidly enough to avoid exceeding the Eddington luminosity at some stage during the evolution. The biggest caveat concerning the Omukai & Palla results seems to be the issue of geometry. A three-dimensional accretion flow of gas with some residual degree of angular momentum will deviate from spherical symmetry, and instead form a disk. It is then conceivable that most of the photons can escape along the axes whereas mass can flow in unimpeded through the accretion disk (see Tan & McKee 2003).
Recently, Bromm & Loeb (2003b) have used the SPH particle splitting technique to study the three-dimensional accretion flow around a primordial protostar. Whereas BCL created sink particles already at cm-3, briefly before three-body reactions would convert the gas into fully molecular form, the gas is now allowed to reach densities of cm-3 before being incorporated into a central sink particle. Bromm & Loeb (2003b) studied how the molecular core grows in mass over the first yr after its formation. The accretion rate is initially very high, yr-1, and subsequently declines according to a power law, with a possible break at yr. Expressed in terms of the sound speed in Population III prestellar cores, this initial rate is: . Therefore, as initial accretion rates of a few tens times are commonly encountered in simulations of present-day star formation, the Population III case might again be an example of a very generic type of behavior for collapse and accretion (see Larson 2003).
The mass of the molecular core, taken as an estimator of the protostellar mass, grows approximately as: . Rapidly, after only yr, the accretion rate drops below , at which point the stellar mass is . Since in this case the accretion rate becomes sub-critical early on, while the protostar still undergoes Kelvin-Helmholtz contraction (the descending portion of the curves in Figure 5), the dramatic expansion in radius, which according to Omukai & Palla (2003) would shut off further accretion, could be avoided. A rough upper limit for the final mass of the star is then: . This upper bound has been derived by conservatively assuming that accretion cannot go on for longer than the total lifetime of a very massive star (VMS), which is almost independent of stellar mass (e.g., Bond et al. 1984).
Can a Population III star ever reach this asymptotic mass limit? The answer to this question is not yet known with any certainty, and it depends on whether the accretion from the dust-free envelope is eventually terminated by feedback from the star (e.g., Omukai & Palla 2001, 2003, Ripamonti et al. 2002, Omukai & Inutsuka 2002, Tan & McKee 2003). The standard mechanism by which accretion may be terminated in metal-rich gas, namely radiation pressure on dust grains (Wolfire & Cassinelli 1987), is evidently not effective for gas with a primordial composition. Recently, it has been speculated that accretion could instead be turned off through the formation of an H II region (Omukai & Inutsuka 2002), or through the radiation pressure exerted by trapped Ly photons (Tan & McKee 2003). The termination of the accretion process defines the current unsolved frontier in studies of Population III star formation.
3.5 The Second Generation of Stars: Critical Metallicity
How and when did the transition take place from the early formation of massive stars to that of low-mass stars at later times? The very first stars, marking the cosmic Renaissance of structure formation, formed under conditions that were much simpler than the highly complex environment in present-day molecular clouds. Subsequently, however, the situation rapidly became more complicated again due to the feedback from the first stars on the IGM, both due to the production of photons and of heavy elements (see Section 4).
In contrast to the formation mode of massive stars (Population III) at high redshifts, fragmentation is observed to favor stars below a solar mass (Population I and II) in the present-day universe. The transition between these fundamental modes is expected to be mainly driven by the progressive enrichment of the cosmic gas with heavy elements (see Section 4.2), which enables the gas to cool to lower temperatures. The concept of a ‘critical metallicity’, , has been used to characterize the transition between Population III and Population II formation modes, where denotes the mass fraction contributed by all heavy elements (Omukai 2000, Bromm et al. 2001a, Schneider et al. 2002a, 2003a, Mackey et al. 2003). These studies have only constrained this important parameter to within a few orders of magnitude, , under the implicit assumption of solar relative abundances of metals. This assumption is likely to be violated by the metal yields of the first SNe at high-redshifts, for which strong deviations from solar abundance ratios are predicted (e.g., Heger & Woosley 2002, Qian et al. 2002, Qian & Wasserburg 2002, Umeda & Nomoto 2002, 2003, Sneden & Cowan 2003). The cooling rate of the metals depends on their ionization state, which is controlled by the ionizing backgrounds (UV and X-ray photons or cosmic rays) and which is still not well known (see Section 4.1).
Recently, Bromm & Loeb (2003c) have shown that the transition between the above star formation modes is driven primarily by fine-structure line cooling of singly-ionized carbon or neutral atomic oxygen. Earlier estimates of which did not explicitly distinguish between different coolants are refined by introducing separate critical abundances for carbon and oxygen, [C/H]crit and [O/H]crit, respectively, where [A/H]= , and a subscript ‘’ denotes solar values. Since C and O are also the most important coolants throughout most of the cool atomic interstellar medium (ISM) in present-day galaxies, it is not implausible that these species might be responsible for the global shift in the star formation mode. Indeed, under the temperature and density conditions that characterize Population III star formation, the most important coolants are O I and C II whose fine-structure lines dominate over all other metal transitions (Hollenbach & McKee 1989). Cooling due to molecules becomes important only at lower temperatures, and cooling due to dust grains only at higher densities (e.g., Omukai 2000, Schneider et al. 2003a). The presence of dust is likely to modify the equation of state at these high densities in important ways (Schneider et al. 2003a), and it will be interesting to explore its role in future collapse calculations. The physical nature of the dust, however, that is produced by the first SNe is currently still rather uncertain (e.g., Loeb & Haiman 1997, Todini & Ferrara 2001, Nozawa et al. 2003, Schneider et al. 2003b).
A strong UV flux just below the Lyman limit ( eV) is predicted to be emitted by the same stars that are responsible for the reionization of the IGM (see Section 4.1). This soft UV radiation can penetrate the neutral IGM and ionize any trace amount of neutral carbon due to its low first-ionization potential of 11.26 eV. Since carbon is highly underabundant, the UV background can ionize carbon throughout the universe well before hydrogen reionization. Oxygen, on the other hand, will be predominantly neutral prior to reionization since its ionization potential is 13.62 eV. Cooling is mediated by excitations due to collisions of the respective metal with free electrons or hydrogen atoms. At the low fractional abundances of electrons, , expected in the neutral (rapidly recombining) gas at , collisions with hydrogen atoms dominate. This renders the analysis independent of the very uncertain hydrogen-ionizing backgrounds at high redshifts (cosmic rays or soft X-rays).
To derive the critical C and O abundances, Bromm & Loeb (2003c) start with the characteristic state reached in primordial gas that cools only through molecular hydrogen (Section 3.2). For the gas to fragment further, additional cooling due to C II or O I is required. Fragmentation requires that the radiative cooling rate be higher than the free-fall compressional heating rate. The critical metal abundances can thus be found by equating the two rates: , where is Boltzmann’s constant. The critical C and O abundances are found by setting and , resulting in [C/H] and [O/H]. Strictly speaking, these threshold levels are the required abundances in the gas phase.
Even if sufficient C or O atoms are present to further cool the gas, there will be a minimum attainable temperature that is set by the interaction of the atoms with the thermal CMB: (e.g., Larson 1998, Clarke & Bromm 2003). At , this results in a characteristic stellar mass of , where is the density at which opacity prevents further fragmentation (e.g., Rees 1976). It is possible that the transition from the high-mass to the low-mass star formation mode was modulated by the CMB temperature and was therefore gradual, involving intermediate-mass (‘Population II.5’) stars at intermediate redshifts (Mackey et al. 2003). This transitional population could give rise to the faint SNe that have been proposed to explain the observed abundance patterns in metal-poor stars (Umeda & Nomoto 2002, 2003).
When and how uniformly the transition in the cosmic star formation mode did take place was governed by the detailed enrichment history of the IGM. This in turn was determined by the hydrodynamical transport and mixing of metals from the first SN explosions. We will discuss the SN-driven dispersal of heavy elements in Section 4.2.
4 FEEDBACK EFFECTS ON THE IGM
4.1 Radiative Feedback: The Suicidal Nature of the First Stars
The radiation produced by Population III star formation will influence the subsequent thermal history of the IGM, and will modify the properties of star forming gas. This radiative feedback may occur in a variety of ways, depending on the energy range of the stellar photons. As we have seen, molecular hydrogen is the main coolant in low temperature metal-free gas, enabling the formation of the first stars at . We will therefore first focus on the radiative effects that are able to influence the H2 chemistry. This feedback could be either negative, if due to soft UV photons, or positive, if due to X-rays.
We begin by discussing the negative feedback. Molecular hydrogen is fragile and can readily be destroyed by photons in the Lyman-Werner (LW) bands, within the energy range eV, via the two-step Solomon process (Stecher & Williams 1967)
| (6) |
The intermediate stage involves an excited electronic state, , from which a fraction of the subsequent decays end in the vibrational continuum of the ground state, resulting in the dissociation of the molecule (e.g., Glover & Brand 2001). The question arises whether H2 cooling can be suppressed in halos that virialize after the first stars have formed and built up a background of LW photons (e.g., Haiman et al. 1997). These photons can easily penetrate a still neutral IGM prior to reionization (having energies just below the Lyman limit). These second-generation halos are typically more massive compared to the systems that host the formation of the first stars at . The gas might then be able to self-shield against the photo-dissociating LW background (e.g., Glover & Brand 2001, Kitayama et al. 2001, Machacek et al. 2001). The effect of self-shielding is often taken into account, both in simulations and in analytical work, by writing the H2 photodissociation rate as , with a proportionality constant that depends on the spectrum of the background radiation. Here, measures the flux at the Lyman limit in the customary units of ergs s-1 cm-2 Hz-1 sr-1. For the shielding factor, the following approximate expression is usually used: (Draine & Bertoldi 1996). This formula is accurate only for a static medium, and it will grossly overestimate the H2 line opacity in the presence of large-scale velocity gradients. In cases with strong bulk flows, the effect of self-shielding is conservatively overestimated.
The overall normalization of the LW background, and its evolution with redshift, is still rather uncertain. Close to the epoch of reionization, however, a significant flux in the LW bands ( eV) is expected (e.g., Bromm & Loeb 2003a). The flux in the LW bands just below the Lyman limit, , could be much larger than that just above, . Assuming that only a fraction, , of the ionizing photons can escape from the star forming halos, one has: . This could be quite large, since is expected to be low at high redshifts (Wood & Loeb 2000, and references therein). Alternatively, a strong background of photo-dissociating photons could also arise internally from star formation in an early dwarf galaxy itself (e.g., Omukai & Nishi 1999, Oh & Haiman 2002).
The strong UV background flux estimated above makes it possible for H2 formation to be effectively suppressed close to the redshift of reionization. In the absence of molecular hydrogen, however, cooling can still proceed via atomic transitions in halos of mass (see Barkana & Loeb 2001)
| (7) |
The virial temperature, K, in these more massive halos allows for the very efficient cooling of the gas via lines of atomic hydrogen (e.g., Madau et al. 2001, Bromm & Clarke 2002). In cases where the gas temperature is close to the virial temperature, the gas cloud as a whole can undergo collapse but it will not be able to fragment until high enough densities are reached so that the Jeans mass has declined sufficiently (Oh & Haiman 2002, Bromm & Loeb 2003a). Recent numerical simulations of the collapse of a dwarf galaxy at , massive enough for atomic H cooling to operate, but where cooling due to H2 is effectively suppressed by a strong LW background, have shown that very massive (), compact (radii pc) gas clouds form in the center of the DM potential well (Bromm & Loeb 2003a). These clouds may be the immediate progenitors of supermassive black holes that could seed high-redshift quasar activity.
In contrast to this negative feedback on H2, opposing positive feedbacks have been proposed. As discussed in Section 2, H2 formation is primarily facilitated by free electrons. Any process which temporarily enhances their abundance, therefore, will also tend to increase the H2 fraction. Various mechanisms have been suggested. First, X-ray photons from SN remnants (e.g., Oh 2001, Cen 2003a) or the accretion onto black holes could ionize hydrogen in dense regions, enabling the reformation of H2 (Glover & Brand 2003, Machacek et al. 2003). Second, the free electrons in relic H II regions (Oh & Haiman 2003), or inside the outer boundary of a still active one (Ricotti et al. 2001, 2002a, b), may accomplish the same. Finally, the collisional ionization in shock waves, and the subsequent non-equilibrium cooling and molecule reformation has been discussed (e.g., Mac Low & Shull 1986, Shapiro & Kang 1987, Ferrara 1998, Bromm et al. 2003). The last mechanism evidently is not strictly radiative in nature, but it seems appropriate to include it here. In summary, conclusions on the overall sign of the radiative feedback on the H2 chemistry are still very uncertain. To reach more robust results, sophisticated cosmological simulations are required, treating the build-up of the radiation backgrounds, and their influence on the overall star formation rate in a self-consistent manner. Such challenging simulations are currently still beyond our capabilities.
A qualitatively different feedback is the photoheating due to radiation with energies high enough to ionize hydrogen atoms (see Barkana & Loeb 2001 for a comprehensive discussion). Since photoionization-heating raises the gas temperature to K, this gas is then evaporated out of the small potential wells at high redshifts (with virial temperatures K), and star formation is thus temporarily shut off in these halos. This photoevaporation feedback could be due to sources in the halo itself (e.g., Bromm et al. 2003, Oh & Haiman 2003, Whalen et al. 2003), or to an external ionizing background (e.g., Barkana & Loeb 1999, Susa & Umemura 2000, Kitayama et al. 2001, Dijkstra et al. 2003, Shapiro et al. 2003, Tassis et al. 2003). The external feedback is likely to become important only at redshifts close to the complete reionization of the universe at , whereas the internal one could operate already at much higher redshifts.
4.2 Chemical Feedback: First Supernovae and Early Metal Enrichment
The crucial transition from a smooth, homogeneous universe to an increasingly complex and structured one is marked by the death of the first stars. The SN explosions at the end of the initial burst of Population III star formation disperse the first elements into the hitherto pristine IGM. How did this initial metal enrichment proceed? To account for the widespread presence of metals in the Ly forest at (e.g., Songaila 2001, Schaye et al. 2003), star formation in low-mass systems at has been proposed as a likely source (e.g., Madau et al. 2001, Mori et al. 2002, Wada & Venkatesan 2003). The metals produced in these low-mass halos can more easily escape from their shallow potential wells than those at lower redshift (e.g., Aguirre et al. 2001a,b). In addition, the enriched gas has to travel much shorter distances between neighboring halos at these early times, and it might therefore have been easier to establish a uniform metal distribution in the IGM.
The important question arises: How did the first stars die? The answer to this question sensitively depends on the precise mass of a Population III star. In particular, if the star has a mass in the narrow interval , it will explode as a pair-instability supernova (PISN), leading to the complete disruption of the progenitor (e.g., Fryer et al. 2001, Heger et al. 2003). Population III stars with masses below or above the PISN range are predicted to form black holes. This latter fate is not accompanied by a significant dispersal of heavy elements into the IGM, since most of the newly synthesized metals will be locked up in the black hole. The PISN, however, will contribute all its heavy element production to the surrounding gas.
As we have discussed in Section 3.5, the IGM metal enrichment history is crucial for understanding the detailed transition in the star formation mode from high-mass to low-mass dominated. If this enrichment is very uniform, the transition would occur rather suddenly; if, on the other hand, enrichment would be very patchy, with islands of high-metallicity gas embedded in mostly still pristine material, then the transition would occur in a non-synchronized way, probably occupying a considerable time interval (e.g., Scannapieco et al. 2003).
Recently, Bromm et al. (2003) have presented numerical simulations of the first supernova explosions at high redshifts (). In contrast to earlier work, both analytical (e.g., Larson 1974, Dekel & Silk 1986, Scannapieco et al. 2002, Furlanetto & Loeb 2003) and numerical (e.g., Mori et al. 2002, Thacker et al. 2002, Wada & Venkatesan 2003), their focus is on the minihalos that are the sites for the formation of the very first stars. These halos, with masses of and virializing at , are the sites for the formation of the truly first stars. It is not obvious, however, whether star formation in more massive systems would not already be significantly altered by the activity of previous generations of stars. In particular, PISN explosions may only have occurred in the minihalos mentioned above.
Bromm et al. (2003) assume that there is one single Population III star in the center of the minihalo, and that this star is massive enough to explode as a PISN. To span the possible energy range, explosion energies of and ergs are considered, corresponding to stars with masses and (Fryer et al. 2001). The latter case marks the upper mass limit of the PISN regime. The explosion energy is inserted as thermal energy, such that the explosion is initialized with conditions appropriate for the adiabatic Sedov-Taylor (ST) phase. Since the PISN is completely disrupted without leaving a remnant behind, it is possible to trace the subsequent fate of the metals by using the SPH particles that represent the stellar ejecta as markers.
Initially, the blast wave evolves into a roughly uniform medium at radii pc, resulting in the usual ST scaling: . Once the blast wave reaches beyond the core, however, it encounters an isothermal density profile in the remainder of the halo, leading to the scaling (e.g., Ostriker & McKee 1988): . A few yr after the explosion, radiative (inverse Compton) losses become important, and the SN remnant enters its final, snowplow phase. The significance of inverse Compton cooling distinguishes very high- SN explosions from those occurring in the present-day universe.
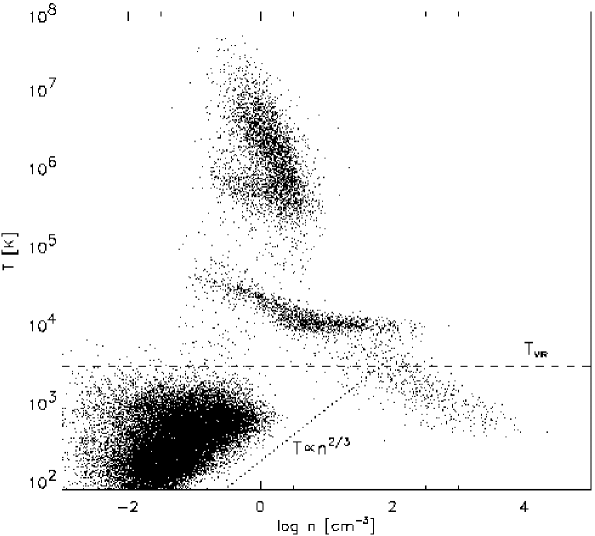
After approximately yr, when , a dense shell begins to form at a radius pc. The thermodynamic properties of the dense shell, the interior bubble, and the surrounding medium are summarized in Figure 6. The shocked, swept-up gas exhibits three distinct thermal phases, as can clearly be discerned in Fig. 6: the first at K, the second at K, and the third at K, with the latter two corresponding to the dense shell. The cooling from very high temperatures to K, and subsequently to K, proceeds in non-equilibrium, such that a fraction of free electrons persists below K, allowing the re-formation of H2 (e.g., Mac Low & Shull 1986, Shapiro & Kang 1987, Oh & Haiman 2002). The molecular fraction in the densest regions asymptotically assumes a ‘plateau’ value of . Inside the expanding SN remnant lies a hot pressurized bubble (the grey symbols in Fig. 6) that corresponds to the original stellar ejecta. This bubble drives the outward motion, and its gas is slowly cooled by adiabatic expansion and inverse Compton losses.
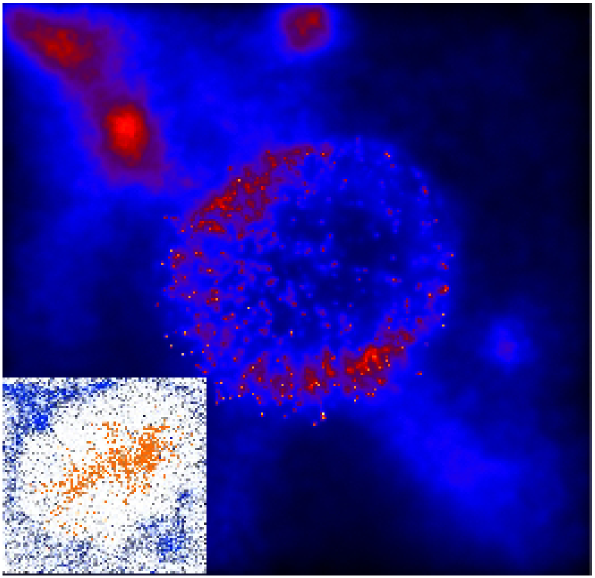
In Figure 7, the projected gas density is shown yr after the explosion for explosion energy ergs. The blast wave has succeeded in completely disrupting the minihalo, dispersing most of the halo gas into the IGM. Comparing with the binding energy of the minihalo, ergs, such an outcome is clearly expected. It depends, however, on the inefficient radiative processes that cool the hot bubble gas in the initial stages of expansion.
The second prominent feature in Fig. 7 is the vigorous fragmentation of the dense shell into a large number of small cloudlets. The emergence of these cloudlets, corresponding to gas at K, is not driven by gravity (e.g., Elmegreen 1994 and references therein), but is instead due to a thermal instability triggered by the onset of atomic cooling. The explosions simulated by Bromm et al. (2003) do not result in the formation of lower-mass stars, or Population II.5 stars in the terminology of Mackey et al. (2003). This is consistent with the prediction in Mackey et al. (2003) that Population II.5 stars can only form in dark matter halos massive enough to be able to cool via atomic hydrogen (see also Salvaterra et al. 2003). To further test the possibility of SN triggered star formation in the high-redshift universe, it will be necessary to explore a range of cosmological environments, corresponding to different halo masses and collapse redshifts.
What is the fate of the metals that are produced in the PISN progenitor? PISNe are predicted to have substantial metal yields, of the order of , and for the largest stellar masses in the PISN range, most of is made up of iron (Heger & Woosley 2002). Bromm et al. (2003) find that for ergs, % of the metals have escaped from the DM minihalo yr after the explosion. The metals have filled most of the interior hot bubble (see inset of Fig. 7), and there has not yet been sufficient time for them to significantly mix into the dense surrounding shell. A rough estimate of the resulting metallicity in the surrounding, contaminated IGM can be obtained as follows: . This value is well above the critical metallicity threshold, , for enabling the formation of lower-mass stars (see Section 3.5). The conclusion is that Population III stars can continue to form in the pristine gas within the neighboring halos, as the metals that are dispersed in the explosion do not reach them.
Whereas a single SN explosion might be able to evacuate most of the gas from a minihalo, the situation could be quite different for multiple SN explosions in early dwarf galaxies of mass (Mori et al. 2002, Wada & Venkatesan 2003). In this case, the simulations indicate that off-nuclear SN explosions drive inward-propagating blast waves that act to assemble gas in the central regions of the host galaxy. The gas in these galaxies may thus be able to survive multiple SN explosions, and star formation would not be significantly suppressed due to the mechanical SN feedback. In summary, it appears that the effect of SN events on star formation in early galaxies, and on the chemical and thermal evolution of the IGM depends sensitively on the specific environment.
For the PISN explosion studied by Bromm et al. (2003), the extent of the metal enriched region, with a physical size of kpc, is comparable to the radius of the relic H II region around the minihalo. In a related paper (Yoshida et al. 2004), it is argued that if Population III stars have led to an early partial reionization of the universe, as may be required by the recent WMAP results (see Section 5.1), this will have resulted in a nearly uniform enrichment of the universe to a level already at . It would indeed be a remarkable feature of the universe, if the first stars had endowed the IGM with such a widespread, near-universal level of pre-enrichment (see also Oh et al. 2001). An interesting implication could be the observability of unsaturated metal absorption lines at , which would probe the neutral fraction of the IGM during the epoch of reionization (Oh et al. 2002).
We end this section by emphasizing that we are only beginning to understand the complex processes that distributed the first heavy elements into the IGM, and more sophisticated numerical simulations are required for further progress.
5 OBSERVATIONAL SIGNATURE
An increasing variety of observational probes of the first stars has been suggested (e.g., Haiman & Loeb 1997, Oh et al. 2003, Stiavelli et al. 2003). Below, we focus on three of them, and here only briefly mention some of the others (see Barkana & Loeb 2001 for a comprehensive discussion). Intriguing possibilities would arise if the Population III IMF were sufficiently top-heavy to enable the formation of massive black holes (e.g., Madau & Rees 2001, Islam et al. 2003, Volonteri et al. 2003). Possible consequences might include backgrounds of gravitational waves (Schneider et al. 2000, de Araujo et al. 2002) and diffuse neutrinos (Schneider et al. 2002b). In the latter case, the high-energy (TeV) neutrinos might originate in the relativistic jets that are associated with gamma-ray bursts (GRBs), which are believed to accompany the birth of a black hole (see Section 5.3).
The integrated light emitted during the lifetime of Population III stars is predicted (Bond et al. 1986, Santos et al. 2002, Salvaterra & Ferrara 2003) to significantly contribute to the locally observed cosmic near-infrared background (e.g., Hauser & Dwek 2001). A related signature is the Population III contribution to the background anisotropy (Magliocchetti et al. 2003, Cooray et al. 2003). Finally, 21 cm radiation from neutral hydrogen, both in emission and absorption, could provide a unique probe of the conditions in the early minihalos, thus testing our assumptions on the initial conditions for Population III star formation (e.g., Madau et al. 1997, Tozzi et al. 2000, Carilli et al. 2002, Furlanetto & Loeb 2002, Iliev et al. 2002, 2003, Ciardi & Madau 2003). In practice, these observations may be extremely challenging, however, due to the strong foreground contamination (Di Matteo et al. 2002).
In the following, we discuss three empirical probes of the first stars in somewhat greater detail, as they have already provided us with constraints on the nature of the first stars, or soon promise to do so.
5.1 Reionization Signature from the First Stars
The WMAP satellite has recently measured, from the CMB polarization anisotropies (Kaplinghat et al. 2003), the total optical depth to Thomson scattering: (Kogut et al. 2003, Spergel et al. 2003). Such a high value is surprising. We know that the IGM was completely ionized again at redshifts from the absence of Gunn-Peterson troughs in high-redshift Sloan Digital Sky Survey (SDSS) quasars (e.g., Fan et al. 2003). Scattering from free electrons between only contributes . The observed excess must have arisen from the scattering of CMB photons off free electrons ionized by star formation at higher redshifts. It has been shown that normal stellar populations (characterized by a standard IMF, or at most a modestly top-heavy one with characteristic mass ) could have successfully reproduced the measured high optical depth, if reionization had occurred already at (Ciardi et al. 2003).
Such a solution, however, runs into difficulties when two other empirical constraints are taken into account. The first one considers the thermal history of the post-reionization IGM (e.g., Theuns et al. 2002, Hui & Haiman 2003). After reionization is completed, the IGM continues to be heated by photoionization. This heating, however, cannot compete with the cooling due to adiabatic (Hubble) expansion. In consequence, the earlier reionization occurred, the lower the IGM temperature at a given fixed redshift. Observations at indicate that the last complete overlap of ionizing bubbles (i.e., the last time the IGM was completely ionized) could not have occurred before a redshift . The second constraint that is difficult to accommodate within the model of Ciardi et al. (2003), is the detection of select SDSS quasars at with Gunn-Peterson absorption in their vicinity. It is not easy to see how islands of neutral gas could have persisted down to , if the IGM had already been completely reionized at .
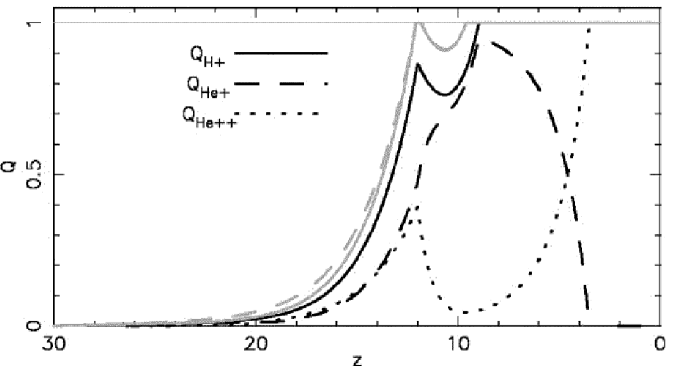
To simultaneously account for all the available observational constraints thus poses a non-trivial challenge to theory. It has been suggested that an early generation of very massive Population III stars, as predicted by numerical simulations (see Section 3), could naturally allow for a solution (Cen 2003a,b, Haiman & Holder 2003, Somerville & Livio 2003, Wyithe & Loeb 2003a,b). The high efficiency of producing ionizing photons per stellar baryon for very massive Population III stars (e.g., Tumlinson & Shull 2000, Bromm et al. 2001b, Schaerer 2002, 2003), can lead to an early, first episode of at least partial reionization at , thus ensuring a sufficiently large optical depth to Thomson scattering. As we have discussed in Section 4, Population III star formation was self-limiting, both due to the effect of radiation and the dispersal of heavy elements. After the era of Population III star formation at , the IGM was able to recombine again, due to the temporary lull in the production of ionizing photons. Eventually, normal (Population II) stars form in more massive (dwarf-sized) systems, and lead to the final, complete reionization of the universe at . In this case, there is no conflict with the empirical constraints outlined above. In Figure 8, a sample reionization history is shown that is representative for the ‘double-reionization’ models (from Wyithe & Loeb 2003b). At present, the error bars in the WMAP determination of are still too large to firmly establish the need for very massive Population III stars to have formed in the high-redshift universe. At the end of its mission, however, the error on is estimated to have gone down to . If the high current value were to persist, the evidence for a top-heavy IMF in primordial star formation would have been considerably strengthened.
Cosmological models with reduced small-scale power (see Section 2) cannot easily be reconciled with a high value of (Somerville et al. 2003, Yoshida et al. 2003b,c). To compensate for the missing contribution from minihalos, one would have to invoke an extremely high ionizing photon production rate in galaxies at . This could in principle be achieved by maintaining a top-heavy IMF over a long period, . The problem with such a scenario is the severe overproduction of metals. These would have to be ‘hidden’ to an improbable degree of precision so that the formation of massive Population III stars were not terminated too early on (Yoshida et al. 2004). The study of the first stars thus has the exciting potential to provide astrophysical constraints on the nature of dark matter particles.
5.2 Stellar Archaeology: Relics from the End of the Dark Ages
It has long been realized that the most metal-poor stars found in our cosmic neighborhood would encode the signature from the first stars within their elemental abundance pattern (e.g., Bond 1981, Beers et al. 1992). For many decades, however, the observational search has failed to discover a truly first-generation star with zero metallicity. Indeed, there seemed to have been an observational lower limit of [Fe/H] (e.g., Carr 1987, Oey 2003). In view of the recent theoretical prediction that most Population III stars were very massive, with associated lifetimes of yr, the failure to find any ‘living’ Population III star in the Galaxy is not surprising, as they all would have died a long time ago (e.g., Hernandez & Ferrara 2001). Furthermore, theory has predicted that star formation out of extremely low-metallicity gas, with (see Section 3.5), would be essentially equivalent to that out of truly primordial gas. Again, this theoretical prediction was in accordance with the apparent observed lower-metallicity cutoff.

Recently, however, this simple picture has been challenged by the discovery of the star HE0107-5240 with a mass of and an iron abundance of (Christlieb et al. 2002). This finding indicates that at least some low mass stars could have formed out of extremely low-metallicity gas. Does the existence of this star invalidate the theory of a metallicity threshold for enabling low-mass star formation? As pointed out by Umeda & Nomoto (2003), a possible explanation could lie in the unusually high abundances of carbon and oxygen in HE0107-5240. As discussed in Section 3.5, Bromm & Loeb (2003c) have demonstrated that indeed C and O may have been the main drivers for the Population III to II transition.
In Figure 9 we compare the theoretical thresholds derived by Bromm & Loeb (2003c) to the observed C and O abundances in metal-poor dwarf (Akerman et al. 2003) and giant (Cayrel et al. 2003) stars in the halo of our Galaxy. As can be seen, all data points lie above the critical O abundance but a few cases lie below the critical C threshold. All of these low mass stars are consistent with the model since the corresponding O abundances lie above the predicted threshold. The sub-critical [C/H] abundances could have either originated in the progenitor cloud or from the mixing of CNO-processed material (with carbon converted into nitrogen) into the stellar atmosphere during the red giant phase. To guard against this a posteriori processing of C (and to a lesser degree of O), dwarf stars should be used as they provide a more reliable record of the primordial abundance pattern that was present at birth. The current data on dwarf stars (filled symbols in Fig. 9) does not yet reach C and O abundances that are sufficiently low to probe the theoretical cooling thresholds. Note also that the extremely iron-poor star HE0107-5240 has C and O abundances that both lie above the respective critical levels. The formation of this low mass star () is therefore consistent with the theoretical framework considered by Bromm & Loeb (2003c).
The lessons from stellar archaeology on the nature of the first stars are likely to increase in importance, since greatly improved, large surveys of metal-poor Galactic halo stars are under way, or are currently being planned.
5.3 Gamma-Ray Bursts as Probes of the First Stars
GRBs are the brightest electromagnetic explosions in the universe, and they should be detectable out to very high redshifts (e.g., Wijers et al. 1998, Blain & Natarajan 2000, Ciardi & Loeb 2000, Lamb & Reichart 2000, Bromm & Loeb 2002, Choudhury & Srianand 2002). Although the nature of the central engine that powers the relativistic jets is still debated, recent evidence indicates that GRBs trace the formation of massive stars (e.g., Bloom et al. 2002, and references therein). Since the first stars are predicted to be predominantly very massive, their death might possibly give rise to GRBs at very high redshifts (e.g., Schneider et al. 2002b). A detection of the highest-redshift GRBs would probe the earliest epochs of star formation, one massive star at a time (e.g., Barkana & Loeb 2003, Mészáros & Rees 2003). The upcoming Swift satellite333See http://swift.gsfc.nasa.gov., planned for launch in 2004, is expected to detect about a hundred GRBs per year. The redshifts of high- GRBs can be easily measured through infrared photometry, based on the Gunn-Peterson trough in their spectra due to Ly absorption by neutral intergalactic hydrogen along the line of sight. Which fraction of the detected bursts will originate at redshifts ?

To assess the utility of GRBs as probes of the first stars, one has to calculate the expected redshift distribution of GRBs (e.g., Bromm & Loeb 2002, Choudhury & Srianand 2002). Under the assumption that the GRB rate is simply proportional to the star formation rate, Bromm & Loeb (2002) find that about a quarter of all GRBs detected by Swift, will originate from a redshift (see Fig. 10). This estimate takes into account the detector sensitivity, but it is still very uncertain because of the poorly determined GRB luminosity function. The rate of high-redshift GRBs may, however, be significantly suppressed if the early massive stars fail to launch a relativistic outflow. This is conceivable, as metal-free stars may experience negligible mass loss before exploding as a supernova (Baraffe et al. 2001). They would then retain their massive hydrogen envelope, and any relativistic jet might be quenched before escaping from the star (Heger et al. 2003).
If high-redshift GRBs exist, the launch of Swift will open up an exciting new window into the cosmic dark ages. Different from quasars or galaxies that fade with increasing redshift, GRB afterglows maintain a roughly constant observed flux at different redshifts for a fixed observed time lag after the -ray trigger (Ciardi & Loeb 2000). The increase in the luminosity distance at higher redshifts is compensated by the fact that a fixed observed time lag corresponds to an intrinsic time shorter by a factor of in the source rest-frame, during which the GRB afterglow emission is brighter. This quality makes GRB afterglows the best probes of the metallicity and ionization state of the intervening IGM during the epoch of reionization. In contrast to quasars, the UV emission from GRBs has a negligible effect on the surrounding IGM (since ergs can only ionize of hydrogen). Moreover, the host galaxies of GRBs induce a much weaker perturbation to the Hubble flow in the surrounding IGM, compared to the massive hosts of the brightest quasars (Barkana & Loeb 2003). Hence, GRB afterglows offer the ideal probe (much better than quasars or bright galaxies) of the damping wing of the Gunn-Peterson trough (Miralda-Escudé 1998) that signals the neutral fraction of the IGM as a function of redshift during the epoch of reionization.
6 EPILOGUE: THE ROAD AHEAD
One of the fascinating aspects of the recent research on the first stars has been the confluence of many hitherto unrelated subfields. To fully explore its rich potential, we have to utilize both in situ, high-redshift studies, as well as near-field cosmological data (Freeman & Bland-Hawthorn 2002). The latter approach refers to the stellar archaeology of observing the chemical abundance patterns in extremely metal-poor Galactic halo stars (see Section 5.2). Furthermore, the study of the first stars lies at the intersection of star formation theory with cosmological structure formation, where the scales for the phenomena overlap. Similarly, there is also an overlap between star and galaxy formation, because at this early time the scale of galaxies and the scale of star-forming clouds had not yet become clearly separated. Therefore, we can investigate all of these phenomena in their most elementary form, before their scales had become widely separated and before the universe had evolved into the vastly more complicated structure that we observe today, where there is a huge range of scales at play.
Most of the work so far has been theoretical, but the field is driven by the prospect of upcoming observational probes that will soon test the theoretical predictions. The WMAP satellite has already provided important clues, and Swift will soon do so as well. Most importantly, NASA’s planned successor mission to the Hubble Space Telescope, the JWST, to be launched around 2011, is a prime driver behind current cosmological research. The JWST is designed to image the first stars, supernovae, and quasars. In thinking ahead, pondering about the first glimpses that we have gained into the cosmic dark ages, one wonders what exciting discoveries are awaiting us.
ACKNOWLEDGMENTS
We express our gratitude to Paolo Coppi for the many discussions on the work discussed in this review. VB thanks Avi Loeb and Lars Hernquist at the Harvard-Smithsonian Center for Astrophysics for support from NSF grant AST 00-71019, as well as Cathie Clarke at the Institute of Astronomy in Cambridge from the European Community’s Research Training Network under contract HPRN-CT-2000-0155, ‘Young Stellar Clusters’.
References
- 1. Abel T, Anninos P, Norman ML, Zhang Y. 1998. Ap. J. 508:518–29
- 2. Abel T, Anninos P, Zhang Y, Norman ML. 1997. New Astron. 2:181–207
- 3. Abel T, Bryan G, Norman ML. 2000. Ap. J. 540:39–44
- 4. Abel T, Bryan G, Norman ML. 2002. Science 295:93–8
- 5. Aguirre A, Hernquist L, Schaye J, Katz N, Weinberg DH, Gardner J. 2001a. Ap. J. 561:521–49
- 6. Aguirre A, Hernquist L, Schaye J, Weinberg DH, Katz N, Gardner J. 2001b. Ap. J. 560:599–605
- 7. Akerman CJ, Carigi L, Nissen PE, Pettini M, Asplund M. 2003. Astron. Astrophys. In press (astro-ph/0310472)
- 8. Anninos P, Norman ML. 1996. Ap. J. 460:556–68
- 9. Baade W. 1944. Ap. J. 100:137–46
- 10. Balsara D. 2001. J. Korean Astron. Soc. 34:S181–90
- 11. Baraffe I, Heger A, Woosley SE. 2001. Ap. J. 550:890–6
- 12. Barkana R, Loeb A. 1999. Ap. J. 523:54–65
- 13. Barkana R, Loeb A. 2001. Phys. Rep. 349:125–238
- 14. Barkana R, Loeb A. 2003. Ap. J. In press (astro-ph/0305470)
- 15. Barkat Z, Rakavy G, Sack N. 1967. Phys. Rev. Lett. 18:379–81
- 16. Bate MR, Bonnell IA, Bromm V. 2002. MNRAS 332:L65–8
- 17. Bate MR, Bonnell IA, Bromm V. 2003. MNRAS 339:577–99
- 18. Bate MR, Bonnell IA, Price NM. 1995. MNRAS 277:362–76
- 19. Beers TC, Preston GW, Shectman SA. 1992. Astron. J. 103:1987–2034
- 20. Blain AW, Natarajan P. 2000. MNRAS 312:L35–8
- 21. Bloom JS, Kulkarni SR, Djorgovski SG. 2002. Astron. J. 123:1111–48
- 22. Bode P, Ostriker JP, Turok N. 2001. Ap. J. 556:93–107
- 23. Bond HE. 1981. Ap. J. 248:606–11
- 24. Bond JR, Arnett WD, Carr BJ. 1984. Ap. J. 280:825–47
- 25. Bond JR, Carr BJ, Hogan CJ. 1986. Ap. J. 306:428–50
- 26. Bromm V. 2000. Star formation in the early universe PhD thesis. Yale University, New Haven, CT. 165 pp.
- 27. Bromm V, Clarke CJ. 2002. Ap. J. 566:L1–4
- 28. Bromm V, Coppi PS, Larson RB. 1999. Ap. J. 527:L5–8
- 29. Bromm V, Coppi PS, Larson RB. 2002. Ap. J. 564:23–51
- 30. Bromm V, Ferrara A, Coppi PS, Larson RB. 2001a. MNRAS 328:969–76
- 31. Bromm V, Kudritzki RP, Loeb A. 2001b. Ap. J. 552:464–72
- 32. Bromm V, Loeb A. 2002. Ap. J. 575:111–6
- 33. Bromm V, Loeb A. 2003a. Ap. J. 596:34–46
- 34. Bromm V, Loeb A. 2003b. In The Emergence of Cosmic Structure, ed. SS Holt, CS Reynolds, pp. 73–83, Woodbury, New York: Am. Inst. Phys.
- 35. Bromm V, Loeb A. 2003c. Nature 425:812–4
- 36. Bromm V, Yoshida N, Hernquist L. 2003. Ap. J. 596:L135–8
- 37. Carilli CL, Gnedin NY, Owen F. 2002. Ap. J. 577:22–30
- 38. Carlberg RG. 1981. MNRAS 197:1021–9
- 39. Carr BJ. 1987. Nature 326:829–30
- 40. Carr BJ. 1994. Annu. Rev. Astron. Astrophys. 32:531–90
- 41. Carr BJ, Bond JR, Arnett WD. 1984. Ap. J. 277:445–69
- 42. Cayrel R. 1986. Astron. Astrophys. 168:81–8
- 43. Cayrel R, Depagne E, Spite M, Hill V, Spite F, et al. 2003. Astron. Astrophys. Submitted
- 44. Cen R. 2003a. Ap. J. 591:L5–8
- 45. Cen R. 2003b. Ap. J. 591:12–37
- 46. Choudhury TR, Srianand R. 2002. MNRAS 336:L27–31
- 47. Christlieb N, Bessell MS, Beers TC, Gustafsson B, Korn A, et al. 2002. Nature 419:904–6
- 48. Ciardi B, Ferrara A, Abel T. 2000a. Ap. J. 533:594–600
- 49. Ciardi B, Ferrara A, Governato F, Jenkins A. 2000b. MNRAS 314:611–29
- 50. Ciardi B, Ferrara A, White SDM. 2003. MNRAS 344:L7–11
- 51. Ciardi B, Loeb A. 2000. Ap. J. 540:687–96
- 52. Ciardi B, Madau P. 2003. Ap. J. 596:1–8
- 53. Clarke CJ, Bromm V. 2003. MNRAS 343:1224–30
- 54. Cooray A, Bock JJ, Keating B, Lange AE, Matsumoto T. 2003. Ap. J. In press (astro-ph/0308407)
- 55. Couchman HMP, Rees MJ. 1986. MNRAS 221:53–62
- 56. de Araujo JCN, Miranda O, Aguiar OD. 2002. MNRAS 330:651–9
- 57. Dekel A, Silk J. 1986. Ap. J. 303:39–55
- 58. Dijkstra M, Haiman Z, Rees MJ, Weinberg DH. 2003. Ap. J. Submitted (astro-ph/0308042)
- 59. Di Matteo T, Perna R, Abel T, Rees MJ. 2002. Ap. J. 564:576–80
- 60. Draine BT, Bertoldi F. 1996. Ap. J. 468:269–89
- 61. Eisenstein DJ, Loeb A. 1995. Ap. J. 443:11–7
- 62. Elmegreen BG. 1994. Ap. J. 427:384–7
- 63. Fan X, Strauss MA, Schneider DP, Becker RH, White RL, et al. 2003. Astron. J. 125:1649–59
- 64. Ferrara A. 1998. Ap. J. 499:L17–20
- 65. Ferrara A, Pettini M, Shchekinov Y. 2000. MNRAS 319:539–48
- 66. Flores RA, Primack JR. 1994. Ap. J. 427:L1–4
- 67. Flower DR, Le Bourlot J, Pineau des Forêts G, Roueff E. 2000. MNRAS 314:753–8
- 68. Freeman K, Bland-Hawthorn J. 2002. Annu. Rev. Astron. Astrophys. 40:487–537
- 69. Fryer CL, Woosley SE, Heger A. 2001. Ap. J. 550:372–82
- 70. Fuller TM, Couchman HMP. 2000. Ap. J. 544:6–20
- 71. Furlanetto SR, Loeb A. 2002. Ap. J. 579:1–9
- 72. Furlanetto SR, Loeb A. 2003. Ap. J. 588:18–34
- 73. Galli D, Palla F. 1998. Astron. Astrophys. 335:403–20
- 74. Glover SCO, Brand PWJL. 2001. MNRAS 321:385–97
- 75. Glover SCO, Brand PWJL. 2003. MNRAS 340:210–26
- 76. Gnedin NY, Ostriker JP. 1997. Ap. J. 486:581–98
- 77. Haiman Z, Abel T, Rees MJ. 2000. Ap. J. 534:11–24
- 78. Haiman Z, Holder GP. 2003. Ap. J. 595:1–12
- 79. Haiman Z, Loeb A. 1997. Ap. J. 483:21–37
- 80. Haiman Z, Loeb A. 2001. Ap. J. 552:459–63
- 81. Haiman Z, Rees MJ, Loeb A. 1997. Ap. J. 476:458–63; Erratum. 1997. Ap. J. 484:985
- 82. Haiman Z, Thoul AA, Loeb A. 1996. Ap. J. 464:523–38
- 83. Hauser MG, Dwek E. 2001. Annu. Rev. Astron. Astrophys. 39:249–307
- 84. Heger A, Fryer CL, Woosley SE, Langer N, Hartmann DH. 2003. Ap. J. 591:288–300
- 85. Heger A, Woosley SE. 2002. Ap. J. 567:532–43
- 86. Hernandez X, Ferrara A. 2001. MNRAS 324:484–90
- 87. Hirashita H, Ferrara A. 2002. MNRAS 337:921–37
- 88. Holder GP, Haiman Z, Kaplinghat M, Knox L. 2003. Ap. J. 595:13–8
- 89. Hollenbach D, McKee CF. 1979. Ap. J. Suppl. 41:555–92
- 90. Hollenbach D, McKee CF. 1989. Ap. J. 342:306–36
- 91. Hui L, Haiman Z. 2003. Ap. J. 596:9–18
- 92. Hutchings RM, Santoro F, Thomas PA, Couchman HMP. 2002. MNRAS 330:927–36
- 93. Hutchins JB. 1976. Ap. J. 205:103–21
- 94. Iliev IT, Shapiro PR, Ferrara A, Martel H. 2002. Ap. J. 572:L123–6
- 95. Iliev IT, Scannapieco E, Martel H, Shapiro PR. 2003. MNRAS 341:81–90
- 96. Islam RR, Taylor JE, Silk J. 2003. MNRAS 340:647–56
- 97. Jang-Condell H, Hernquist L. 2001. Ap. J. 548:68–78
- 98. Jeans JH. 1902. Phil. Trans. Roy. Soc. 199:1–53
- 99. Kaiser N. 1984. Ap. J. 284:L9–12
- 100. Kaplinghat M, Chu M, Haiman Z, Holder G, Knox L, Skordis C. 2003, Ap. J. 583:24–32
- 101. Kashlinsky A, Rees MJ. 1983, MNRAS 205:955–71
- 102. Katz N. 1991. Ap. J. 368:325–36
- 103. Kirshner RP. 2003. Science 300:1914–8
- 104. Kitayama T, Susa H, Umemura M, Ikeuchi S. 2001. MNRAS 326:1353–66
- 105. Kitsionas S, Whitworth AP. 2002. MNRAS 330:129–36
- 106. Kogut A, Spergel DN, Barnes C, Bennett CL, Halpern M, et al. 2003. Ap. J. Suppl. 148:161–73
- 107. Kroupa P. 2002. Science 295:82–91
- 108. Kulsrud RM, Cen R, Ostriker JP, Ryu D. 1997. Ap. J. 480:481–91
- 109. Lamb DQ, Reichart DE. 2000. Ap. J. 536:1–18
- 110. Larson RB. 1969. MNRAS 145:271–95
- 111. Larson RB. 1974. MNRAS 169:229–45
- 112. Larson RB. 1998. MNRAS 301:569–81
- 113. Larson RB. 2002. MNRAS 332:155–64
- 114. Larson RB. 2003. Rep. Prog. Phys. 66:1651–97
- 115. Lepp S, Shull JM. 1984. Ap. J. 280:465–9
- 116. Loeb A, Barkana R. 2001. Annu. Rev. Astron. Astrophys. 39:19–66
- 117. Loeb A, Haiman Z. 1997. Ap. J. 490:571–6
- 118. Loeb A, Rasio FA. 1994. Ap. J. 432:52–61
- 119. Low C, Lynden-Bell D. 1976. MNRAS 176:367–90
- 120. Machacek ME, Bryan G, Abel T. 2001. Ap. J. 548:509–21
- 121. Machacek ME, Bryan G, Abel T. 2003. MNRAS 338:273–86
- 122. Mackey J, Bromm V, Hernquist L. 2003. Ap. J. 586:1–11
- 123. Mac Low MM, Shull JM. 1986. Ap. J. 302:585–9
- 124. Madau P, Ferrara A, Rees MJ. 2001. Ap. J. 555:92–105
- 125. Madau P, Meiksin A, Rees MJ. 1997. Ap. J. 475:429–44
- 126. Madau P, Rees MJ. 2001. Ap. J. 551:L27–30
- 127. Madau P, Rees MJ, Volonteri M, Haardt F, Oh SP. 2003. Ap. J. Submitted (astro-ph/0310223)
- 128. Magliocchetti M, Salvaterra R, Ferrara A. 2003. MNRAS 342:L25–9
- 129. Matsuda T, Sato H, Takeda H. 1969. Prog. Theor. Phys. 42:219–33
- 130. McDowell MRC. 1961. Observatory 81:240–3
- 131. Mészáros P, Rees MJ. 2003. Ap. J. 591:L91–4
- 132. Miralda-Escudé J. 1998. Ap. J. 501:15–22
- 133. Miralda-Escudé J. 2003. Science 300:1904–9
- 134. Monaghan JJ. 1992. Annu. Rev. Astron. Astrophys. 30:543–74
- 135. Moore B, Ghigna S, Governato F, Lake G, Quinn T, et al. 1999. Ap. J. 524:L19–22
- 136. Mori M, Ferrara A, Madau P. 2002. Ap. J. 571:40–55
- 137. Motte F, André P, Neri R. 1998. Astron. Astrophys. 336:150–72
- 138. Nakamura F, Umemura M. 1999. Ap. J. 515:239–48
- 139. Nakamura F, Umemura M. 2001. Ap. J. 548:19–32
- 140. Nakamura F, Umemura M. 2002. Ap. J. 569:549–57
- 141. Nishi R, Tashiro M. 2000. Ap. J. 537:50–4
- 142. Nozawa T, Kozasa T, Umeda H, Maeda K, Nomoto K. 2003. Ap. J. In press (astro-ph/0307108)
- 143. Ober WW, El Eid MF, Fricke KJ. 1983. Astron. Astrophys. 119:61–8
- 144. Oey MS. 2003. MNRAS 339:849–60
- 145. Oh SP. 2001. Ap. J. 553:499–512
- 146. Oh SP. 2002. MNRAS 336:1021–9
- 147. Oh SP, Cooray A, Kamionkowski M. 2003. MNRAS 342:L20–4
- 148. Oh SP, Haiman Z. 2002. Ap. J. 569:558–72
- 149. Oh SP, Haiman Z. 2003. MNRAS Submitted (astro-ph/0307135)
- 150. Oh SP, Nollett KM, Madau P, Wasserburg GJ. 2001. Ap. J. 562:L1–4
- 151. Omukai K. 2000. Ap. J. 534:809–24
- 152. Omukai K. 2001. Ap. J. 546:635–51
- 153. Omukai K, Inutsuka S. 2002. MNRAS 332:59–64
- 154. Omukai K, Nishi R. 1998. Ap. J. 508:141–50
- 155. Omukai K, Nishi R. 1999. Ap. J. 518:64–8
- 156. Omukai K, Palla F. 2001. Ap. J. 561:L55–8
- 157. Omukai K, Palla F. 2003. Ap. J. 589:677–87
- 158. Omukai K, Yoshii Y. 2003. Ap. J. In press (astro-ph/0308514)
- 159. Ostriker JP, Gnedin NY. 1996. Ap. J. 472:L63–7
- 160. Ostriker JP, McKee CF. 1988. Rev. Mod. Phys. 60:1–68
- 161. Ostriker JP, Steinhardt P. 2003. Science 300:1909–13
- 162. Padoan P, Nordlund A. 2002. Ap. J. 576:870–9
- 163. Palla F, Salpeter EE, Stahler SW. 1983. Ap. J. 271:632–41
- 164. Peebles PJE, Dicke RH. 1968. Ap. J. 154:891–908
- 165. Peiris HV, Komatsu E, Verde L, Spergel DN, Bennett CL, et al. 2003. Ap. J. Suppl. 148:213–31
- 166. Pudritz RE. 2002. Science 295:68–76
- 167. Puy D, Signore M. 1996. Astron. Astrophys. 305:371–8
- 168. Puy D, Signore M. 1999. New Astron. Rev. 43:223–41
- 169. Qian Y-Z, Sargent WLW, Wasserburg GJ. 2002. Ap. J. 569:L61–4
- 170. Qian Y-Z, Wasserburg GJ. 2002. Ap. J. 567:515–31
- 171. Rees MJ. 1976. MNRAS 176:483–6
- 172. Rees MJ. 1993. Quart. J. Roy. Astron. Soc. 34:279–89
- 173. Rees MJ, Ostriker JP. 1977. MNRAS 179:541–59
- 174. Ricotti M, Gnedin NY, Shull JM. 2001. Ap. J. 560:580–91
- 175. Ricotti M, Gnedin NY, Shull JM. 2002a. Ap. J. 575:33–48
- 176. Ricotti M, Gnedin NY, Shull JM. 2002b. Ap. J. 575:49–67
- 177. Ripamonti E, Haardt F, Ferrara A, Colpi M. 2002. MNRAS 334:401–18
- 178. Salvaterra R, Ferrara A. 2003. MNRAS 339:973–82
- 179. Salvaterra R, Ferrara A, Schneider R. 2003. MNRAS Submitted (astro-ph/0304074)
- 180. Santoro F, Thomas PA. 2003. MNRAS 340:1240–8
- 181. Santos MR, Bromm V, Kamionkowski M. 2002. MNRAS 336:1082–92
- 182. Sargent WLW. 1986. In The Lesson of Quantum Theory, ed. J de Boer, E Dal, O Ulfbeck, pp. 263–82. Amsterdam: Elsevier
- 183. Saslaw WC, Zipoy D. 1967. Nature 216:976–8
- 184. Scannapieco E, Ferrara A., Madau P. 2002. Ap. J. 574:590–8
- 185. Scannapieco E, Schneider R, Ferrara A. 2003. Ap. J. 589:35–52
- 186. Schaerer D. 2002. Astron. Astrophys. 382:28–42
- 187. Schaerer D. 2003. Astron. Astrophys. 397:527–38
- 188. Schneider R, Ferrara A, Ciardi B, Ferrari V, Matarrese S. 2000. MNRAS 317:385–90
- 189. Schneider R, Ferrara A, Natarajan P, Omukai K. 2002a. Ap. J. 571:30–9
- 190. Schneider R, Ferrara A, Salvaterra R, Omukai K, Bromm V. 2003a. Nature 422:869–71
- 191. Schneider R, Ferrara A, Salvaterra R. 2003b. MNRAS Submitted (astro-ph/0307087)
- 192. Schneider R, Guetta D, Ferrara A. 2002b. MNRAS 334:173–81
- 193. Schwarzschild M, Spitzer L. 1953. Observatory 73:77–9
- 194. Seager S, Sasselov D, Scott D. 2000. Ap. J. Suppl. 128:407–30
- 195. Shapiro PR, Iliev IT, Raga AC. 2003. MNRAS Submitted (astro-ph/0307266)
- 196. Shapiro PR, Kang H. 1987. Ap. J. 318:32–65
- 197. Schaye J, Aguirre A, Kim T-S, Theuns T, Rauch M, Sargent WLW. 2003. Ap. J. 596:768–96
- 198. Silk J. 1977. Ap. J. 211:638–48
- 199. Silk J. 1983. MNRAS 205:705–18
- 200. Sneden CS, Cowan JJ. 2003. Science 299:70–5
- 201. Sokasian A, Abel T, Hernquist L, Springel V. 2003a. MNRAS 344:607–24
- 202. Sokasian A, Yoshida N, Abel T, Hernquist L, Springel V. 2003b. MNRAS Submitted (astro-ph/0307451)
- 203. Somerville RS, Bullock JS, Livio M. 2003. Ap. J. 593:616–21
- 204. Somerville RS, Livio M. 2003. Ap. J. 593:611–5
- 205. Songaila A. 2001. Ap. J. 561:L153–6; Erratum. 2002. Ap. J. 568:L139
- 206. Spergel DN, Verde L, Peiris HV, Komatsu E, Nolta MR, et al. 2003. Ap. J. Suppl. 148:175–94
- 207. Stahler SW, Palla F, Salpeter EE. 1986. Ap. J. 302:590–605
- 208. Stecher TP, Williams DA. 1967. Ap. J. 149:L29–30
- 209. Stiavelli M, Fall SM, Panagia N. 2003. Ap. J. In press (astro-ph/0309835)
- 210. Susa H, Umemura M. 2000. Ap. J. 537:578–88
- 211. Tan JC, Blackman EG. 2003. Ap. J. Submitted (astro-ph/0307455)
- 212. Tan JC, McKee CF. 2003. Ap. J. Submitted (astro-ph/0307414)
- 213. Tassis K, Abel T, Bryan G, Norman ML. 2003. Ap. J. 587:13–24
- 214. Tegmark M, Silk J, Rees MJ, Blanchard A, Abel T, Palla F. 1997. Ap. J. 474:1–12
- 215. Thacker RJ, Scannapieco E, Davis M. 2002. Ap. J. 581:836–43
- 216. Theuns T, Schaye J, Zaroubi S, Kim T-S, Tzanavaris P, Carswell B. 2002. Ap. J. 567:L103–6
- 217. Todini P, Ferrara A. 2001. MNRAS 325:726–36
- 218. Tozzi P, Madau P, Meiksin A, Rees MJ. 2000. Ap. J. 528:597–606
- 219. Tumlinson J, Shull JM. 2000. Ap. J. 528:L65–8
- 220. Tumlinson J, Shull JM, Venkatesan A. 2003. Ap. J. 584:608–20
- 221. Uehara H, Inutsuka S. 2000. Ap. J. 531:L91–4
- 222. Uehara H, Susa H, Nishi R, Yamada M., Nakamura T. 1996. Ap. J. 473:L95–8
- 223. Umeda H, Nomoto K. 2002. Ap. J. 565:385–404
- 224. Umeda H, Nomoto K. 2003. Nature 422:871–3
- 225. Umemura M, Loeb A, Turner EL. 1993. Ap. J. 419:459–68
- 226. Venkatesan A, Giroux ML, Shull JM. 2001. Ap. J. 563:1–8
- 227. Venkatesan A., Truran JW. 2003. Ap. J. 594:L1–4
- 228. Venkatesan A., Tumlinson J, Shull JM. 2003. Ap. J. 584:621–32
- 229. Volonteri M, Haardt F, Madau P. 2003. Ap. J. 582:559–73
- 230. Wada K, Venkatesan A. 2003. Ap. J. 591:38–42
- 231. Ward-Thompson D. 2002. Science 295:76–81
- 232. Whalen D, Abel T, Norman ML. 2003. Ap. J. Submitted (astro-ph/0310283)
- 233. Wijers RAMJ, Bloom JS, Bagla JS, Natarajan P. 1998. MNRAS 294:L13–7
- 234. Wolfire MG, Cassinelli JP. 1987. Ap. J. 319:850–67
- 235. Wood K, Loeb A. 2000. Ap. J. 545:86–99
- 236. Wyithe JSB, Loeb A. 2003a. Ap. J. 586:693–708
- 237. Wyithe JSB, Loeb A. 2003b. Ap. J. 588:L69–72
- 238. Yoneyama T. 1972. Publ. Astron. Soc. Jpn. 24:87–98
- 239. Yoshida N, Abel T, Hernquist L, Sugiyama N. 2003a. Ap. J. 592:645–63
- 240. Yoshida N, Bromm V, Hernquist L. 2004. Ap. J. Submitted (astro-ph/0310443)
- 241. Yoshida N, Sokasian A, Hernquist L, Springel V. 2003b. Ap. J. 591:L1–4
- 242. Yoshida N, Sokasian A, Hernquist L, Springel V. 2003c. Ap. J. In press (astro-ph/0305517)
- 243. Yoshida N, Sugiyama N, Hernquist L. 2003d. MNRAS 344:481–91
- 244. Yoshii Y, Sabano Y. 1979. Publ. Astron. Soc. Jpn. 31:505–21
- 245. Yoshii Y, Saio H. 1986. Ap. J. 301:587–600