The rotation curves of dwarf galaxies: a problem for Cold Dark Matter?
Abstract
We address the issue of accuracy in recovering density profiles from observations of rotation curves of galaxies. We “observe” and analyze our models in much the same way as observers do the real galaxies. Our models include stellar disks, disks with bars, and small bulges. We find that the tilted ring model analysis produces an underestimate of the central rotational velocity. In some cases the galaxy halo density profile seems to have a flat core, while in reality it does not. We identify three effects, which explain the systematic biases: (1) inclination (2), small bulge, and (3) bar. Inclination effects are due to finite thickness of disk, bar, or bulge. Admixture of a non-rotating bulge component reduces the rotation velocity. A small (200-500 pc) bulge may be overlooked leading to systematic bias even on relatively large distances. In the case of a disk with a bar, the underestimate of the circular velocity is larger due to a combination of non-circular motions and random velocities. The effect of the bar depends on the angle that the bar makes with the line of sight. Signatures of bars can be difficult to detect in the surface brightness profiles of the model galaxies. The variation of inclination angle and isophote position angle with radius are more reliable indicators of bar presence than the surface brightness profiles. The systematic biases in the central of galaxies are not large. Each effect separately gives typically a few km/serror, but the effects add up. In some cases the error in circular velocity was a factor of two, but typically we get about 20 percent effect. The result is the false inference that the density profile of the halo flattens in the central parts. Our observations of real galaxies show that for a large fraction of galaxies the velocity of gas rotation (as measured by emission lines) is very close to the rotation of stellar component (as measured by absorption lines). This implies that the systematic effects discussed in this paper are also applicable both for the stars and emission-line gas.
1 Introduction
The cosmological cold dark matter (CDM) model and its present variant with cosmological constant (CDM) have been very successful in accounting for the properties of galaxies and their distribution in space. A current problem for CDM lies in observations of dwarf and low surface brightness galaxies. The rotation curves and derived density profiles of these galaxies appear to be in conflict with the CDM model (Moore, 1994; Flores & Primack, 1994; Burkert, 1995; Hernández & Gilmore, 1998). The problem arises because numerical simulations of the formation of halos in the CDM model reveal steeply cusped density profiles while observations favor shallow (core) profiles. The theory predicts that the mass density in the inner parts of the dark matter halos is best described as an , power law (Navarro, Frenk, & White, 1997; Power et al., 2003; Colin, Klypin, Valenzuela, Gottloeber, 2004) or possibly by a power-law with a slightly steeper slope (Moore et al., 1999; Ghigna et al., 2000; Klypin, Kravtsov, Bullock, & Primack, 2001; Reed et al., 1999; Tasitsiomi, Kravtsov, Gottloeber, & Klypin, 2004). The observed rotation curves of a significant fraction of dwarf galaxies, however, suggest that their cores do not have steep density cusps (de Blok & McGaugh, 1997; Blais-Ouellette, Amram & Carignan, 2001; de Blok, McGaugh, Bosma, & Rubin, 2001; McGaugh, Rubin, & de Blok, 2001; Bolatto, Simon, Leroy, & Blitz, 2002; Weldrake, de Blok & Walter, 2002; Simon, Bolatto, Leroy, & Blitz, 2002). Note that this is not true for some galaxies and that some observational results are still consistent with cosmological predictions (van den Bosch et al., 1999; Swaters, Madore, & Trewhella, 2000; van den Bosch & Swaters, 2001). McGaugh, Rubin, & de Blok (2001) have analyzed H observations of 50 low surface brightness galaxies of which 36 are of sufficient quality that rotation curves can be derived. The spatial resolution is improved by an order of magnitude over old 21 cm data. In a companion paper de Blok, McGaugh, Bosma, & Rubin (2001) conclude that at small (0.5-1 kpc) radii, the mass density distribution is dominated by a nearly constant density core. The distribution of inner slopes is strongly peaked around with clear contradiction with the CDM predictions. Thus, there appears a controversy concerning the density distribution of matter in the inner parts of dwarf galaxies.
We propose a somewhat different approach to this problem which we believe can help to clarify these debates. We construct realistic models of galaxies and “observe” them as real galaxies using the same techniques or algorithms that observers apply to real data. We study the details of the analysis of observations and we find discrepancies between recovered and true properties of the simulated galaxies. We investigate projection effects and the effects of bars and bulges on the observed rotation curves. We show that these effects are often far from negligible.
Some of the effects which we study, have already been discussed. Athanassoula (1984) discussed the biases in the observed rotation curves of high surface brightness galaxies created by strong bars. More recently, Koda & Wada (2002) have investigated the effects of a weak bar on mass determination in the central parts of spiral galaxies. They examine rotation curves of edge-on model galaxies observed from different viewing angles. The models had a two-dimensional solid rotating barred potential. Motion of gas in this potential was followed using an SPH code. Koda & Wada (2002) find that the mass estimated from rotation curves is larger than the true mass by a factor of 5 for 15% of the viewing angles. Overestimation in mass occurs more frequently than underestimation. Koda & Wada (2002) focus on rotation curves defined as the highest velocity envelope of position-velocity diagrams. When the rotation curve is defined as the intensity weighted mean of position-velocity diagrams, the rotation velocity is underestimated for most of the view angles. Koda & Wada (2002) conclusions are only for edge-on galaxies; the situation with less inclined galaxies could be more complex. Another important aspect studied by Wada, Meurer & Norman (2002) and Wada & Koda (2001) is the gravity driven turbulence induced by a weak bar in a clumpy and filamentary gaseous media. If was found that the velocity dispersion of a cold neutral gas as well as of an ionized component is significantly lager than naively expected if the distribution is clumpy (Wada, Meurer & Norman, 2002) or filamentary (Wada & Koda, 2001). These results challenge the common expectation that the gas component in a galaxy is a cold medium with low velocity dispersion.
The effect of bulges on the observed kinematics of galaxies has its own history (e.g., Fillmore, Boroson, & Dressler, 1986; Kormendy & Westpfahl, 1989; Bertola et al., 1995; Vega Beltrán et al., 2001; Funes et al., 2002; Pizzella, Corsini, Vega-Beltran & Bertola, 2004). An interesting issue here is the difference between the rotation of stars and rotation of gas in the central 1-2 kpc region. Because our simulations have only the stellar component (no gas), it is important to know how different are rotation of gas and of stars. Naively, one expects that gas as a “colder” component should rotate faster. The reality is more complicated. A detailed discussion of this issue is given in §2. We also use our own observations to measure rotation velocities in stellar and gas components. To summarize, like other workers in this field, we find that often in the central region the rotation of gas (as measured by and emission) is not very different from the rotation of the stellar component.
Some other systematic effects were considered by Swaters, Madore, van den Bosch, & Balcells (2003) who discuss effects of seeing, finite slit width, and slit misalignment for ideal thin exponential disks. It is found that all effects systematically underestimate the central slope. The magnitude of the bias depends on the distance to the galaxy and on slit misalignment. de Blok, Bosma, & McGaugh (2003) considered the effects of an offset between optical and kinematical centers, as well as a very simplistic attempt to quantify the effects of non-circular motions. Both effects tend to lower the estimated density profile slope. Hayashi et al. (2003) discuss effects of triaxial halos on the rotation of gas in CDM simulations, which lead to non-circular motions.
This paper is organized as follows. In §2 we present results of our observations of rotation velocities as measured by gas and stars. In §3 we discuss different observations, focusing on systematic biases, which may affect rotation curves. We also present results of our observations of rotation of gas and stars. In §4 we present and describe our models. Simulations are discussed in §5. We have constructed four detailed galaxy models and run them as N-body simulations. In §6 we present our methods of analysis of the models and in §7 we show our results. In §8 we present our conclusions.
2 Observational measurements of rotation curves: gas vs stars
Most observational results which address the issue of cusps and cores, provide rotation for gas as measured by either emission or by 21 cm line. The rotation of the stellar component is not studied because it is difficult to measure for dwarf and LSB galaxies. Nevertheless, there are observational results for stellar rotation curves for a substantial number of galaxies (e.g., Fillmore, Boroson, & Dressler, 1986; Kormendy & Westpfahl, 1989; Bertola et al., 1995; Vega Beltrán et al., 2001; Funes et al., 2002; Pizzella, Corsini, Vega-Beltran & Bertola, 2004). The observed set of galaxies cover a wide range of morphological types (from S0’s to Sc’s) and magnitudes. Most of the galaxies are normal high surface brightness galaxies, but some are similar to dwarfs studied for the “cusps and cores” problem.
Let’s start with what one naively should expect. Close to the center stars are expected to have relatively large random (non-circular) velocities. For example, if the stars are in a disk with a constant height, the velocities perpendicular to the plane of the disk should increase exponentially as one gets close to the center in order to react to the exponentially increasing disk density. Other random velocity components are coupled with the vertical velocities with the radial rms velocity being typically twice larger than the vertical velocity. Non-circular stellar velocities may be even larger if there is a bulge. Large non-circular velocities result in significant asymmetric drift. In turn, this would imply that rotational stellar velocity falls significantly below the circular velocity. In the case of gas, one naively expects that rotation is faster because gas cools and settles in the plane of the disk.
The problem with this picture, which is shared by many astronomers, is that it is too naive. It has some justification in the outer parts of disk galaxies. Indeed, in our own galaxy at the solar neighborhood molecular gas has a smaller height than stars. Thus, gas has smaller non-circular velocities and must rotate faster. Young stars, which have formed relatively recently from the gas, have smaller asymmetric drift than the older stars. This picture of a cold thin gaseous disk inside a thicker slower rotating disk or a bulge is naively applied to the central parts galaxies. Unfortunately, close to the galactic center the naive picture has little justification. For example, the disk cannot be considered as thin because at distances 0.3-0.5 kpc from the center the disk thickness is comparable with the distance to the center. Gas motions also increase substantially (Vega Beltrán et al., 2001; Funes et al., 2002; Pizzella, Corsini, Vega-Beltran & Bertola, 2004)
Rotation curves of ionized gas (H) as well as rotation and velocity dispersion curves for the stellar component (absorption lines) were studied by Fillmore, Boroson, & Dressler (1986). It was found that for some galaxies the stellar component rotates faster than the ionized gas in the central region. For other galaxies the rotation of both components is comparable. In particular, for the Sab galaxy NGC 4569, it was found that at 300 pc the ionized gas rotates with a speed of 50 km/s, while the rotation detected in the stellar component is 100 km/s and the stellar velocity dispersion is 150 km/s. The situation is similar inside 500 pc. This led Fillmore, Boroson, & Dressler (1986) to suggest that gas rotation might not represent the true circular velocity. NGC 5879, an Sb galaxy, shows the same rotation speed for ionized gas and for the stellar component up to the distance of 1 kpc. However, in addition to the rotation velocity the stellar component has a random component. At 200 pc both stars and ionized gas have a rotation speed of 40 km/s, but the stellar component also shows a velocity dispersion of 70 km/s. Based on these observations as well as on their mass models, Fillmore, Boroson, & Dressler (1986) suggest that ionized gas in these galaxies is likely to be supported not only by rotation but also by pressure.
For NGC 4594 (M104) Kormendy & Westpfahl (1989) measured the rotation of ionized gas (HII regions) and inter-arm gas using H observations. The rotation of the stellar component was measured using absorption lines. It was found that in the central region ionized gas rotates with a 200 km/s, while the stellar component rotates faster: its rotation velocity is about 300 km/s. Kormendy & Westpfahl (1989) suggest that ionized gas in M104 has smaller rotation because it is either shed by the bulge stars or is somehow related with the x-ray halo. The situation for galaxies with small bulges is not clear. Gas in small (few hundred parsec) bulges with an effective radius comparable to the disk characteristic height is probably dense enough to harbor star formation. A coupling between young stars and ionized gas could produce non-circular motions in the gas kinematics and lead to an underestimation of the central mass content. Other possibilities are discussed and explored by Cinzano et al. (1999). Among these, is a model where gas is made of clouds. A similar situation was discussed also by Wada & Koda (2001) and Wada, Meurer & Norman (2002). The clumpy and filamentary structure of a gaseous component considerably increases the asymmetric drift too. Wada, Meurer & Norman (2002) discuss the case of NGC2915, a blue compact dwarf galaxy, that shows a bar and a large velocity dispersion in the H-I kinematics.
There are no strict rules as far as rotation of gas and stars in the central parts of galaxies are concerned. In some cases the gas rotates faster as naively expected (e.g., Sb galaxies NGC772 and NGC 7782 (Pignatelli et al., 2001)). In many cases, the rotation of gas and stars in the central 1-2 kpc is nearly the same (e.g., Sc NGC 5530 and Sb NGC 615 (Pizzella, Corsini, Vega-Beltran & Bertola, 2004)). Nevertheless, there is a general trend that late spirals with small bulges have gaseous and stellar components rotating with almost the same velocities (e.g., Cinzano et al., 1999; Vega Beltrán et al., 2001).
The observational data used in our paper are from a program aimed at understanding line strengths and line strength gradients in bulges. Long-slit spectra were obtained along the major axes of 37 spiral galaxies using the Double Imaging Spectrograph (DIS) on the ARC 3.5m telescope at Apache Point Observatory. The spectra cover a large wavelength range (4000 to 7500 Å or larger) at the cost of spectral resolution (6-8 Å per pixel). The galaxies span a wide range of inclination angles and Hubble types. Some of the inclinations are too low to measure rotation and the condition that H is present in emission eliminates several, mostly early-type, galaxies. From the sample galaxies with different morphological types and inclinations we selected all 8 galaxies, that had inclinations in the range 45-80 degrees and had in emission at the very center and through the most of galaxy. We did not specifically target late type galaxies, but, as one may expect, the condition that is in emission at the galactic center eliminates most early types.
Spectra extracted at different positions along the slit were cross-correlated with the spectrum at the galaxy center. For stellar rotation, the cross-correlation was performed within the wavelength range 4100 to 5400 Å after masking out emission features and sky lines. For 6 galaxies, rotation in the gas component was measured by cross correlating within the wavelength ranges 6550 to 6600 Å to include H and NII 6583. For the remaining two galaxies (NGC 6368 and IC 1029) we used SII doublet (6548-6583 Å ) because it provided higher signal-to-noise ratio than the . A detailed description of the observations and data analysis will be presented in an upcoming paper (Moorthy & Holtzman, in preparation). Table 1 gives properties of these galaxies.
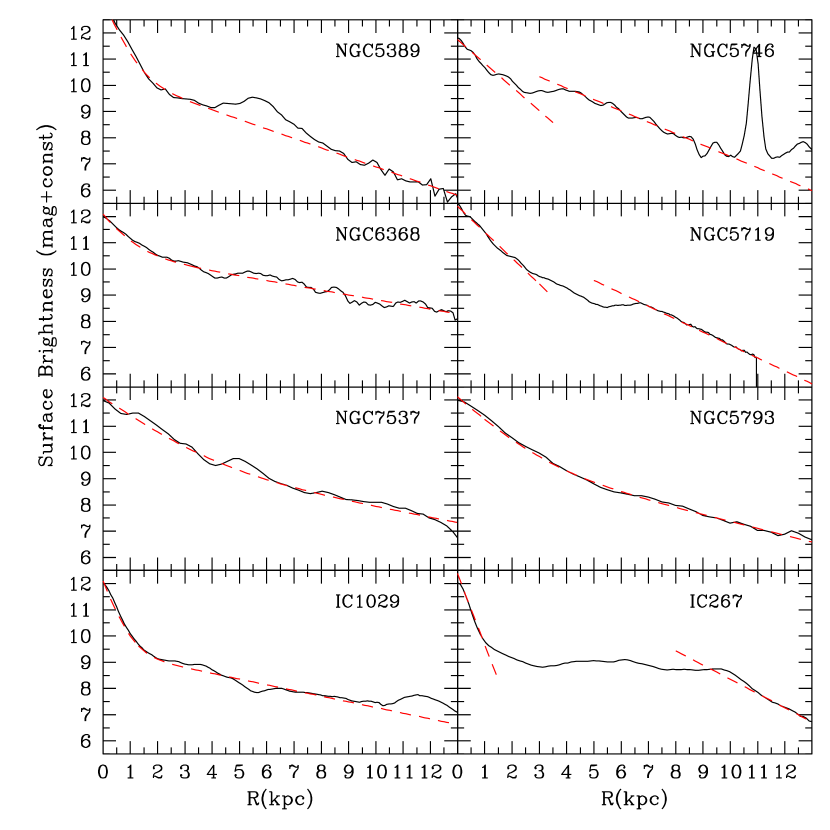
Rotation curves of the galaxies are shown in Figure 1. Surface brightness profiles along the spectrograph slit are shown in Figure 2. Both the velocities and the surface brightnesses are measured along the major axis of the galaxies. For barred galaxies they are long the bars. A large fraction (but not all) galaxies in our sample show stellar rotation close to that of the gas. All three barred galaxy in our sample, have complicated velocity patterns. In case of NGC5719 there is little stellar rotation along the bar. Yet, the bar in the galaxy is quite extreme: more than 10 kpc. This galaxy also presents a peculiar morphology with a single strong dust lane oriented in different direction with respect to the galaxy major axis. A large bulge dominates the central light distribution. Based on spectroscopic observations in visible, near and far infrared light as well as in radio wavelengths Hill, et al. (1999) and Hill et al. (2001) conclude that NGC5719 is a composite of an AGN and a starburst galaxy. This evidence combined with the large size of the bar and the existence of a companion NGC 5713, suggests that NGC5719 is suffering a strong interaction. Hunter et al. (2002) recently presented the case of NGC4449. This galaxy is also strongly barred and shows no rotation in the stellar component. Hunter et al. (2002) propose a model where the orientation of a gaseous younger disk and the stellar component are different as a result of an interaction. The model introduced by Hunter et al. (2002) supports our interpretation of NGC5719, however a detailed modeling of this peculiar galaxy is beyond the scope of this paper. The other barred galaxies in our sample show large and strong bars too.
We clearly find a tendency that stars in galaxies with smaller bulges rotate as fast as the gas. This is compatible with previous results (e.g., Cinzano et al., 1999; Vega Beltrán et al., 2001). There are important conclusions, which we get form these results. (1) Because the stars and the gas move in the same gravitational potential, observed rotation curves must experience the same systematic biases as the stellar rotation curves. (2) We can use stellar-dynamic simulations to study those effects. (3) The environment of a galaxy should be taken in account in the interpretation of the kinematics, specifically for the case of strongly interacting galaxies.
3 Observational measurements of rotation curves: systematic effects
For most galaxies corrections for finite disk thickness seems to be quite small. Indeed, at few kiloparsec distance from the galactic center corrections for disk height of few hundred parsec are not significant. As far as we know, no correction for finite disk thickness was ever made. Is this justified for central regions (0.5-1kpc) of dwarf galaxies? It is far from obvious. Observations of edge-on galaxies indicate that as the function of decreasing circular velocity the disk height decreases slower than the exponential disk scale length (Kregel, van der Kruit, & de Grijs, 2002; Dalcanton, 2003). In other words, dwarf galaxies are relatively thicker than giants. Using I-band photometry for 34 edge-on spiral galaxies Kregel, van der Kruit, & de Grijs (2002) give estimates of the exponential heights. For 6 galaxies with maximum circular velocity below their results give the average height of 440 pc. One of the thinnest galaxies is UGC 7321 (Matthews, 2000) with an exponential height of 150 pc, which is about what we use for our model IV “Disk”. Interestingly enough Matthews & Wood (2003) find that the neutral hydrogen has about the same height as the stellar component. If the galaxies, which are used to study rotation curves and the dark matter density have the same heights as those observed edge-on, it is clear that in the central sub-kiloparsec region, the disks cannot be treated as thin at all.
The effect of finite disk thickness increases with increasing galaxy inclination. As part of our study we have examined the data of McGaugh, Rubin, & de Blok (2001) and de Blok, McGaugh, Bosma, & Rubin (2001) to see if we can find evidence of observational effects involving inclination and galaxy morphology. McGaugh, Rubin, & de Blok (2001) list the inclinations for a sample of 50 galaxies which they observed in H. de Blok, McGaugh, Bosma, & Rubin (2001) list values for the inner power law slope () of for 48 galaxies. There is a partial overlap with the sample of de Blok, McGaugh, & Rubin (2001), other galaxies being culled from data published by de Blok, & Bosma (2002), Swaters, Madore, & Trewhella (2000) and Verheijen (1997). We have combined these data to produce a list of 43 galaxies. These data are shown in Figure 3. If the estimates of the inner density slope had no biases, there would be no dependence of with the inclination. This clearly is not so: the top left corner of the plot does not have points.
Also note that galaxies identified as barred galaxies tend to have larger values of than the average. All but one have . We do not have morphological information for all galaxies in the sample. The data in Figure 3 suggest that galaxies with high inclinations have large values. Galaxies with inclinations ° have values greater than -1. The evidence suggests that projection effects and the presence of bars influences must be taken into account when determining density distributions from rotation curves.
Recent observations of galaxies suggest that galactic bars occur more frequently than had been previously suspected. Eskridge et al. (2002) have presented BVRJHK imaging of a sample of 205 bright nearby spiral galaxies. An examination of Table I in their paper reveals that in the B-band 103 of the galaxies are classified as barred spirals whereas in the H band 140 or 70% of the sample are classified as barred spirals. The conclusions we draw concerning the effects of bars on the interpretation of spiral galaxy rotation curves may well be relevant to the majority of spiral galaxies.
Dwarf and LSB galaxies used for analysis of rotation curves and the dark matter content typically are selected to be “bulge-less”: types Sc-Sd. Yet, it appears that many of them still have small bulges. Böker, Stanek & van der Marel (2003) have obtained HST WFPC2 images of a sample of 19 nearby spiral galaxies of late Hubble type. For these galaxies bulges are not evident in the ground based optical data for these galaxies. The HST images were combined with the existing ground based optical images to obtain surface brightness profiles. The conventional wisdom has it that the sequence from early to late-type galaxies ranges from bulge dominated to disk dominated galaxies. The reality seems to be that only 30% of the galaxies in the sample are pure disk galaxies (Böker, Stanek & van der Marel, 2003). The remainder are well fitted by adding a bulge component. Some of these bulges are small, extending out to 300 pc. Larger bulges extend out to 2 kpc. As in the case of bars, the evidence suggests that the presence of bulges in spiral galaxies must be taken into account in the investigation of rotation curves of spiral galaxies. Galaz, Dalcanton, Infante, & Treister (2002) confirm these observations in a near infrared study of 88 low surface brightness galaxies and normal spirals. They note that many of the low surface brightness galaxies classified as late types based on optical B-band images show a dramatic bulge in the near-IR. The data support the conclusion of Beijersbergen, de Blok & van der Hulst (1999) that many low surface brightness galaxies could be regarded as high surface brightness bulges embedded in low surface brightness disks. Since the surface brightness in the near-IR closely reflects the stellar surface density it is important to take bulges into account when modeling the rotation curves of low surface brightness galaxies.
Note that the bulges are really small. A 300 pc bulge is hardly thicker than the disk. Physical conditions in such small bulges are not much different from those in the disk. Stars can form in those bulges.
The next important point to keep in mind is that of accuracy. How accurately can one determine the inclination of a galaxy? We refer to NCG 3109, a Magellanic type spiral that we have attempted to model in some detail (Valenzuela, Rhee & Klypin, 2004). Jobin & Carignan (1990) quote several values of inclination for this galaxy of based on B-band photometry. The same authors find a value of based on photometry of an I-band plate taken using the U.K. Schmidt telescope. In a more recent study, Blais-Ouellette, Amram & Carignan (2001) present CFHT Fabry-Perot H- observations of NCG 3109. These data show an inclination between and with one inner point at . Although the formal uncertainty in inclination in a given waveband may be as small as 2, a more realistic value is at least for the uncertainty in a galaxy’s inclination. Barnes & Sellwood (2003)) support this conclusion. Based on a study of 74 spiral galaxies they find that systematic uncertainties in position angle and inclination due to the presence of nonaxisymmetric structure are of order . These estimates are of course lower limits on the real errors. Weldrake, de Blok & Walter (2002) publish inclinations and position angles of the local group dwarf NGC 6822 as a function of radius based on radio data obtained with the Australia Telescope Compact Array. The values for the inclination angle of this galaxy as a function of radius fluctuate between and ! In their analysis, a constant value is adopted without further explanation. The position angle for this galaxy varies between and according to these data.
To summarize, there are three key points that have guided our analysis. Firstly, the central density profile obtained for a given galaxy appears to be influenced by the inclination of the galaxy, for inclinations greater than at least (it is difficult to determine the inclination of these dwarf galaxies to better than several degrees; ). Secondly, the data seem to indicate that galaxies with bars have densities that flatten in their centers when the standard analysis is performed. Errors of several degrees () can occur when determining inclinations. Thirdly, given increasing evidence for bulges in spiral galaxies of all morphological types, it is important to examine the biases that bulges (as well as bars) introduce into the determination of central density profiles.
4 Models
We use -body simulations to produce models of galaxies. The models include realistic dark matter and stellar component, but do not have gas. Gas would significantly complicate numerical models making predictions less certain. In dwarf galaxies gas is very patchy and often has significant non-circular motions (e.g., Bolatto, Simon, Leroy, & Blitz, 2002; Simon, Bolatto, Leroy, & Blitz, 2002). The stellar component has its own complications as we find below, but those are relatively simple and easy to interpret as compared with the gas motions. In dwarf galaxies, the gas has all the complications of stars and in addition it brings its own problems. Studying the stellar component is definitely a good starting point.
We study the kinematics and spatial distribution of stellar component in four models. Parameters of the models are given in Table 2. All the models are scaled to have a maximum circular velocity of approximately 60 km/s, which is the value for dwarf galaxies such as NGC3109 (Jobin & Carignan, 1990) and NGC6822 (Weldrake, de Blok & Walter, 2002). The virial masses for these models are in the range . In all cases the baryonic component represents a very small fraction (1%-2%) of the virial mass, which is a factor of ten smaller than the cosmological ratio of the baryons to the dark matter.
All models have extended () halos, which have high concentration NFW density profiles. We did not try to make more realistic fits for the dark matter halos. In reality the halos should be slightly perturbed in the central part because of the presence of baryons. We decided to neglect this effect in favor of simplicity of the models. Most of our models have very thin disks. Real disks are typically thicker than what we assume for our models. The only model, which has a realistic disk is the “Disk” model V.
The first two models (dubbed “Bar” and “Dwarf”) start with a pure stellar disk embedded in an extended dark matter halo. Initially the disks in the models are submaximal: about 50% of mass in central 1 kpc is in the disk the rest is in the dark matter. The disks are relatively cold (stability parameter Q is 1.2). As the result of this combination of parameters, the disks are unstable and produce bars. The main difference between the models is that the disk in the model “Bar” is significantly more massive than in the model “Dwarf”.
Models “Bulge”, “Thin Disk”, and “Disk” do not have bars. The models are stable - they do not evolve much. Nevertheless, we run the models for about 1.5-2 Gyrs to ensure detailed equilibrium. Indeed, small variations are found in the models. Initially the rotational velocity does not depend on the distance to the disk plane. After evolution we find that the rotational decreases with . This tendency increases effects of galaxy inclination. Models “Thin/Thick Disk” have relatively hot disks (). The disks are also more extended, which make them sub-dominant even in the center. The disks did not develop a bar.
Figure 4 presents details of the distribution of different quantities for models II and III. The models to some degree are similar and are representative for the other two models (I and IV). In models II and III the dark matter is dominant in the outer regions, but is sub-dominant in the central 500 pc. Velocity dispersions of baryonic components are very small. For example, for models II and III the rms velocities are smaller than even at radius.
5 The Numerical Simulations
The procedure of generating of initial conditions is described in detail in Valenzuela, & Klypin (2003). We use the following approximation for the density of the stellar disk in cylindrical coordinates:
| (1) |
where is the mass of the disk, is the exponential length, and is the scale height. The later was assumed to be constant through the disk. Effective exponential scale height (height at which the density decreases by times) is equal to . The disk is truncated at five exponential lengths and at three scale heights: , . Disk mass was slightly corrected to include the effects of truncation. The vertical velocity dispersion is related to the surface stellar density and the disk height :
| (2) |
where is the gravitational constant. The radial velocity dispersion is also assumed to be directly related to the surface density:
| (3) |
The normalization constant in eq. (3) is fixed in such a way that at any radius the rms radial random velocity is times the critical value needed to stabilize a differentially rotating disk against local perturbations. The tangential () component of the rotational velocity and its dispersion are found using the asymmetric drift and the epicyclic approximations. For the disk component we use the thin-disk approximation.
For model “Bulge” we also add a spherical non-rotating component with the Hernquist density profile:
| (4) |
where is the 1/4-mass radius. For the model , which gives half-mass radius 250 pc.
We assume that the dark matter density profile is described by the NFW profile (Navarro, Frenk, & White, 1997):
| (5) | |||||
| (6) | |||||
| (7) |
where and are the virial mass and the concentration of the halo. For given virial mass the virial radius of the halo is found assuming a flat cosmological model with matter density parameter and the Hubble constant .
Knowing the mass distribution of the system , we find the radial velocity dispersion of the dark matter:
| (8) |
The other two components of the velocity dispersion are equal to . In other words, the velocity distribution is isotropic, which is a good approximation for the central parts of the dark matter halos. At each radius we find the escape velocity and remove particles moving faster than the escape velocity. The dark matter halo is truncated at the virial radius,
Velocities are picked from an appropriate Gaussian distribution truncated at the escape velocity. The disks are realized with particles of an equal mass. The dark matter halo is composed of particles of variable mass with small particles placed in the central region and larger particles at larger distances. We double the particle mass as we move further and further from the center. The region covered by small mass particles is kpc – much larger than the size of the disk. In order to reduce the two-body scattering each dark matter particle in the central region has the same mass as a disk particle. This procedure is designed to reduce the number of particles and, at the same time, to allow us to cover a very large volume.
We use the Adaptive-Refinement-Tree (ART) -body code (Kravtsov et al., 1997; Kravtsov, 1999) to run the numerical simulations analyzed in this paper. The code starts with a uniform grid, which covers the whole computational box. This grid defines the lowest (zeroth) level of resolution of the simulation. The standard Particles-Mesh algorithm is used to compute the density and gravitational potential on the zeroth-level mesh with periodical boundary conditions. The code then reaches high force resolution by refining all high density regions using an automated refinement algorithm. The refinements are recursive. A refined region can also be refined. Each subsequent refinement level has half of the previous level’s cell size. This creates a hierarchy of refinement meshes of different resolution, size, and geometry covering regions of interest. Because each individual cubic cell can be refined, the shape of the refinement mesh can be arbitrary and effectively match the geometry of the region of interest. This algorithm is well suited for simulations of a selected region within a large computational box, as in the simulations presented below.
The criterion for refinement is the local density of particles. If the number of particles in a mesh cell (as estimated by the Cloud-In-Cell method) exceeds the level , the cell is split (“refined”) into 8 cells of the next refinement level. The refinement threshold depends on the refinement level. The threshold for cell refinement was low on the zeroth level: . Thus, every zeroth-level cell containing two or more particles was refined. The threshold was higher on deeper levels of refinement: and for the first level and higher levels, respectively.
During the integration, spatial refinement is accompanied by temporal refinement. Namely, each level of refinement is integrated with its own time step, which decreases by factor two with each refinement. This variable time stepping is very important for accuracy of the results. As the force resolution increases, more steps are needed to integrate the trajectories accurately.
6 Analysis
We have analyzed the N-body simulations using several methods or algorithms that mimic those used by the observers. Our data consist of velocities, positions and masses of the particles that constitute the disk of the model galaxy. The simulations are set up so that the plane of the disk is the plane. During our ’observations’ we ’look’ down the axis of the simulation. To observe our galaxy at various inclinations we simply rotate plane about the axis by varying angles.
The object of the exercise is to calculate rotation curves for our model galaxies as well as reconstruct the density profile. We have also constructed velocity field diagrams in the form of velocity contour plotted on the sky. One method frequently used by optical observers is long slit spectroscopy. In our case, we place a rectangular slit running parallel to and centered on the x-axis. We then select all particles whose coordinates place them within the slit boundaries. We define pixels along the slit and we assign particles falling in the slit to these pixels. We compute the line-of-sight velocity of each particle. We then compute the average velocity of the particles in each pixel. This average velocity, determined as a function of distance along the slit, is our “observed” rotation curve. By comparing this average rotation velocity with the true average velocity as well as the circular velocity, we can estimate the accuracy of the method.
In the case of HI observations in the radio and Fabry-Perot measurements in the optical, one has velocity information over the whole galaxy image not just along a narrow slit. In this case, observers determine the rotation curve using a tilted ring model of the velocity field. The method has been described by Begeman (1989). We reproduce the salient points below
6.1 The Tilted Ring Model
The model is based on the assumption that a rotating disk galaxy can be described by a set of concentric rings. Each ring has a constant circular velocity Vc and two orientation angles (the inclination angle, , and the position angle of the major axis, ). The values of the ring parameters are determined from the observed radial velocities in a set of concentric elliptic annuli in the plane of the sky. The ellipticity of the annuli, determined from isophotal analysis, fixes the inclination of each ring. is the systemic velocity of the galaxy (in our case 0 km/s). For a given ring, the observed radial velocities recorded on a set of sky coordinates are related to the basic parameters by:
| (9) |
In the expression above, is the azimuthal angle in the plane of the galaxy, related to the parameters and through:
| (10) | |||
| (11) |
where is the mean radius of the ring in the plane of the galaxy.
The first step in such a procedure is to determine the the position angle and ellipticity of the ‘isophotes’ of the model galaxy image. To do this we project all the particle positions on the sky plane. We then form an image in FITS format that we process using IRAF 111IRAF is written and supported by the IRAF programming group at the National Optical Astronomy Observatories (NOAO).. We use a package within IRAF called STSDAS 222This is the software for reducing and analyzing data from the Hubble Space Telescope. It is layered on top of IRAF and provides general purpose tools for astronomical data analysis as well as routines specifically designed for HST analysis.. Within STSDAS we use the ELLIPSE task which to fit a set of elliptical isophotes over the image. The method has been described by Jedrzejewski (1987).
Line-of-sight velocities measured at positions close to the minor axis carry less information about the underlying circular velocity than those measured at positions close to the major axis. We have excluded all values of the angle where is the angle with respect to the major axis in the plane of the galaxy. Weldrake, de Blok & Walter (2002) experimented with different weighting schemes, such as down weighting the minor axis by and . They also varied the exclusion by angle between 45°and 15°and found no difference in the curves produced for their analysis of the galaxy NGC 6822.
Once we know the values of , and we can compute for the each elliptical annulus and thus obtain , the rotation curve. As with the long slit method, we can compare with the known rotational velocities and true circular velocities for the model galaxy.
6.2 Density profiles
One can invert the observed rotation curve to determine the parent mass distribution (de Blok, McGaugh, Bosma, & Rubin, 2001) using the equation
| (12) |
This procedure assumes that the galaxy is spherically symmetric, completely dark matter dominated and that the gas moves in circular orbits in a planar disk. It is worth checking the reliability of the method using a realistic model of a galaxy.
7 Results
7.1 Long Slit Observations
7.1.1 Models IV and V (no bar, no bulge)
We observe the models IV and V in a manner designed to mimic long slit observations. In the following discussion we take circular velocity to mean the velocity at which a particle would move if it was moving in uniform circular motion around the center of the galaxy. The term rotational velocity refers to the speed at which a particle actually is rotating about the center of the galaxy; the total velocity of the particle can of course be larger than this. The term ”observed velocity” refers to the mean observed velocity at a given radius from the center. As we shall show, this latter number can have a value that is considerably smaller than the rotational velocity which in turn can be considerably smaller than the circular velocity.
Figure 5 compares the rotation curve obtained in this manner with true rotation velocities in the disk which we can measure directly. We also determine the total circular velocity that would be measured if there were no random velocities in the disk (i.e. perfect circular motion in the galaxy potential). In order to mimic slit observations, we incline the model by some angle and find line-of-sight velocities for “stars” inside a long slit of 100 pc width.
A clear trend is that the discrepancy between the “observed” and true rotation curves increases with inclination of the galaxy. By the time one reaches an inclination angle of the discrepancy is km/s at a radius of 0.5 kpc. This is a 30% in the estimation of velocity in the central part of the galaxy.
Why does the long slit mode of observation lead to underestimates of the rotational velocities in the disk? Let us consider a simple example. For model IV we take a line of sight through the plane of the disk whose closest approach to the center of the galaxy is 0.7 kpc. We choose this number since it is within the central kiloparsec of dwarf galaxies that mismatch between theory and observation is greatest. Averaging the velocities of N-body particles along this line of sight is equivalent to measuring the rotation velocity at one pixel location of a long slit observation. The velocities are weighted by the density of material along the line of sight. Ironically, the smallest rotational velocity occurs for the points that are located closest to the center of the galaxy. Since we are averaging this velocity with velocities of points further from the center that thus have larger circular velocities, how can the average be lower? The point of course is that we measure radial velocities along the line of sight. For example, a particle located 5 kpc away from the center of our model rotates at 60 km/s. However, the projected velocity of this particle on a line of sight 0.7 kpc from the center of the model is only 9 km/s. The rotational velocity of the disk 0.7 kpc from the center is 30 km/s. The average velocity that we measure along this line of sight is 20.4 km/s or 70% of the true velocity. One might well expect this difference to be even larger given that we are including radial velocities as low as 9 km/s. The answer is that the integral is intensity weighted so that points near the center carry considerably more weight in the mean determination than those near the edge of the galaxy. For example, for the whole line of sight we get a mean velocity of 20.4 km/swhile we get 26 km/sif we include only the central kpc.
The discussion above refers to the model viewed edge-on. The effect of viewing the galaxy at a lower inclination is to include particles that are above and below the galactic plane in the integral. Figure 6 shows the radial velocity versus line of sight distance for particles viewed with an inclination angle of 75. The points in the plot on the left are selected at location along the slit of 0.6 to 0.8 kpc, those in the right hand plot are selected from 4. to 4.2 kpc. It is clear (as expected) that particles located above the plane of the galaxy have slower rotational velocities. The mean velocity measured as a function of distance along the line of sight matches the rotation curve computed for particles kpc above the disk at about kpc, which is where one would expect it to for an inclination angle of 75°. Note that particles further than 0.25 kpc from the plane of the galaxy are not substantially affecting the velocity measurement because the density out there is too low.
One might ask why, given these projection effects, the rotational velocity is only underestimated for lines of sight passing close to the center of the galaxy. Lines of sight that pass more than 2 kpc from the center the measured velocities are in good agreement with the true rotational velocities for our models. The right hand plot of Figure 6 illustrates this; we do a good job recovering the rotational velocity of the particles at large radii. When the distance of the line of sight from the center of the galaxy is comparable to the size of the disk, the projection effects are quite different to those discussed in the previous case. Firstly, the spread in radii of particles in the line of sight is smaller at for lines of sight at larger distances from the center. Secondly, the projection effects are less pronounced at larger radii. Particles going at a given rotational speed have higher measured radial velocities because of the inherent geometry. These points are illustrated in Figure 7.
7.1.2 Model I: The Barred Galaxy Model
We refer to Model I in Table I as the barred galaxy model. For the case of this model, the situation is much more complex. We have examined 3 cases which span the range of possible geometries. One with the bar at 45 degrees to the line of sight (referred to as bar45), one case with the bar aligned along the line of sight (bar0) and thirdly a case where the bar is aligned perpendicular to the line of sight (bar90). In each case we use the same galaxy model; we just change the viewing angle. For each of these three cases we choose different inclination angles.
In the bar45 geometry viewed at an inclination of we recover the true rotation curve with an accuracy 2 km/s. In the case of a bar aligned with the line of sight (bar0) one gets larger rotational velocities measured in the central kpc region of the galaxy than are truly present. This is due to motions within the bar that are not rotational but contribute to the perceived rotational velocity. Such a bar viewed lengthwise would not be classified as a bar but most likely as bulge and likely will be discarded. The velocity differences observed in this situation can be large; . The third case when the bar is perpendicular to the line of sight and clearly visible as a bar, results in observed rotational velocities that are smaller than the true rotational velocities in the disk. The mismatch between the long slit result and the rotational velocities for a galaxy viewed at an inclination angle of is of about 25% at a 1 kpc radius. Inclination angle determinations are subject to rather large uncertainties as we mentioned above. If an inclination angle of 65 had been determined this galaxy the mismatch between the true and observed velocities would be increased by several km/s. As we showed in Figure 3 it is galaxies with bars that tend to have the lower rotational velocities in their centers.
The conclusion from the long slit analysis is that it is possible to underestimate the rotational motions in the central parts of dwarf galaxies by as much as 10 km/s using long slit data. This is a 30% error in the rotational velocity. The error is simply due to the way the line of sight samples the velocities in a rotating disk of finite thickness. Adding a bar into the picture can enhance or decrease this effect depending on the orientation of the bar relative to the observer. When the bar lies in the plane of the sky the differences are increased. Bars are not always easy to detect. However the inclination angle and position angle measured as a function of radius can give indications as to the presence of a bar.
7.2 The Tilted Ring Model: Results
7.2.1 Model IV (no bar, no bulge)
At low inclinations we find that a small error in the inclination measurement can affect the velocity results substantially. For example, we viewed model IV with at an inclination of 10° but the ellipse fitting software estimated an inclination 14° resulting in underestimates of the rotational velocity of 10-15 km/s about 40%. At inclinations of the measured velocities accurately match the rotational velocities over the measured range of 0.2 to 4 kpc. At an inclination of 75°we find that underestimates of the velocity of km/s occur at radii of less than 0.4 kpc, a 20% error in velocity. At an inclination of 80° the velocity underestimates occur at radii smaller than 0.7 kpc. At 0.2 kpc the mismatch is about 8km/s, a 25% error in the velocity estimate. These results are shown in figure 8.
7.2.2 Model I:Effect of a bar on the tilted ring results
The tilted ring analysis described above is the one adopted to calculate rotation curves using well resolved high signal to noise data. The method is applied to datasets where velocity information is available over the whole image plane, not just along a narrow slit. In practice observers have assumed a fixed or slowly varying position angle and inclination as a function of radius when implementing this method (Weldrake, de Blok & Walter, 2002).
To see the effect of the bar on rotation velocity, we selected disk particles in a ring from 1 kpc to 1.1 kpc and examined their rotation velocity as a function of azimuthal angle. The signature of the bar is clear. Particles located close to the position angle of the bar have significantly smaller rotational velocities on average. The bar is located two quadrants of the galaxy. We compute the average velocity of all the particles in the ring and obtained a value of 38.6km/s. When we exclude the quadrants containing the bar we obtain a value of 43.5 km/s. We have plotted the mean rotation velocities of particles in the disk, computed by excluding particles in the bar, this is the dotted line shown in Figure 9. We also show as a dashed line the circular velocity in Figure 9. The point is that there are a number of significant mismatches in the center of the galaxy. The tilted ring method does not recover the average rotational velocities in the disk. Even if it did, this would not be sufficient, since the average is lowered by the presence of a bar. Even if one has a good measure of the rotational velocities in the disk, one needs an accurate method of calculating asymmetric drift to recover the circular velocity. The bottom line is that large mismatches occur between the observed and true velocities in the central part of the disk when a bar is present. At 1 kpc from the center of the galaxy the observed velocity is 30% less than the true velocity. At 0.5 kpc from the center of the galaxy the observed velocity is 50% of the true velocity.
It does not take a very large error in velocity to produce a significant error in the power law slope of . Let us suppose we compute at 1 kpc and 2 kpc from the center of the galaxy and that we get the correct answer at 2 kpc but underestimate the rotation velocity and 1 kpc. Let us say we think the velocity is 31km/s when the true velocity is 35km/s. The percentage error is . The rotational velocity enters as the square in the mass measurement so the resulting error in the density is such that a power law index -1 is measured to be -0.65.
7.2.3 Model I: Recognizing a Bar
CCD imaging studies reveal that 70% of spiral galaxies are barred (Eskridge et al., 2002). To avoid complications, galaxies should be selected for rotation curve studies from the remaining 30%. However, our models suggest that bars may well be present in galaxies where imaging does not reveal their presence. We have demonstrated that bars in galactic disks give rise to errors when inferring galaxy masses from rotation curves. One might argue that barred galaxies are easily recognizable and hence can be easily excluded from galaxy samples. This is not the case. We show in figures 10 and 11 contour plots of the surface density of particles for the barred galaxy model viewed at an inclination of 75°. The surface density is measured as magnitudes and the contours are equally spaced in magnitude to mimic observational plots. It is certainly difficult to see the presence of a bar from density contours alone. Bars do cause variations in the inclination angle and position angles measured as a function of radius but warps and bulges can produce similar effects. We also show next to the contour plots, the “luminosity profiles” of our model disks. These plots also reveal the presence of the bar in an indirect way.
It is striking to what extent the signature of the bar can vary in the surface density profile depending on the viewing angle. The bar can have the appearance of a bulge, or produce a sudden decrease in surface brightness, or have no marked effect.
7.2.4 Model II:Evolution of a bar
We use model II to study effects of bar evolution on rotation curves. We have examined outputs of the simulation at three stages of the bar formation. The first snapshot was made 1.4 Gyr after the start of the simulation when the bar is still weak. The second snapshot was made 1.62 Gyr after the start of the simulation at which point the bar is strong. The final snapshot was taken 2.15 Gyr after the start of the simulation when the bar has buckled. Buckling refers to the bending of the bar into a peanut shape forming a thickened double lobed structure (Combes & Sanders, 1981). The rotation curve results are shown in Figure 12. As expected there is a large increase in mismatch between the circular and observed velocities as the strength of the bar increases. After the bar has buckled, the observed velocity is less than 50% of the circular velocity 0.5 kpc from the center of the galaxy. Figure 13 shows the inclination based on the isophote analysis. One can clearly see the effect of the bar extending to larger radii as the simulation evolves. Since we are viewing the bar perpendicular to the line of sight there are no isophote twists although these would be present if one viewed the bar at some angle either than perpendicular or parallel to the line of sight.
7.2.5 Model III: Effect of a bulge on the tilted ring results
Infrared studies of spiral galaxies and low surface brightness galaxies (Böker, Stanek & van der Marel, 2003; Galaz, Dalcanton, Infante, & Treister, 2002; Beijersbergen, de Blok & van der Hulst, 1999) show that the majority of these systems contain bulges. We have run a simulation to explore what effect the presence of a bulge has on the tilted ring results. Model III “Bulge” is designed to mimic the bulges detected by Böker, Stanek & van der Marel (2003): it has a very small bulge with half mass radius is 250 pc. Figure 14 shows the results of the tilted ring analysis for model III. It is clear that bulges as well as bars can result in low rotational measurements in the central regions of galaxies where the circular velocity is in fact high. The differences are of order 10-20km/s in the central 0.5 kpc. The velocity error ranges from 20% at 1 kpc to 50% at 0.2 kpc. In the case of a barred model the greatest cause of the mismatch are the non-circular motions produced by the bar. Due to the presence of the bar, a large fraction of stars and gas parcels have velocities orthogonal to the line of sight. These velocities are undetected by the emission line observations. This effect strongly depends on the bar orientation and is maximum when the bar is perpendicular to the line of sight. The case of galaxies with small bulges is slightly different. A bulge is a system substantially supported by random motions. An observer performed an average along the line of sight taking into account all particles belonging to either the disk or the bulge. For disk particles the detected radial velocity is close to the projected circular velocity along the line of sight, a small correction should be applied because of the asymmetric drift. For bulge particles the detected radial velocity component is comparable to the velocity components orthogonal to the line of sight. Systematically bulge particles show smaller velocity along the line of sight compared with disk particles, for the same circular velocity. Therefore the avenge or the observed rotation velocity is artificially biased toward lower values.
When models are viewed at low inclinations, error in the inclinations can cause large systematic errors in the rotation velocity estimates. For example the tilted ring algorithm produces an inclination value of for the model viewed at an inclination of . The resulting error in results in a 25% error in velocity. A 25% error in velocity translates as a 50% error in the density in the outer parts of the galaxy.
The dynamical signatures of the bulge model extend to larger radii than its signature in the surface density profile plots. For an inclination of , the small bulge does not make a significant contribution to the surface density profile beyond 400pc, but rotation velocities are determined to be significantly lower due to its presence beyond 1.2 kpc. By comparison, the model with no bar and no bulge, model IV, when viewed at an inclination of shows good agreement between the rotation velocity and the observed velocity down to 200 pc.
7.2.6 Model V: Effect of disk thickness on the tilted ring results
The motivation for Model V “Disk” is to gauge the effect of disk thickness on the underestimation of rotational velocity in the central Kpc of the models. Figure 15 shows velocity and inclination for the disk model viewed at an inclination of . The mismatch between the “observed” velocity and the rotational velocity is 10 km/s at 0.4 Kpc and 6 km/s at 0.2 Kpc. The thin disk model IV analysis reveals a smaller mismatch of 3 km/s at 0.4 Kpc and 6 km/s at 0.2 Kpc. As expected the mismatch increases with disk thickness at the largest inclinations.
7.2.7 Surface Density Profiles
Using the Ellipse task in the package STSDAS we can produce surface density profiles for our models. This is the same package used by Böker, Stanek & van der Marel (2003) among others to produce surface density profiles of galaxies. We are thus processing our body “data” in as similar a manner as possible to the observers. The surface density profile for the barred galaxy model is show in the four panels of Figure 16. We are viewing the galaxy at an inclination of 75°and showing how the surface density profile is affected by varying the angle the that bar makes with the line of sight. The bottom right panel showing the profile that results in viewing the bar along the line of sight, illustrates the point that in this geometry a bar can be mistaken for a bulge. When the bar is viewed perpendicular to the line of sight we see a sudden dip in the surface brightness at about 2 kpc. This dip is not so prominent when the bar is only slightly rotated from the perpendicular (upper right panel). It is clear that a number of the features found in these surface brightness plots qualitatively resemble features found in the data presented by Böker, Stanek & van der Marel (2003).
Figure 17 shows the same analysis for model III (bulge model). By varying the inclination angle we vary the contribution of the disk to the surface brightness. The slope of the disk contribution also varies depending on the viewing angle. The bulge signature in the surface brightness plot does not extend beyond kpc whereas the rotation velocity is underestimated out to kpc.
Figure 18 shows the effect of viewing the model at constant inclination during its evolution. One can see the growth of the bar as a shift in the location of the point at which the profile slop changes. This point occurs at roughly 0.5 kpc in the upper panel, shifts to 1.5 kpc in the lower left panel and back inward to about 1 kpc as the bar buckles.
Figures 16 to 18 illustrate the variety of profiles that can be produced by adding bulges and bars to rotating disks. In few cases, based on surface density profiles alone, is it immediately clear that a bar or bulge must be present. Bars can appear as bulges or disappear almost entirely depending on the viewing angle. Bulges can affect only the central 200 pc or extend as far as 1 kpc depending on the intrinsic bulge size and viewing angle. The bar signature also changes as the instability evolves in the disk. We have shown earlier that bars and bulges significantly affect the interpretation of rotation curves. The figures discussed in this section show that is is difficult to unambiguously identify these features based on surface density profiles alone. This section is intended as a cautionary note to researchers who ignore these features in the analysis of galaxy rotation curves.
7.3 Density Profiles From Rotation Curves
As explained in section 5.2, one can infer the density distribution in a galaxy from its rotation curve using eq. 12. Under the assumption that gas and stellar mass contribution is negligible, it is possible to recover the dark matter halo density profile. LSB and Dwarf galaxies are considered to closely satisfy the assumption of being completely dark matter dominated and it is the application of this is the method to LSB and Dwarf galaxies which gives rise to the inference of flat cores in the central density distributions of galaxies. With our models we can check the accuracy of this method.
For model IV (with no bar and no bulge) the ellipse fitting method does a reasonable job recovering the true density. The density versus radius is shown for the model with no bar viewed at an inclination of 80° in Figure 19. At radii of less than 1 kpc the density is underestimated by about 30%. The underestimates vary from 10% to 50% depending on the inclination angle.
These effects are much more pronounced for the barred galaxy model. In figure 20 we show the density for the barred model viewed at an inclination of 75°. Figure 21 and Figure 22 show the same analysis with the bar in the plane of the sky and perpendicular to the plane of the sky. The effects are most pronounced on the latter case. When the bar is perpendicular to the line of sight it is easy to see how an observer would infer the presence of a constant density core in the center of the galaxy. The orientation of the bar with respect to the line of sight has a strong effect on the inferred density profile.
We have computed the the slope of the curve at locations smaller than 1 kpc for the three barred models. We show these in the histogram in Figure 23. The key points is that for barred galaxy models viewed at an inclination greater than or equal to 60°we always measure a slope that is shallower than the true slope. For a true slope of -2 we can obtain slopes as shallow as 0. Note that the NFW profile has a slope of -1, in the light of our findings it is not surprising that slopes of shallower than -1 are being found near the centers of dwarf galaxies.
8 Conclusion
The rotation curves of dwarf and LSB galaxies arguably present the most challenging problem for current cosmological models. The key to this problem lies in reliably estimating the accuracy with which one can recover the mass distribution and, thus, the dark matter density using observed rotation curves. This is the main question which we address in this paper by studying realistic numerical models. The models mimic real galaxies in many respects. For example, they have thin (pc) and cold () exponential disks. The latter condition is very important because many effects are related to the magnitude of random motions.
The main lesson to be learned from our analysis is that there are many systematic biases. Each bias can be very small (only few km/s), yet they all add up to produce significant effects. We find that the tilted ring analysis of spectroscopic data results in large 30% to 50% underestimates of the rotation velocity in the central 1 kpc region of the galaxy models. These underestimates in velocity in turn result in the inference of slopes in the central density distributions of our models that are shallower than the true slopes.
A quantitative understanding of these biases is important if one is to accurately interpret rotation curves. If one ignores these biases, the analysis of rotation curves can produce misleading results. The extent to which this has occurred for real galaxies can only be resolved by detailed analyses of individual objects. One cannot be sure that the analysis of real observations data was done properly when the same analysis produces false results when applied to realistic models.
One of the difficulties in interpreting observational data lies in the fact that galaxies are treated in an overly simplified manner (e.g., cold gas inside thin exponential disks). Observational results (including those presented in this paper) suggest that this is far too naive a picture. In the central region, the stellar component often rotates as fast as the emission-line gas - in contradiction with the prediction of a naive picture of a cold gas embedded in a hot stellar component. The presence small (200-500 pc) bulges and bars, which can be easily overlooked, further complicates the interpretation of the data.
References
- Athanassoula (1984) Athanassoula, L., 1984, Physics Reports, Vol 114, Numbers 5 & 6, 319
- Barnes & Sellwood (2003) Barnes, E.I. & Sellwood J.A. 2003, AJ, 125, 1164
- Blais-Ouellette, Amram & Carignan (2001) Blais-Ouellette, S., Amram, P., Carignan, Claude. 2001, AJ, 121, 1952
- Begeman (1989) Begeman, K.G., 1989, A&A, 223 47
- Beijersbergen, de Blok & van der Hulst (1999) Beijersbergen, M., de Blok, W. J. G. & van der Hulst, J. M., 1999, AJ, 124, 1360
- Bertola et al. (1995) Bertola, F., Cinzano, P., Corsini, E. M., Rix, H., & Zeilinger, W. W. 1995, ApJ, 448, L13
- de Blok & McGaugh (1997) de Blok W.J.G. & McGaugh S.S., 1997, MNRAS, 290, 533
- de Blok, & Bosma (2002) de Blok, W. J. G. & Bosma, A., 2002,A&A, 385, 816 V. C. 2001, ApJ, 552, L23 pJ, 552, L23
- de Blok, McGaugh, Bosma, & Rubin (2001) de Blok, W. J. G., McGaugh, S. S., Bosma, A., & Rubin, V. C., 2001, ApJ, 552, L23 pJ, 552, L23
- de Blok, McGaugh, & Rubin (2001) de Blok, W. J. G., McGaugh, S. S. & Rubin, V. C., 2001, ApJ, 122,2396
- Böker, Stanek & van der Marel (2003) Böker, T., Stanek, R. & van der Marel, R.P., 2003, AJ,125, 1073
- Bolatto, Simon, Leroy, & Blitz (2002) Bolatto, A. D., Simon, J. D., Leroy, A., & Blitz, L. 2002, ApJ, 565, 238
- Burkert (1995) Burkert A., 1995, ApJ, 477, L25
- Cinzano et al. (1999) Cinzano, P., Rix, H.-W., Sarzi, M., Corsini, E. M., Zeilinger, W. W., & Bertola, F. 1999, MNRAS, 307, 433
- Colin, Klypin, Valenzuela, Gottloeber (2004) Colin, P., Klypin, A., Valenzuela, O., & Gottloeber, 2004, ApJ, accepted
- Combes & Sanders (1981) Combes, F. & Sanders, R.H., 1981, A&A, 96,164
- Dalcanton (2003) Dalcanton, J. J., 2003, privite communication.
- de Blok, Bosma, & McGaugh (2003) de Blok, W. J. G., Bosma, A., & McGaugh, S. 2003, MNRAS, 340, 657
- Eskridge et al. (2002) Eskridge, P.B., Frogel, J.A., Pogge, R.W., Quillen, A.C., Berlind, A.A., Davies, R.L., DePoy, D. L., Gilbert, K.M., H, Mark L., Kuchinski, L.E., Ramirez, S.V., Sellgren, K., Stutz, A, Terndrup, D.M. & Tiede, G.P., 2002, ApJS, 143, 73
- Fillmore, Boroson, & Dressler (1986) Fillmore, J. A., Boroson, T. A., & Dressler, A. 1986, ApJ, 302, 208
- Flores & Primack (1994) Flores R., & Primack J.R. 1994, ApJ, 427, L1
- Funes et al. (2002) Funes, J. G., J., S., Corsini, E. M., Cappellari, M., Pizzella, A., Vega Beltrán, J. C., Scarlata, C., & Bertola, F. 2002, A&A, 388, 50
- Galaz, Dalcanton, Infante, & Treister (2002) Galaz, G., Dalcanton, J. J., Infante, L., & Treister, E., 2002, AJ, 124, 1360
- Ghigna et al. (2000) Ghigna, S., Moore, B., Governato, F., Lake, G., Quinn, T., & Stadel, J. 2000, ApJ, 544, 616
- Hayashi et al. (2003) Hayashi, E., Navarro, J.F., Power, C., Jenkins, A., Frenk, C.S., S. D. M. White, S.D.M., Springel, V., Stadel, J., Quinn, T., astro-ph/0310576
- Hernández & Gilmore (1998) Hernández X., & Gilmore G. 1998, MNRAS, 294, 595
- Hill et al. (2001) Hill, T. L., Heisler, C. A., Norris, R. P., Reynolds, J. E., & Hunstead, R. W. 2001, AJ, 121, 128
- Hill, et al. (1999) Hill, T. L., Heisler, C. A., Sutherland, R., & Hunstead, R. W. 1999, AJ, 117, 111
- Hunter et al. (2002) Hunter, D. A., Rubin, V. C., Swaters, R. A., Sparke, L. S., & Levine, S. E. 2002, ApJ, 580,194
- Jedrzejewski (1987) Jedrzejewski, R. 1987, MNRAS, 226, 747
- Jobin & Carignan (1990) Jobin, C. & Carignan, C., 1990, AJ, 100,648
- Klypin, Kravtsov, Bullock, & Primack (2001) Klypin, A., Kravtsov, A. V., Bullock, J. S., & Primack, J. R. 2001, ApJ, 554, 903
- Koda & Wada (2002) Koda, J. and Wada K., 2002, A&A, 396, 867
- Kormendy & Westpfahl (1989) Kormendy, J. & Westpfahl, D. J. 1989, ApJ, 338, 752
- Kravtsov et al. (1997) Kravtsov A. V., Klypin A. A., Khokhlov A. M., 1997, ApJS, 111, 73
- Kravtsov (1999) Kravtsov A. V., 1999, PhD
- Kregel, van der Kruit, & de Grijs (2002) Kregel, M., van der Kruit, P. C., & de Grijs, R. 2002, MNRAS, 334, 646
- Matthews (2000) Matthews, L. D. 2000, AJ, 120, 1764
- Matthews & Wood (2003) Matthews, L. D. & Wood, K. 2003, ApJ, 593, 721
- McGaugh, Rubin, & de Blok (2001) McGaugh, S. S., Rubin, V. C., & de Blok, W. J. G., 2001, AJ, 122, 2381
- Moore (1994) Moore B., 1994, Nature, 370, 629
- Moore et al. (1999) Moore, B., Quinn, T., Governato, F., Stadel, J., & Lake, G. 1999, MNRAS, 310, 1147
- Navarro, Frenk, & White (1997) Navarro, J.F., Frenk, C.S., & White, S.D.M., 1997, ApJ, 490,493
- Pignatelli et al. (2001) Pignatelli, E., et al. 2001, MNRAS, 323, 188
- Pizzella, Corsini, Vega-Beltran & Bertola (2004) Pizella, A., Corsini, E.M., Vega-Beltran, J.C., & Bertola, F., 2004, A&A, submitted, astro-ph/0404558
- Power et al. (2003) Power, C., Navarro, J. F., Jenkins, A., Frenk, C. S., White, S. D. M., Springel, V., Stadel, J., & Quinn, T. 2003, MNRAS, 338, 14
- Reed et al. (1999) Reed, D., Governato, F., Verde, L.,Gardner, J., Quinn, T., Stadel, J., Merrit, D.,& Lake, G. 2003, astro-ph/031254
- Simon, Bolatto, Leroy, & Blitz (2002) Simon, J. D., Bolatto, A. D., Leroy, A., & Blitz, L. 2003, ApJ, accepted
- Swaters, Madore, & Trewhella (2000) Swaters, R.A., Madore, B.F., & Trewhella, M., 2000, ApJ, 531, L107
- Swaters, Madore, van den Bosch, & Balcells (2003) Swaters, R. A., Madore, B. F., van den Bosch, F. C., & Balcells, M. 2003, ApJ, 583, 732
- Swaters, Verheijen, Bershady, & Andersen (2003) Swaters, R. A., Verheijen, M. A. W., Bershady, M. A., & Andersen, D. R. 2003, ApJ, 587, L19
- Tasitsiomi, Kravtsov, Gottloeber, & Klypin (2004) Tasitsiomi, A., Kravtsov, A.V., Gottloeber, S., & Klypin, A., 2004, ApJ, accepted.
- van den Bosch & Swaters (2001) van den Bosch, F.C., & Swaters, R.A., 2001, MNRAS, 325, 1017
- Vega Beltrán et al. (2001) Vega Beltrán, J. C., Pizzella, A., Corsini, E. M., Funes, J. G., Zeilinger, W. W., Beckman, J. E., & Bertola, F. 2001, A&A, 374, 394
- Verheijen (1997) Verheijen, M.A.W., 1997, Ph.D. thesis, Univ. Groningen
- van den Bosch et al. (1999) van den Bosch, F., Robertson, B.E, Dalcanton, J.J, & de Blok, W.J.G., 1999, AJ, submitted (astro-ph/9912004)
- Valenzuela, & Klypin (2003) Valenzuela, O., & Klypin, A., 2003, MNRAS, 345, 406
- Valenzuela, Rhee & Klypin (2004) Valenzuela, O., Rhee G. & Klypin, A., 2004, in preparation
- Wada, Meurer & Norman (2002) Wada K.,Meurer G. & Norman C. A. 2002, ApJ, 577, 197
- Wada & Koda (2001) Wada K.& Koda J. 2002, PASJ, 53, 1163
- Weldrake, de Blok & Walter (2002) Weldrake D.T.F., de Blok W.J.G. & Walter, F, 2002, MNRAS, 340, 12


| Galaxy | MB | Type | Incl. | Scale | Comments | ||
|---|---|---|---|---|---|---|---|
| deg | kpc | kpc | |||||
| IC 267 | -19.91 | 3577 | SBb | 45.0 | 2.0/ 0.4 | 0.248 | Very long 10 kpc bar. Compact |
| bulge. | |||||||
| IC 1029 | -21.00 | 2520 | Sb | 76.0 | 5.0/ 0.4 | 0.175 | Compact bulge. Gas rotation is |
| measured using SII emission line. | |||||||
| NGC 5389 | -19.17 | 1996 | SABa | 78.5 | 3.0/ 0.45 | 0.14 | Strong ring at 6 kpc. |
| NGC 5746 | -20.51 | 1676 | SABb | 80.5 | 2.5/ 1.2 | 0.12 | Large peanut-shape bulge/bar |
| NGC 5719 | -18.79 | 1676 | SABab | 70.0 | 2.2/ 1.1 | 0.116 | Barred galaxy with a large bulge. |
| NGC 5793 | -19.11 | 3387 | Sb | 70.5 | 4.2/ 1.1 | 0.234 | |
| NGC 6368 | -19.98 | 2904 | Sb | 75.5 | 6.0/ 0.7 | 0.201 | Gas rotation is measured using |
| SII emission line. | |||||||
| NGC 7537 | -9.42 | 2888 | Sbc | 70.0 | 5.5/ 1.4 | 0.200 |
| Parameter Model | Model I | Model II | Model III | Model IV | Model V |
|---|---|---|---|---|---|
| “Bar” | “Dwarf” | “Bulge” | “Thin Disk” | “Disk” | |
| Halo mass M | 4.3 | 6.0 | 6.8 | 6.0 | 6.0 |
| Disk mass M | 9.5 | 5.7 | 6.8 | 5.7 | 5.7 |
| Bulge mass M | – | – | 8.2 | – | – |
| Initial disk scale length , kpc | 1.16 | 0.7 | 1.75 | 2.14 | 1.75 |
| Final disk scale length , kpc | 1.50 | 0.7 | 1.75 | 2.14 | 1.75 |
| Initial disk scale height , pc | 90 | 108 | 55 | 150 | 300 |
| Final disk scale height , pc | 135 | 120 | 70 | 150 | 300 |
| Disk stability parameter | 1.2 | 1.2 | 1.5 | 3.0 | 3.0 |
| Bulge half-mass radius, pc | – | – | 250 | – | – |
| Number of halo particles | 3.3 | 3.45 | 2.2 | 3.45 | 3.45 |
| Number of disk particles | 2 | 1.6 | 8 | 1.6 | 1.6 |
| Number of bulge particles | – | – | 9.7 | – | – |
| Halo concentration C | 11.5 | 12.0 | 11.0 | 12.0 | 12.0 |
| Maximum Force Resolution, pc | 11 | 16 | 19 | 16 | 16 |
| Duration of evolution, Gyrs | 4.2 | 2.2 | 1.4 | 1.6 | 1.2 |
| Time-step, yrs |