The Properties and the Evolution of the Highly Ionized Gas in MR 2251178
Abstract
We present the first XMM-Newton observations of the radio-quiet quasar MR 2251178. We model the X-ray spectrum with two power laws, one at high energies with a slope of and the other to model the soft excess with a slope of , both absorbed by at least two warm absorbers (WAs). The high-resolution grating spectrum shows emission lines from N vi, O vii, O viii, Ne ix, and Ne x, as well as absorption lines from the low ionization ions O iii, O iv, and O v. A study of the spectral variations in MR 2251178 over a period of 8.5 years yields that all X-ray observations can be fitted with the above model. Luminosity variations over timescales of years seem to correlate with the soft excess variations but not with the WA properties variations. The overall picture is that of a stratified WA that enters and disappears from the line-of-sight on timescales of several months. We also present the first FUSE spectrum of MR 2251178. The general characteristics of the UV and X-ray absorbers seem to be consistent.
School of Physics and Astronomy, Raymond and Beverly Sackler Faculty of Exact Sciences, Tel-Aviv University, Tel-Aviv 69978, Israel
Joint Center for Astrophysics, Physics Department, University of Maryland, Baltimore County, 1000 Hilltop Circle, Baltimore, MD 21250, USA, and Laboratory for High Energy Astrophysics, NASA/ Goddard Space Flight Center, Code 662, Greenbelt, MD 20771, USA.
Astrophysics Group, Imperial College London, Blackett Laboratory, Prince Consort Road, London SW7 2AZ, UK.
1. Introduction
MR 2251178 (, ) is the first quasar detected by X-ray observations (using and -3 in 1977) and also the first quasar where a warm absorber (WA) was suggested to explain the X-ray spectrum (Halpern 1984). It was observed by practically all X-ray missions since . Previous X-ray data of MR 2251178 were modeled using a power-law with photon index –1.7 and a WA with column density in the range cm-2(e.g., Mineo & Stewart 1993; Orr et al. 2001; Morales & Fabian 2002). The X-ray flux of the source is variable on timescales of days. The observed 2–10 keV flux of MR 2251178 covers the range of – erg cm-2 s-1 which translates to a 2–10 keV luminosity of – erg cm-2 s-1.
UV spectra of MR 2251178 were obtained by the Hubble Space Telescope at three epochs and show clear Ly and C iv absorption. Ganguly et al. (2001) found the C iv doublet absorption to vary with time, suggesting an intrinsic origin for this absorption.
In this contribution we present new XMM-Newton and FUSE observations of MR 2251178. We also carry out an in-depth analysis of the 10 available ASCA observations and the two BeppoSAX observations.


2. The X-ray Spectra and Past variations
MR 2251178 was observed with - in 2000 and in 2002. The flux in the 2002 observation was about 2.5 times lower than the 2000 observation. The EPIC-pn data of the 2002 observation clearly show a power law with a photon index of at energies above 3 keV. Extrapolating this power law to lower energies revels the presence of a WA around 0.8 keV, an additional absorber below 0.5 keV, and some excess emission around 0.5 keV (Figure 1a). Our best fitted model for these data yields a WA with a column density, , of cm-2, ionization parameter, , of and a line of sight covering factor of 0.8. Assuming gas with the same properties produces the emission, we find a global covering factor of 0.3. For the less ionized absorber we find that it can be fitted by a neutral absorber (in addition to the galactic one) with cm-2. This absorber can also be modeled as a combination of low-ionization absorber with and cm-2 and a neutral absorber of cm-2. Both cases give equally good fits. Fitting the above model to the 2000 observation clearly revels the presence of a soft excess (Figure 1b) which can be fitted with an additional power law with a photon index of at energies less than keV.
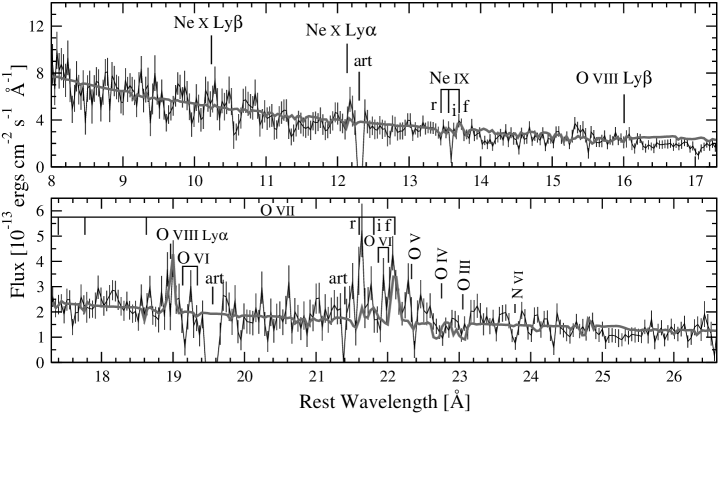
The high-resolution grating spectrum of the 2002 observation is shown in Figure 2. The spectrum shows emission lines from N vi, O vii, O viii, Ne ix, and Ne x, as well as absorption lines from the low ionization ions O iii, O iv, and O v. The data were fitted with a detailed photoionization model which includes the components described above and is shown in Figure 2.
We used the model with the two power laws and two absorbers described above to fit historical data of MR 2251178 obtained over 8.5 years. The WA properties during the 6 weeks of observations in 1993 were consistent with those of an absorber with a column density of cm-2. These data are consistent with the scenario in which the decrease in flux caused a corresponding decrease in the ionization parameter. However, the MR 2251178 observations are not frequent and detailed enough to infer on the location of the gas.
On timescales of years, the WA properties change in time but are not correlated with luminosity variations. Our only successful model requires that the absorbing material is changing in time. For example, the 1996 observations clearly indicate a larger column density ( cm-2 vs. cm-2) and a smaller ionization parameter ( vs. ) of the WA compared to 1993. We suggest that a physical motion of gas into and out of our line-of-sight can cause these changes in the absorber properties. In the 2002 - observation, the flux is smaller by a factor of 2 compared with 1993 observations, yet the column density and the ionization parameter are similar. Comparing the two - observations yields a similar conclusion. This might mean that the absorbing material has changed between the epochs since the SED is very similar but the luminosity decrease between the epochs was not accompanied by a corresponding decrease in ionization parameter. An alternative explanation can be that the absorbing material is far from the central source and does not respond to the luminosity variations.

3. The High Resolution FUSE spectrum
The FUSE spectrum (Figure 3) shows broad emission lines of O vi and C iii which also show significant blueshifted absorption. We also detect blueshifted absorption from at least 10 lines of the H i Lyman series. We identify at least 4 absorption systems, one at 580 km s-1 and at least 3 others which are blended together and form a wide trough covering the velocity range of 0 to 500 km s-1. The trough profiles are consistent with the absorption in the high resolution X-ray spectrum (though the later does not have sufficient resolution) and suggest that the UV and X-ray absorptions may arise from the same region in the AGN.
Acknowledgments.
We acknowledge a financial support by the Israel Science Foundation grant no. 545/00. S. K. also acknowledge financial support by Colton Foundation.
References
Ganguly, R., Charlton, J. C., & Eracleous, M. 2001, ApJ, 556, L7
Halpern, J. P. 1984, ApJ, 281, 90
Mineo, T. & Stewart, G. C. 1993, MNRAS, 262, 817
Morales, R. & Fabian, A. C. 2002, MNRAS, 329, 209
Orr, A. et al. 2001, A&A, 376, 413