The mass distribution in early type disk galaxies
Abstract
We are studying the mass distribution in a sample of 50 early type spiral galaxies, with morphological type betweens S0 and Sab and absolute magnitudes MB between -18 and -22; they form the massive and high-surface brightness extreme of the disk galaxy population. Our study is designed to investigate the relation between dark and luminous matter in these systems, of which very little yet is known.
From a combination of WSRT Hi observations and long-slit optical spectra, we have obtained high-quality rotation curves. The rotation velocities always rise very fast in the center; in the outer regions, they are often declining, with the outermost measured velocity 10-25% lower than the maximum.
We decompose the rotation curves into contributions from the luminous (stellar and gaseous) and dark matter. The stellar disks and bulges always dominate the rotation curves within the inner few disk scale lengths, and are responsible for the decline in the outer parts. As an example, we present here the decompositions for UGC 9133. We are able to put tight upper and lower limits on the stellar mass-to-light ratios.
Kapteyn Institute, PO Box 800, 9700 AV Groningen, The Netherlands
Osservatorio Astronomico, Via Ranzani 1, 40127 Bologna, Italy & Kapteyn Institute, PO Box 800, 9700 AV Groningen, The Netherlands
Johns Hopkins University, 3400 N. Charles St., Baltimore MD 21218, U.S.A. & Space Telescope Science Institute, 3700 San Martin Dr., Baltimore, MD 21218, U.S.A.
1. Introduction
Rotation curves, in particular from Hi data extending well outside the optical disks, have been proven in the last 30 years to be a useful tool for the study of dark matter in disk galaxies. A recent review on the observations and properties of rotation curves has been given by Sofue & Rubin (2001). Hi observations of early type, massive disk galaxies are however rare. Broeils (1992) showed a compilation of all high-quality Hi rotation curves known to that date; only 4 out of 23 galaxies had maximum rotation velocity km/s. Since then, many more low- and intermediate mass galaxies have been studied in Hi (De Blok, McGaugh & Van der Hulst 1996, Swaters 1999, Verheijen & Sancisi 2001, Coté, Carignan & Freeman 2000), but little progress has been made on the high-mass side. The Universal Rotation Curve of Persic, Salucci & Stel (1996) was based on 1100 rotation curves, but only 2 were of type Sab or earlier.
In this study, we address specifically the relation between luminous and dark matter in massive, early-type spiral galaxies. We investigate whether these systems follow the general trends that exist in later type galaxies (e.g. Tully-Fisher, dark matter content vs. morphological type or surface brightness, etc.), or that they form a distinct class of galaxies with different characteristics.
2. Sample selection and Observations
The Hi observations are taken from the WHISP survey. WHISP galaxies were selected from the UGC on the basis of position on the sky (), angular size () and Hi line flux (). These criteria ensure that the galaxies are well resolved, and that the signal-to-noise ratio of the observations is sufficient.
The total survey contains about 80 galaxies with morphological type between S0- and Sab. From this subsample, we choose by eye the approximately 50 galaxies that have a well-defined velocity field showing ordered rotation.
We have obtained additional long-slit H spectra at high angular resolution from the INT on La Palma, to circumvent the problem of beam-smearing in the Hi data. The stellar mass distribution is determined from multi-color broad-band optical images taken with the JKT on La Palma.
3. Shapes of the rotation curves
In fig. 1, we show rotation curves of 9 galaxies, derived using a tilted-ring fit to the Hi velocity fields.
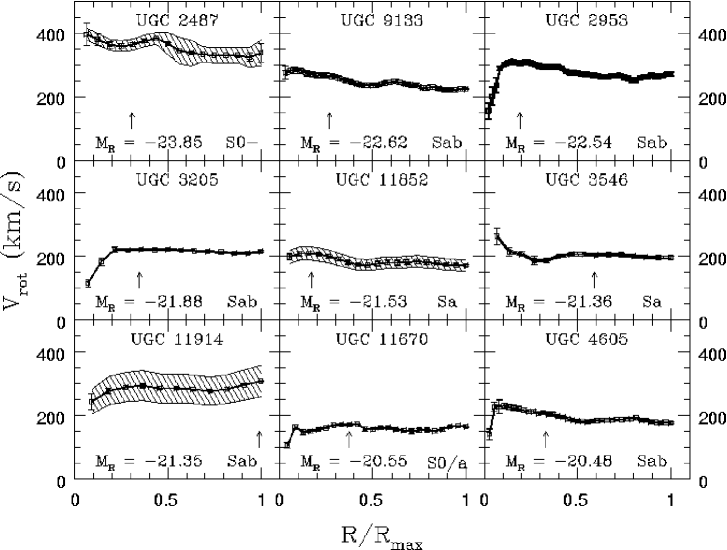
No H observations have been used for these curves. This figure shows some properties that are typical for the rotation curves of this type of galaxies:
-
•
The rotation curves rise extremely fast in the inner regions. Often, the maximum velocity is reached within one Hi-beam. H observations are clearly needed to resolve the central velocity gradient.
-
•
In the outer regions most rotation curves show a slow but systematic decline. In some cases the outer velocity is less than 80% of the maximum velocity. This decline can not be explained as the result of warping in the outer regions. The uncertainties in the inclination and position angle are usually well understood; the resulting errors in the velocities are indicated by the hatched regions. The fact that so many rotation curves are declining, also argues against warps; if warps have no preferential direction, they should equally frequently produce rising rotation curves.
Casertano & Van Gorkom (1991) argued that declining rotation curves mostly occur in galaxies with a compact light distribution, i.e. small scale lengths. However, some of our galaxies with declining rotation curves are not compact at all. UGC 9133 for example, having one of the most strongly declining rotation curves in the sample, has a disk scale length of 9.3 kpc. Our results seem to indicate that the majority of early-type disk galaxies have rotation curves that are more or less declining in the outer parts.
-
•
The maximum rotation velocities are large: . This may in principle be due to selection effects in our sample definition. We will investigate this issue further in the future.
The rotation curves presented in fig. 1 look remarkably different from the ones of later-type galaxies, which usually rise slowly and then become flat at large radii. Persic et al. (1996) found, from a large sample of later-type galaxies, strong correlations between rotation curve shape and amplitude on one hand and other structural parameters such as luminosity, surface brightness, size, etc. on the other hand. For a good understanding of the relation between dark and luminous matter, it is important to know whether these relations can simply be extrapolated to our bright early-type galaxies, or that they need further fine-tuning. We will investigate this at a later stage.
4. Mass modeling: UGC 9133
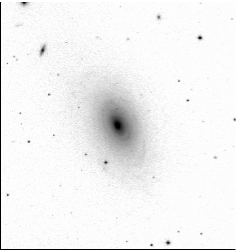
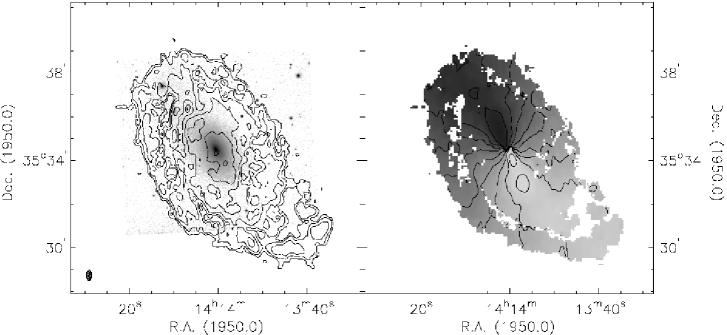
The major goal of our study is to get a detailed picture of the mass distribution in individual galaxies. We decompose the rotation curves into contributions from stellar bulges and disks, neutral gas and dark matter. To illustrate the method, we show here the analysis for UGC 9133. Some basic parameters of this galaxy are given in table 1, and an R-band image from the JKT is shown in fig. 2. The Hi observations are shown in fig. 3.
| Table 1. UGC 9133: basic data | |
|---|---|
| NGC | 5533 |
| RA (J2000) | 14h 16m 7.76s |
| Dec (J2000) | 35∘20’ 38.3” |
| Type | Sab |
| Distance | 54 Mpc |
| MB | -21.22 |
| Hi mass | |
| Disk scale length | 9.3 kpc |
| Bulge-Disk ratio | 0.74 |
| Numbers are based on a Hubble | |
| constant of H0 = 75 km/s/Mpc. | |
| The scale length and B/D-ratio are | |
| measured on the R-band image shown | |
| in fig. 2. | |
To account for the contribution from the stars to the rotation curves, we extract a surface brightness profile from the optical image, by azimuthally averaging the intensities over concentric elliptic annuli. A bulge-disk decomposition is performed by fitting the sum of a Sersic-bulge and an exponential disk to the profile. Each component is assigned a mass-to-light ratio (M/L) which is assumed to be constant with radius. We then follow the procedures given by Casertano (1983) to calculate the contribution from both components to the rotation curve. A similar procedure is followed with the Hi density distribution. To account for the presence of primordial Helium, the Hi surface densities are multiplied by 1.43.
Although the rotation velocities in the inner parts can usually be explained by the luminous matter only, a dark matter halo is needed to explain the rotation curve in the outer regions. This is modelled as a pseudo-isothermal sphere with 2 free parameters: the central density and the core radius . The full model thus consists of 4 free parameters: 2 M/L-ratios and 2 halo parameters.
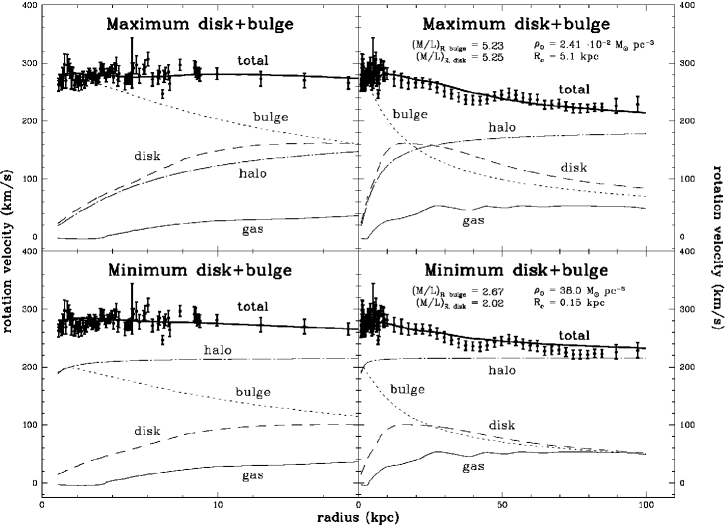
As in later-type galaxies, there is a degeneracy between the stellar M/L-ratios and the halo parameters. The maximum M/L-ratios are reached in models where the bulge and disk account fully for the observed rotation velocities in the inner regions, with the dark halo only contributing at larger radii (’maximum bulge+disk’, upper panels in fig. 4). In this case however, the steep rise of the rotation curve in the central regions and the decline at larger radii also allow us to put tight lower limits to the M/L-ratios for bulge and disk (’minimum bulge+disk’, lower panels in fig. 4), thereby fixing the stellar M/L-ratios to within a factor of 2. This is in contrast with late-type and LSB galaxies, where usually no lower limits can be given (Swaters 1999, De Blok & Bosma 2002).
Only by invoking exotic, highly concentrated dark matter models, can we decrease the stellar M/L-ratios further. Already our minimum bulge+disk model shown in fig. 4 has an extremely concentrated dark halo, at odds with current theories of structure formation. Alam, Bullock & Weinberg (2002) use numerical simulations to predict the densities and concentrations of dark matter halos. They use the quantity , and derive values between and for the range of galaxies in our sample. Indeed, our maximum bulge+disk model has ; however, our minimum bulge+disk model has , orders of magnitudes too high. We conclude that the M/L-ratios for the stars must be close to the maximum values shown in the upper panels of fig. 4 for any realistic dark halo.
5. Conclusions
We study the rotation curves and mass distribution in a sample of 50 early-type disk galaxies (S0 to Sab); this part of the galaxy population has not well been studied yet.
The rotation curves rise extremely fast in the center, and are often declining at large radii. Their shapes can only be explained if the stellar bulge and disk dominate the gravitational potential in the central regions. Dark matter is needed to explain the observed rotation velocities in the outer regions. A range of stellar mass-to-light ratios can be used to fit the data, but we are able to constrain the M/L-values with tight upper and lower limits.
References
Alam, S.M.K., Bullock, J.S., & Weinberg, D.H. 2002, ApJ, 572, 34
De Blok, W.J.G., McGaugh, S.S., & Van der Hulst, J.M. 1996, MNRAS, 283, 18
De Blok, W.J.G., & Bosma, A. 2002, A&A, 385, 816
Broeils, A.H. 1992, PhD thesis, Rijksuniversiteit Groningen
Casertano, S. 1983, MNRAS, 203, 735
Casertano, S., & Van Gorkom, J.H. 1991, AJ, 101, 1231
Coté, S., Carignan, C., & Freeman, K.C. 2000, AJ, 120, 3027
Persic, M., Salucci, P., & Stel, F. 1996, MNRAS, 281, 27
Sofue, Y., & Rubin, V. 2001, ARA&A, 39, 137
Swaters, R.A. 1999, PhD thesis, Rijksuniversiteit Groningen
Verheijen, M.A.W., & Sancisi, R. 2001, A&A, 370, 765