Detection of highly ionized O and Ne absorption lines in the X-ray spectrum of 4U1820–303 in the globular cluster, NGC 6624
Abstract
We searched for absorption lines of highly ionized O and Ne in the energy spectra of two Low-mass X-ray binaries, 4U1820–303 in the globular cluster NGC6624 and Cyg X-2, observed with the Chandra LETG, and detected O VII, O VIII and Ne IX absorption lines for 4U1820–303. The equivalent width of the O VII line was eV (90 % errors) and the significance was 6.5 . Absorption lines were not detected for Cyg X-2 with a 90 % upper limit on the equivalent width of 1.06 eV for O VII . The intrinsic line width was not resolved and an upper limit corresponding to a velocity dispersion of was obtained for the O VII line of 4U1820–303. The ion column densities were estimated from the curve of growth analysis assuming several different values of . The absorption lines observed in 4U1820–303 are likely due to hot interstellar medium, because O will be fully photo-ionized if the absorbing column is located close to the binary system. The velocity dispersion is restricted to from consistency between O VII and lines, Ne/O abundance ratio, and H column density. The average temperature and the O VII density are respectively estimated to be and . The difference of O VII column densities for the two sources may be connected to the enhancement of the soft X-ray background (SXB) towards the Galactic bulge region. Using the polytrope model of hot gas to account for the SXB we corrected for the density gradient and estimated the midplane O VII density at the solar neighborhood. The scale height of hot gas is then estimated using the AGN absorption lines. It is suggested that a significant portion of both the AGN absorption lines and the high-latitude SXB emission lines can be explained by the hot gas in our Galaxy.
Subject headings:
X-rays:individual(4U1820–303, NGC 6624, Cyg X-2) — X-rays:ISM1. Introduction
The existence of hot ( K) interstellar medium in our Galaxy has been known since the early 1970’s, mainly from two kinds of observations: the soft X-ray background (SXB) in the 0.1 – 1 keV range (e.g. Tanaka & Bleeker (1977)) and UV OVI absorption lines (e.g. Jenkins (1978)) in OB stars.
The SXB in the so-called 1/4 keV band is dominated by the emission from the local bubble with around the sun (Snowden et al., 1990). On the other hand, in the 3/4 keV band, where the emission is dominated by O VII and O VIII K lines, the majority of emission comes from hot interstellar medium with , which is considered to widely distributed in the Galactic disk, the bulge, and the halo (Kuntz & Snowden, 2000, and reference therein). The SXB shows enhancement in a circular region in radius centered at the Galactic center. These are attributed to hot gas in the bulge of our Galaxy. Near the Galactic plane (), the emission is strongly absorbed by neutral matter. However, there remains emission comparable to that at high latitude in the 3/4 keV band (Snowden et al., 1997; Park et al., 1998; Almy et al., 2000). McCammon et al. (2002) clearly resolved for the first time the O VII, O VIII, and a few other emission lines in the SXB at high latitude () with a rocket-borne microcalorimeter experiment. From the result they estimate that at least 42 % of the soft X-ray background in the energy band that includes the O emission lines comes from thermal emission at and 38 % from unresolved AGN. The origin of the remaining 20 % (34% for a 2 upper limit) is still unknown and could be extragalactic diffuse emission.
The O VI absorption line is considered to represent hot gas at lower temperatures, typically . The O VI absorption lines observed in 100 extragalactic objects and two halo stars by FUSE are consistent with a picture where the hot gas responsible for the absorption has a patchy distribution but on the average has a plane-parallel exponential distribution with an average O VI midplane density of and a scale height of kpc (Savage et al., 2003). The average velocity dispersion of O VI absorption lines is with a standard deviation of .
On the other hand, O VII, O VIII, Ne IX, and C VI absorption lines were detected in the energy spectra of bright active galactic nuclei (AGN) observed with the dispersive spectrometers on board the Chandra and XMM-Newton observatories. (Nicastro et al., 2002; Fang et al., 2002; Rasmussen et al., 2003). In spite of the fact that the redshift is consistent with 0, a large fraction of the absorption is considered to arise from the hot () plasma outside our Galaxy, i.e. the so-called warm-hot intergalactic medium (WHIM, Cen & Ostriker (1999); Davé et al. (2001)). For example, Rasmussen et al. (2003) argued that the scale height of the hot gas should be larger than 140 kpc in order to consistently explain the equivalent width of the O VII absorption line and the intensity of the emission line at the same time. However, obviously the hot gas in our Galaxy contributes to the absorption lines to some extent.
In order to constrain the density and distribution of hot gas which is responsible for O VII and O VIII emission in our Galaxy, and to constrain its contribution to the SXB and to the AGN absorption lines, we searched for absorption lines of highly ionized O in the energy spectra of Galactic X-ray sources.
In this paper we report the first detection of O VII, O VIII and Ne IX absorption lines in the X-ray spectrum of 4U1820–303 in the globular cluster NGC6624 observed with the low energy transmission grating (LETG) on board the Chandra observatory. We consider that the absorption lines are most likely due to the interstellar medium. We constrain the temperature and density of the plasma responsible for the absorption and compare the results with the models of the SXB, the AGN absorption lines, and the SXB emission lines.
Throughout this paper, we quote single parameter errors at the 90 % confidence level unless otherwise specified.
2. Analysis and results
In order to detect interstellar O VII and O VIII absorption lines, we need to select an appropriate X-ray lighthouse for the study. First, the absorption by neutral matter must be small. We set a criterion, , so that the X-ray transmission at O line energies is larger than 0.2. On the other hand, a larger ionized O column density is expected for distant sources, and thus for sources with a large . Thus, we should select sources close to . Sources at a high Galactic latitude may be better because a larger column-density ratio of ionized O to neutral H is expected. Finally, we need a bright X-ray source with a featureless X-ray spectrum. According to those criteria, we selected two low mass X-ray binaries, 4U1820–303 and Cyg X-2.
In this section we first describe the analysis and results for 4U1820–303 and Cyg X-2. The analysis of the latter will be described only briefly because the analysis of the spectrum near O absorption of the same data set has already been described in detail in a separate paper (Takei et al., 2002).
2.1. 4U1820–303
4U1820–303 is a Low-Mass X-ray Binary (LMXB) located in the globular cluster NGC 6624 at (, ) = (, ). The distance of the star cluster is determined from the optical reddening, and the brightness of horizontal-branch and main-sequence turn-off stars (Richtler et al., 1994; Kuulkers et al., 2003). In this paper we adopt the value kpc from Kuulkers et al. (2003). The authors also state that the peak brightness of X-ray bursts with photospheric expansion is consistent with this distance and the He Eddington limit. Adopting the distance of 7.6 kpc, 4U1820–303 is located 1.0 kpc above the Galactic disk. The neutral hydrogen column density towards the source is estimated to be from E(B-V) (Kuulkers et al., 2003; Bohlin et al, 1978). This is consistent with the total H I column density of our Galaxy, from 21 cm radio observations (Dickey & Lockman, 1990).
2.1.1 Data reduction
4U1820–303 was observed with the LETG/HRC(High Resolution Camera)-S for 15.1 ks on March 10, 2000 (obsID 98). We retrieved the archival data from the CXC (Chandra X-ray Center). We used the data reprocessed by CXC on January 1, 2002. The ASCDS version number is 6.5.1. Throughout the present analysis, we used the software CIAO 2.3 with the calibration data in CALDB 2.21.
During the present observation, the source exhibited only 2.1 % rms intensity variation on time scales longer than 10 minutes. Thus, we integrated all the data after the standard data screening. We then summed the spectra of the positive and negative orders, and rebinned to 0.025 Å bins, and subtracted the background. The background was only of the source counts in the wavelength region we used in the later analysis. The spectrum we obtained contains photons not only of the first order dispersion but also of the higher orders. We subtracted the higher order spectra using the method described in Paerels et al. (2001) and Takei et al. (2002).
We estimated the statistical errors of the first order spectrum by error propagation. Because of the error propagation, the statistics of the spectral bins are no longer completely independent. However, the increase of the statistical errors after the higher order subtraction is smaller than 1% in the wavelength ranges we use in the following analysis. We thus treat them as independent in the spectral fitting.
According to the LETGS calibration report at the CXC 111see http://cxc.harvard.edu/cal/Letg/calstatus.html, the wavelength calibration of LETGS spectra is accurate to 0.02 %. This is smaller by an order of magnitude than the statistical errors of wavelength determined in the following analyses.
2.1.2 O and Ne absorption lines
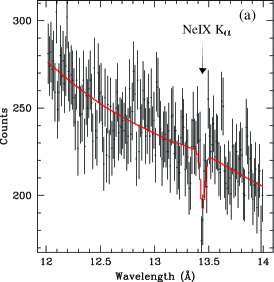
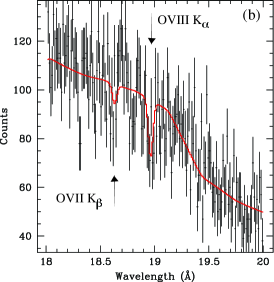
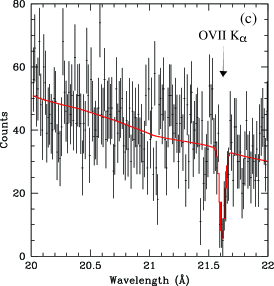
In the observed spectrum of 4U1820–303, we clearly found an absorption line at 21.6 Å (see Figure 1(c)) in addition to the neutral-O absorption structures near 23 Å. From the wavelength, the absorption line can be identified as the O VII Kα resonant line. We also noticed absorption lines corresponding to O VIII Kα and Ne IX Kα (Figure 1(a)(b)). We also looked at the wavelength corresponding to O VII Kβ, but the absorption line was not clear.
In order to estimate the centroid wavelength, the intrinsic width, and the equivalent width of the lines, we performed spectral fits. Since we fit a spectrum of relatively narrow wavelength range, we assumed a power-law function with absorption by neutral matter for the continuum spectrum. We determined the continuum model parameters for Ne (Ne IX) and O (O VII Kα, O VIII Kα, and O VII Kβ lines) separately. The wavelength ranges are respectively 18 to 28 Å for O and 12 to 14 Å for Ne, excluding the narrow wavelength ranges of the absorption lines: 18.4 – 19.2 Å, 21.4 – 21.8 Å, and 13.3 – 13.6 Å. We represented the absorption with the tbabs model in the ‘sherpa’ program (Wilms et al., 2000) with the H column density fixed to for Ne. For O, we used the model employed by Takei et al. (2002) for Cyg X-2. We set the O abundance of the tbabs model to zero and represented the O absorption features with three edge models and two absorption lines.
We then determined the absorption line parameters, fitting the spectra in the wavelength ranges shown in Table 1. In these fits, we fixed the power-law index and the absorption parameters of the continuum to the values obtained in the previous fits. Thus, the free parameters are: the normalization of the continuum, the centroid wavelength, the intrinsic width, and the equivalent width of the absorption line. We modeled the absorption line by adding a negative Gaussian to the continuum. The best fit parameters of the absorption lines are summarized in Table 1. In the table we expressed the intrinsic width of the line with the parameter, which is related to the Gaussian of the fitting model as ( is the velocity of light). Thus is related to the temperature as in the case of thermal Doppler broadening where are respectively the Boltzmann constant, the temperature, and the mass of the ion.
As shown in Table 1, we obtained only an upper limit for the intrinsic width . The present model gives “negative X-ray intensity” in the model photon spectrum when the intrinsic width is narrower than a certain value. However, even in such cases, the model spectrum convolved with the detector response function is positive and the equivalent width of the line is correctly estimated. We confirmed this by simulations, generating model spectra using an absorption line with a Voigt profile and fitting them with a negative Gaussian function. The difference between the model equivalent width and the best-fit value was less than 3%. The column densities of ions will be estimated from the equivalent width utilizing the curve-of-growth analysis later.
The centroid wavelengths of three lines are consistent with O VII Kα, O VIII Kα, and Ne IX Kα at zero redshift, respectively. Those lines are statistically significant at the 6.5, 3.1, and 4.5 sigma levels. We obtained only an upper limit for the equivalent width of the O VII Kβ line.
| fitting range | centroid | Width () | EW | ||
| Line ID | (Å) | (Å) | () | () | (eV) |
| 4U1820–303 | |||||
| 20– 22 | -79 to +150 | ||||
| 18– 20 | -230 to + 330 | (1) | |||
| 18– 20 | 18.629 | (1) | |||
| 12– 14 | -350 to +200 | (1) | |||
| Cyg X-2 | |||||
| 20– 22 | (1) |
(1) The error domain for O VII line of 4U1820–303 is assumed for the estimation of the error domain (or the upper limit) of the equivalent width.
2.2. Cyg X-2
Cyg X-2 is a LMXB located at (, )=(, ). The distance is estimated to be 7.2 kpc, which locates the source at 1.4 kpc above the Galactic disk. The neutral hydrogen column density towards the source is (see Takei et al. (2002) and references therein).
The X-ray spectrum near the neutral O edge observed with the Chandra LETG/HRC-I was studied by Takei et al. (2002). We used the spectrum and continuum model function in the paper and fitted a narrow wavelength range including the O VII absorption line. As shown in Table 1, we obtained only an upper limit for the O VII absorption line.
2.3. Curve of growth and ion column densities
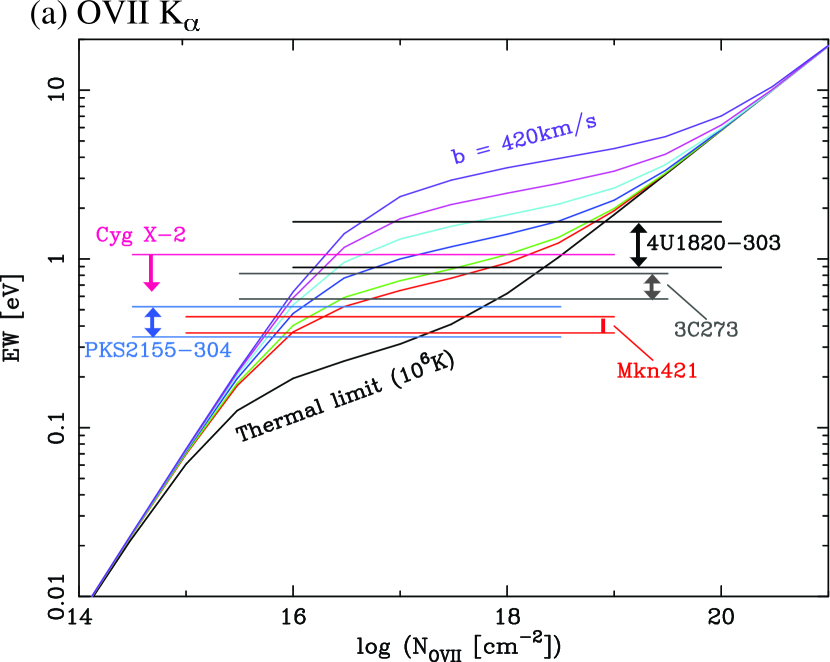
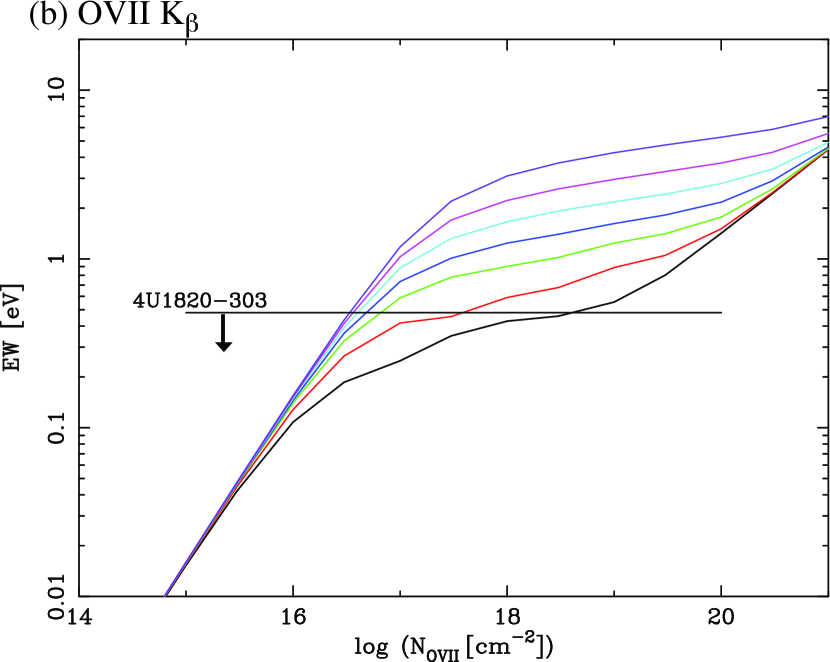
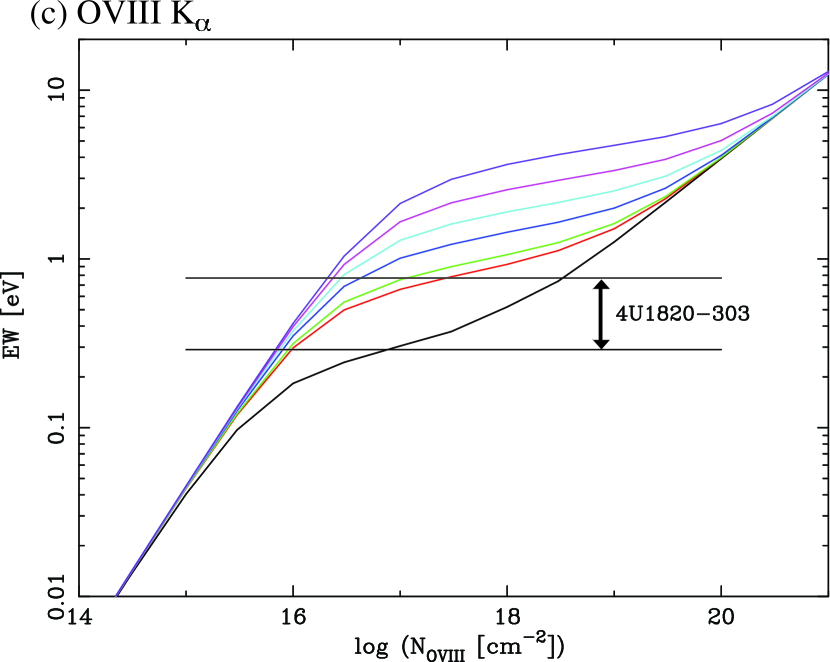
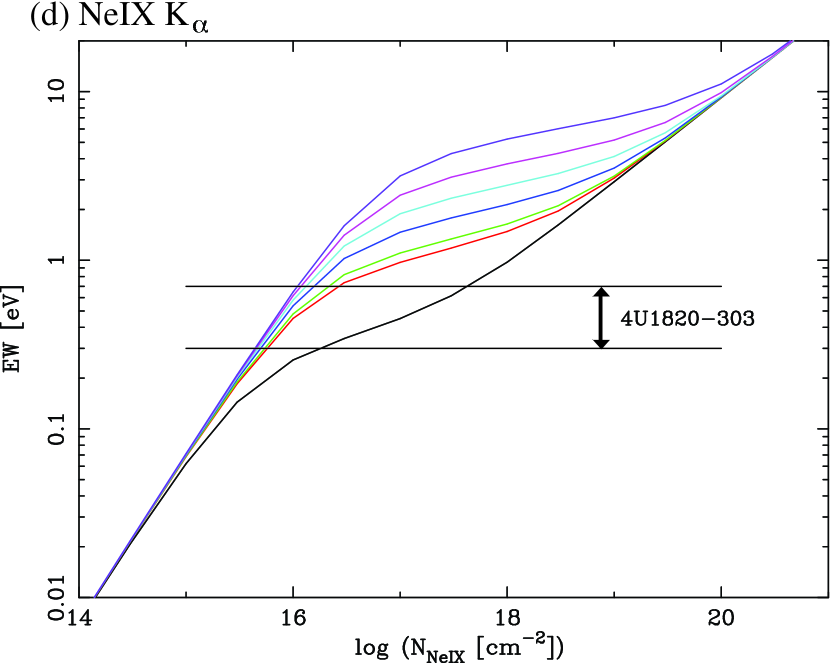
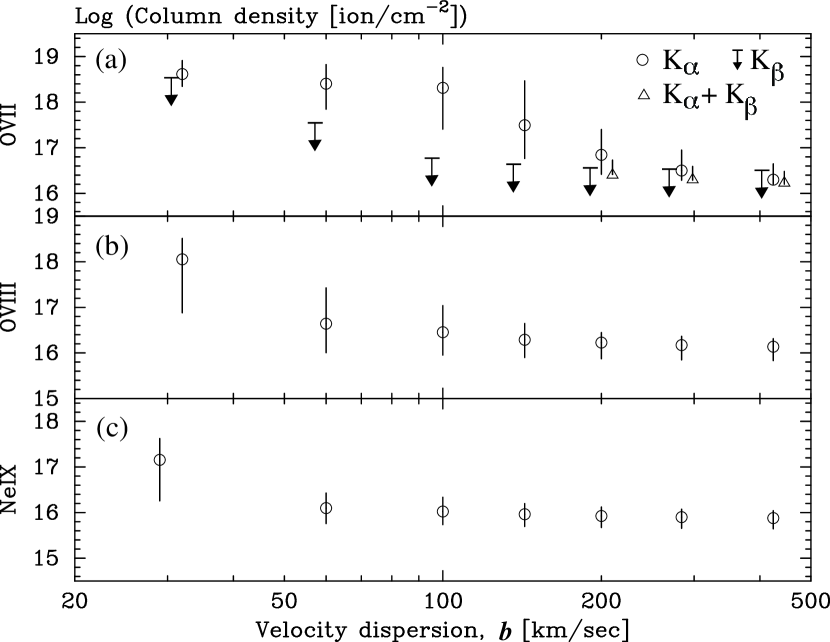
In order to constrain the ion column densities, we performed curve of growth analysis (e.g. Nicastro et al. (1999); Kotani et al. (2000)). We adopted the oscillator strength and the transition probability from Verner et al. (1996) for O VII , , and O VIII , and from Behar & Netzer (2002) for Ne IX . From the analysis, we obtain the equivalent width of the line as a function of the ion column density and the velocity dispersion. In Figure 2, we show the curves of growth of the four ions for several different values of . As the maximum value of , we adopted the upper limit of the intrinsic width of the O VII Kα absorption line. The lowest value of in Figure 2 corresponds to thermal motion at a temperature of K. We show in Figure 3 the O VII, O VIII, and the Ne IX column densities for 4U1820–303 as functions of . The error domain and the upper limit of the O VII column density () obtained from and lines do not overlap with each other for , suggesting the velocity dispersion is either as small as the thermal velocity of K or .
We re-determined for , minimizing the sum of the two of the and spectral fits;
where all other spectral parameters were respectively optimized. The best fit values are plotted in Figure 3 (a). They are in the range, .
3. Discussion

We searched for ionized O and Ne absorption lines in the energy spectra of 4U1820–303 and Cyg X-2 observed with the Chandra LETG. We detected O VII and O VIII and Ne IX lines for 4U1820–303 and determined the equivalent widths and an upper limit on the intrinsic width. From the curve of growth, we estimated the column densities as functions of the velocity dispersion, . In order to make the equivalent widths of O VII and consistent to each other, must be either as small as the thermal velocity or . On the other hand, we obtained only upper limits on absorption lines for Cyg X-2. In this section we will discuss the physical parameters of hot plasma responsible for the 4U1820–303 absorption lines, and the possible distribution of hot plasma in our Galaxy.
We first consider the possibility that the absorption lines observed in 4U1820–303 are due to photo-ionized plasma associated with the binary system. In such cases, the temperature of the plasma can be lower than K. Thus, we calculated the curve of growth for zero velocity dispersion to obtain the firm upper limit of the column densities. For O VII, it is . From the observed equivalent widths and the values of oscillator strengths, we find that the column density of O VII is not smaller than that of O VIII. Thus, it is natural to assume that O VII is the dominant ionization state of O and that the ionization fraction of O VII is on the order of . Then, assuming the solar abundance, the hydrogen column density of the plasma must be . 4U1820–303 is known to be an extremely small system with an orbital period of 685 s. The size of the binary system is smaller than (Stella, Priedhorsky, and White, 1987). If the plasma is located at a distance from the X-ray star, the ionization parameter is with a luminosity of and cm. Then O will be fully photo-ionized (Kallman & McCray, 1982). If the companion star is a He white dwarf, the matter in the binary is He rich. In that case, O should be even more ionized because of the smaller number of electrons per nucleon.
Since the above estimation is only valid for optically thin plasma without an extra heat source, we ran the numerical simulation code, CLOUDY96b4 (Ferland, 2002) to estimate the O ionization state for more general cases. We approximated the radiation spectrum from 4U1820–303 with thermal bremsstrahlung of keV. We calculated for the parameter ranges: , cm, and K, assuming solar abundance. We also calculated for the cases where 90 % of the H atoms in the above absorption columns are converted to He atoms. We found from the simulation that the observed O VII and O VIII column densities are reproduced only when cm, , and K among all the combinations of parameters we tried. Thus the geometrical size of the plasma must be two orders of magnitude larger than the binary size. It is not likely that the plasma responsible for the absorption lines is related to the binary system. We thus consider it to be interstellar in the following discussion.
We can estimate the temperature of the hot medium from the ratio of O VII to O VIII column densities, assuming that these absorption lines arise from the same plasma in collisional ionization equilibrium. In reality, the hot medium may be multiple plasmas of different temperatures. Thus, the temperature needs be regarded as an ”average” defined by the O VII - O VIII ratio. In Figure 4 (a), the temperature is plotted as a function of . For the ionization fraction we used the table in Arnaud & Rothenflug (1985). As to the column density of O VII, we used the value from the combined and fit for , and the value from for others. The temperature is restricted to a relatively narrow range of . The temperature range is consistent with the previous temperatures estimated for the SXB emitting plasma (Kuntz & Snowden, 2000).
Given the temperature range, we can restrict the Ne to O abundance ratio by further assuming that the Ne is in collisional ionization equilibrium with O. We can also estimate the hydrogen column density of the hot plasma, (hot), assuming solar abundance (Anders & Grevesse, 1989) for O. In Figure 4 (b) and (c), we show the Ne/O abundance ratio in units of the solar ratio and (hot) as functions of . In panel (c), we indicated the neutral with a horizontal broken line. From these plots, we find that if , (hot) is comparable to or even larger than the of neutral medium and that the Ne/O abundance ratio must be significantly smaller than the solar value. Since both are unlikely, we can exclude small . Thus it is likely that , and we obtain the constraints: (hot) = 19.41 – 20.21, = 16.20 – 16.73, and . Dividing the column densities by the distance, we obtain the densities averaged over the volume of the column, and , respectively. The hot plasma is likely to have a patchy distribution. Thus the local densities are smaller than the volume average. The volume filling factor is estimated to be in the solar vicinity, although there are large uncertainties (Mathis, 2000) .
We did not detect an absorption line in Cyg X-2 in spite of the distance, , and the Galactic latitude which are all similar to those of 4U1820–303. Although the difference in the absorption line equivalent width between Cyg X-2 and 4U1820–303 is not statistically very significant because the upper limit of the O VII equivalent width of Cyg X-2 is higher than the lower boundary of the error domain of 4U1820–303, this may suggest that the average density of the hot plasma is lower for the line of sight of Cyg X-2. The SXB map observed with ROSAT shows enhancement in the circular region of radius centered on the Galactic center (Snowden et al., 1997). This may explain the higher absorption column density for 4U1820–303. In order to quantitatively compare our results with the SXB emission, we use the polytropic models of the hot gas constructed by Wang (1998) and Almy et al. (2000) which reproduce the all sky SXB map. They assumed nonrotating hot gas of polytropic index 5/3 in hydrostatic equilibrium with the Galactic potential (Wolfire et al., 1995). The model is described by two parameters, the normalization factor of the polytrope and the pressure at the Galactic center , or equivalently the temperature and electron density at the Galactic center. Almy et al. (2000) included an additional isotropic component in the model SXB map to explain the surface brightness at high latitudes (), but Wang (1998) did not. By fitting the ROSAT 3/4 keV all-sky map with the model, Almy et al. (2000) obtained and , which correspond to and . Using these parameter values, we can calculate the temperature and density of the polytrope plasma at a given location in the Galaxy. For example, at the solar neighborhood, and . Comparing these values with the model parameters by Wang (1998), and at the solar neighborhood, we consider there is at least a 30% uncertainty in the model density, and the uncertainty is partly related to the interpretation of the high latitude emission. We adopt parameters by Almy et al. (2000) in the following estimation.
The model predicts for 4U1820–303 and for Cyg X-2. However, assuming the solar abundance, the O VII column density towards 4U1820–303 is expected to be which is % smaller than that of Cyg X-2 (). This is because the temperature increases towards 4U1820–303 along the line of sight up to , while the O VII ionization fraction decreases very rapidly for and the temperature stays in the range of along the line of sight of Cyg X-2. We thus need to modify the model to explain the column densities. The ratio of O VII column densities in two different directions is dependent on but not on . Snowden et al. (1997) estimated the temperature of emission from the bulge region to be from the ratio of counts in the 3/4 keV and 1.5 keV bands. Thus it may be possible to reduce to this value. Of course, we need to increase at the same time in order to reproduce the SXB intensity. The ratio of O VII column densities to 4U1820–303 and to Cyg X-2 predicted by the polynomial model increases when is reduced from 6.9, and it is in the range of 1 – 2.2 for . Thus the model can be made consistent with the present observations. In this parameter range, the O VII density at the solar vicinity is higher than the average over the line of sight for 4U1820–303. The ratio of the two, i.e. is in the range for . Using , we can write from the observations. This is consistent with the previous estimate of the hot plasma density in the solar neighborhood (Snowden et al., 1990).
Now let us compare our results with the AGN absorption lines and the high latitude SXB emission lines. The column densities of O VII for 3C 273, Mkn 421, and PKS 2155-304 are respectively estimated to be in the ranges of 16.0 –16.4 , 15.7 – 15.9, 15.7 – 16.0 assuming the velocity dispersion of km/s and the equivalent widths from Rasmussen et al. (2003) (see Figure 2 (c)). Then, assuming a vertical exponential distribution and a midplane density at the solar vicinity as estimated above, the scale height is estimated to be kpc. This suggests that a significant portion of the O VII absorption observed in the AGN spectra is of Galactic origin. This scale height is consistent with the polytrope model, which predicts kpc at the solar neighborhood. Using the table in SPEX ver 1.10 (http://rhea.sron.nl/divisions/hea/spex), the intensity of OVII triplet lines in the direction of is estimated to be , where is the volume filling factor of the hot gas. This count rate is consistent with , as obtained by McCammon et al. (2002).
Our estimate for the vertical scale height of hot gas is a factor of smaller than the 140 kpc
estimated by Rasmussen et al. (2003).
The discrepancy is due to the difference in the abundance
(1 solar v.s. 0.3 solar),
the spatial distribution ( exponential v.s. uniform),
and the temperature ( 6.2 v.s. 6.4,
resulting in a difference in the line emissivity of a factor of about 4).
In conclusion, the highly ionized O and Ne absorption lines observed in 4U1820–303 are likely due to hot interstellar medium. The velocity dispersion is restricted to the range , and the temperature . The average densities along the line of sight are and , respectively. The higher O VII column density for 4U1820–303 than for Cyg X-2 may be connected to the enhancement of the SXB towards the Galactic bulge region. Using the polytrope model which reproduces the all-sky SXB map, we corrected for the density gradient along the line of sight and estimated the midplane O VII density at the solar neighborhood. Combining this value with the absorption lines observed in the AGN we estimated the vertical scale height of hot gas to be in the range, 2 – 20 kpc. The intensity of the high latitude SXB emission lines is consistent with these estimations. Thus we suggest that a significant fraction of both the AGN absorption lines and the SXB emission lines can be explained by hot gas in our Galaxy.
The present result demonstrates that the absorption lines of Galactic X-ray sources are a powerful tool for constraining the physical state of the hot interstellar medium. A search for absorption lines in other Galactic sources is urged to further constrain the plasma distribution. We consider that an observation of Cyg X-2 with a longer exposure time is particularly important.
References
- Almy et al. (2000) Almy, R.C., McCammon,D., Digel, S.W., Bronfman, L., and May, J. 2000 ApJ, 545, 290
- Anders & Grevesse (1989) Anders, E., & Grevesse, N. 1989, Geochim. Cosmochim. Acta., 53, 197
- Arnaud & Rothenflug (1985) Arnaud, M. & Rothenflug, R. 1985, A&AS, 60, 425
- Behar & Netzer (2002) Behar, E., & Netzer, H., 2002, ApJ, 570, 165
- Bohlin et al (1978) Bohlin, R.C., Savage, B.D., & Drake, J.F. 1978, ApJ, 224, 132
- Cen & Ostriker (1999) Cen, R. & Ostriker, J. 1999, ApJ, 514, 1
- Davé et al. (2001) Davé, R., Cen, R., Ostriker, J.P., Bryan, G.L., Hernquist, L., Katz, N., Weinberg, D.H., Norman, M.L., & O’Shea, B. 2001, ApJ, 552, 473
- Dickey & Lockman (1990) Dickey, J. M., & Lockman, F. J. 1990, ARA&A, 28, 215
- Fang et al. (2002) Fang, T., Marshall, H.L., Lee, J.C., Davis, D.S., & Canizares, C.R., 2002, ApJ, 572, L127
- Ferland (2002) Ferland, G.J. 2002, Hazy, a Brief Introduction to Cloudy, University of Kentucky, Department of Physics and Astronomy, Internal Report.
- Jenkins (1978) Jenkins, E.B. (1978), ApJ, 219,845
- Kallman & McCray (1982) Kallman, R., & McCray, R. 1982, ApJS, 50, 263
- Kotani et al. (2000) Kotani, T., Ebisawa, K. Dotani, T., Inoue, H. Nagase, F., and Tanaka, Y. 2000, ApJ, 539, 413
- Kuntz & Snowden (2000) Kuntz, K.D. and Snowden, S.L. 2000, ApJ, 543, 195
- Kuulkers et al. (2003) Kuulkers, E., den Hartog, P.R. in’tZand, J.J.M., Verbunt, F.W.M., Harris,W.E., & Cocchi, M. 2003, A&A, 399, 663
- Mathis (2000) Mathis, J. S. 2000, in “Allens’ Astrophysical Quantities, forth edition”, p525, ed. by N. Cox, AIP and Springer-Verlag.
- McCammon et al. (2002) McCammon, D. et al. 2002, ApJ, 578, 188
- Nicastro et al. (1999) Nicastro, F., Fiore, F., & MATT, G. 1999, ApJ, 517, 108
- Nicastro et al. (2002) Nicastro, F., Zezas, A., Drake, J., Elvis, M., Fiore, F., Fruscione, A., Marengo, M., Mathur, S., & Bianchi, S. 2002, ApJ, 573, 157
- Paerels et al. (2001) Paerels, F., et al. 2001, ApJ, 546, 338
- Park et al. (1998) Park, S., Finley, J.P, & Dame, T.M. 1998, ApJ, 509, 203
- Rasmussen et al. (2003) Rasmussen, A., Kahn, S.M., & Paerels, F. 2003, astroph/0301183
- Richtler et al. (1994) Richtler, T., Grebel, E.K. & Saggewiss, W. 1994, A&A, 290, 412
- Savage et al. (2003) Savage, B.D., Sembach, K.R., Wakker, B.P., Richter, P., Meade, M., Jenkins, E.B., Shull, J.M., Moos, H.W., and Sonneborn, G. 2003, ApJS, 146, 125
- Snowden et al. (1990) Snowden, S.L, Cox, D.P., McCammon,D., and Sanders, W.T. 1990, ApJ, 354, 211
- Snowden et al. (1997) Snowden, S.L, Egger, R., Freyberg, M.J., McCammon, D., Plucinsky, P.P, and Sanders, W.T. 1997, ApJ, 485, 125
- Stella, Priedhorsky, and White (1987) Stella, L., Priedhorsky, W., and White, N.E. 1987, ApJ, 312, L17
- Takei et al. (2002) Takei,Y., Fujimoto, R., Mitsuda,K., & Onaka,T. 2002, ApJ, 581, 307
- Tanaka & Bleeker (1977) Tanaka,Y. & Bleeker,J. 1977. Sp.Sci.Rev., 20, 815
- Verner et al. (1996) Verner, D.A, Verner, E.M., and Ferland, G.J. 1996, Atomic Data and Nuclear Data Tables, 64, 1.
- Wang (1998) Wang, Q.D. 1998, Lecture Notes in Physics, 506, 503.
- Wilms et al. (2000) Wilms, J., Allen, A., & McCray, R. 2000, ApJ, 542, 914
- Wolfire et al. (1995) Wolfire, M.G., McKee, C.F., Hoolenbach, D., & Tielens, A.G.G. 1995, ApJ, 453, 673