Hints of star formation at : the chemical abundances of the DLA system in the QSO BRI 1202-0725 ()††thanks: Based on material collected with the European Southern Observatory Very Large Telescope operated on Cerro Paranal (Chile). Proposal 66.A-0594(A)
The Damped Ly- (DLA) absorber at redshift observed toward QSO BRI 1202-0725 is studied by means of high resolution (FWHM km s-1) VLT-UVES spectra. We refine a previously determined Si abundance and derive with confidence abundances for C, N and O which are poorly known in DLAs. The [O/Fe] ratio is , but we cannot establish if iron is partially locked into dust grains. The [C/Fe] and [Si/C] . [N/O] and [N/Si] are about , which is consistent with the majority of DLAs. This value is much larger than the one observed for the DLA toward QSO J 0307-4945 at . The current interpretation of the bimodal distribution of N abundances in DLAs implies that large [N/] values correspond to relatively old systems. Adopting a scale time of 500 Myrs for full N production by intermediate mass stars, the onset of star formation in our DLA took place already at redshift .
Key Words.:
Galaxies: abundances – Galaxies: high-redshift – quasars: absorption lines – cosmology: observations1 Introduction
Observational evidence of early star formation is increasing thanks mainly to metal abundance analysis of QSOs found in the large sky surveys. Fe/Mg abundance ratios near or possibly even above solar were measured from the emission lines of QSO spectra (Freudling et al. 2003; Maiolino et al. 2003). Assuming this iron excess is a signature of SNIa production, a major episode of star formation must have taken place in these quasar hosts at to give birth to the progenitor stars.
At the same time, results from the WMAP satellite favoured an early reionization epoch of the intergalactic medium, possibly in the interval (Bennett et al. 2003; Kogut et al. 2003), requiring the existence of Population III stars at very high redshifts (e.g. Cen 2003; Ciardi et al. 2003). The nature of these early stars may be investigated through the relic metals they left in the intergalactic medium, provided the gas was not reprocessed by the subsequent generation of stars.
A remarkably precise way of measuring the elemental abundances of the gas up to very high redshifts is represented by damped Lyman- absorption (DLA) systems observed in the spectra of quasars. Indeed, their characteristic large H i column density (H i cm-2) assures that ionization corrections can be neglected and very high resolution spectra now available to the community allow excellent determinations of the associated ionic column densities.
In this paper we present VLT-UVES observations of the QSO BRI 1202-0725 ( = 4.69, McMahon et al. 1994) whose spectrum shows a DLA at =4.383, detected for the first time by Giallongo et al. (1994), which is one of the few highest-redshift DLA known (Songaila & Cowie 2002). High resolution Keck observations of this QSO (FWHM = 6.6 km s-1, Å) were presented by Lu et al. (1996, 1998). Lower resolution spectra were obtained by Wampler et al. (1996) and Songaila & Cowie (2002) with NTT-EMMI and Keck-ESI respectively. Fontana et al. (1996) did multi-band deep imaging of the quasar field and reported the detection of a galaxy at a separation of 2.2 arcsec from the QSO line of sight that could be responsible for the DLA system. Follow-up spectroscopy of the object clarified instead that the galaxy was at the redshift of the QSO (Petitjean et al. 1996; Fontana et al. 1998).
Many studies were dedicated to this quasar which has been thoroughly investigated both in the optical and in the FIR and submillimeter bands, in particular for the presence of strong associated molecular emission lines (e.g. Ohta et al. 1998, and references therein).
The paper structure is the following: Section 2 gives details about the observations and the reduction process; in Section 3 we present the analysis of the spectrum and the column densities derived for the metal ions associated with the DLA system. Section 4 is dedicated to the obtained abundance ratios, in particular of carbon, oxygen and silicon, and how they relate to observations in other DLAs. In Section 5 we focus on nitrogen and we discuss its abundance in the framework of the present production models.
Throughout the paper we will adopt the usual cosmological model with H km s-1 Mpc-1, and .
2 Observations and data reduction
In February and March 2001, high resolution spectra of the QSO BRI 1202-0725 were obtained in service mode with the UV and Visual Echelle Spectrograph (UVES, Dekker et al. 2000) mounted on the Kueyen telescope of the ESO VLT (Cerro Paranal, Chile). The journal of observations is reported in Table 1.
| date | texp | No | Coverage | S/N |
|---|---|---|---|---|
| d/m/y | (h) | Å | ||
| 3,5-7,14/2/2001 | 11 | 7 | 3050-3870 | |
| 7 | 4780-5760; 5843-6814 | 45-20 | ||
| 18,19/3/2001 | 3 | 2 | 3740-4983 | |
| 2 | 6714-8529; 8677-10000 | 30-15 |
In the third column we give the number of single frames
Spectra were taken in dichroic mode with a slit of 1.0” and binning of 2x2 pixels. The overall resolution is (FWHM km s-1). The wavelength coverage and the signal-to-noise ratios are reported in Table 1. The Lyman edge of the DLA at absorbs completely the spectrum shortwards of Å.
Data reduction was carried out by using the specific UVES pipeline (see Ballester et al. 2000) in the framework of the 99NOV version of the ESO reduction package, MIDAS. The final spectrum was obtained as a rebinned weighted sum of the single spectra output by the pipeline. The level of the continuum was determined by manually selecting regions not affected by evident absorption and by interpolating them with a spline function of 3rd degree.
3 Analysis
Atomic parameters for the identification and fitting of the lines are taken from Morton (1991). New oscillator strengths are adopted for Si ii and 1526 (Spitzer & Fitzpatrick 1993) and Fe iii (Morton 2002 unpublished, J. X. Prochaska private communication). Lines are fitted with Voigt profiles in the LYMAN context of the MIDAS reduction package (Fontana & Ballester 1995).
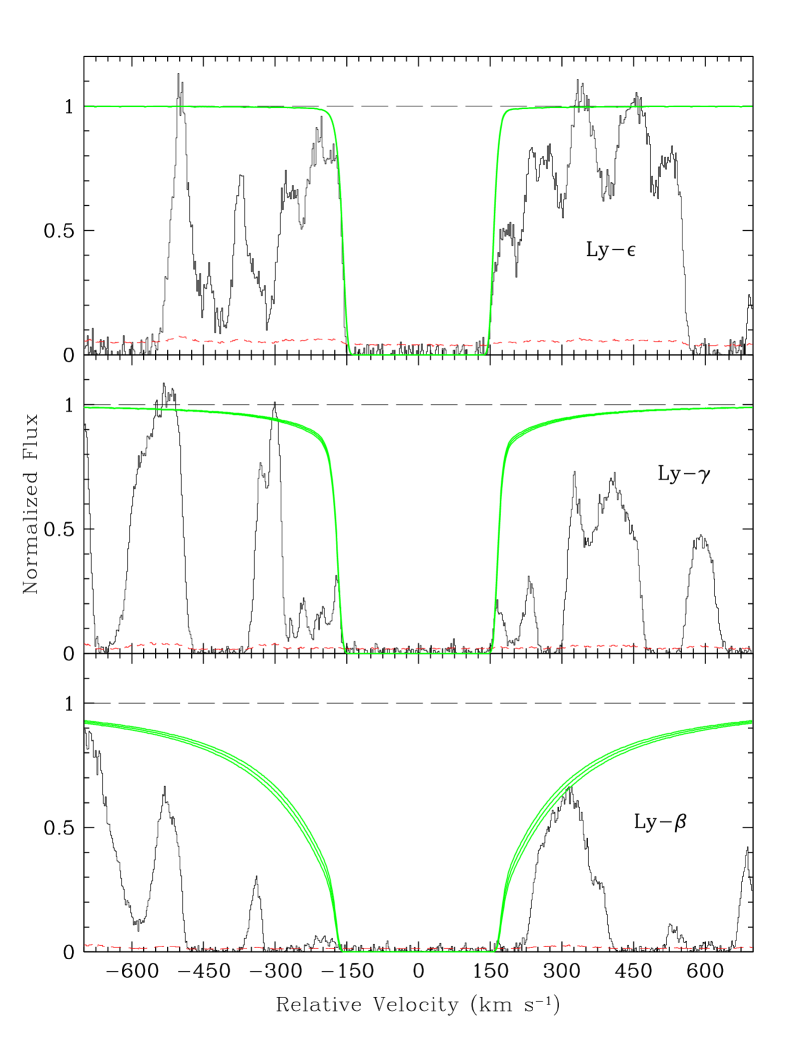
Due to the lack of the fainter lines of the Lyman series it was not possible to disentangle the velocity structure of the H i absorption lines. Thus, to determine the total H i column density we assumed a single component at the average redshift of the strongest low ionization absorption features (). As a reference for the fit we took the blue wing of the Ly- damped profile which is less contaminated by other absorptions (see Fig. 1 of Lu et al. 1996) and we cared for having simultaneous agreement between the lines of the Lyman series which were not strongly blended: Ly- , Ly-, Ly- and Ly-. We fitted the minimum and the maximum column densities consistent with the 4 velocity profiles and we took the mean of the two as the reference column density. The error is computed as 1/3 of the difference between the maximum and the minimum column density (see Fig. 1). The result is H i which slightly improves the former measure by Lu et al. (1996), H i.
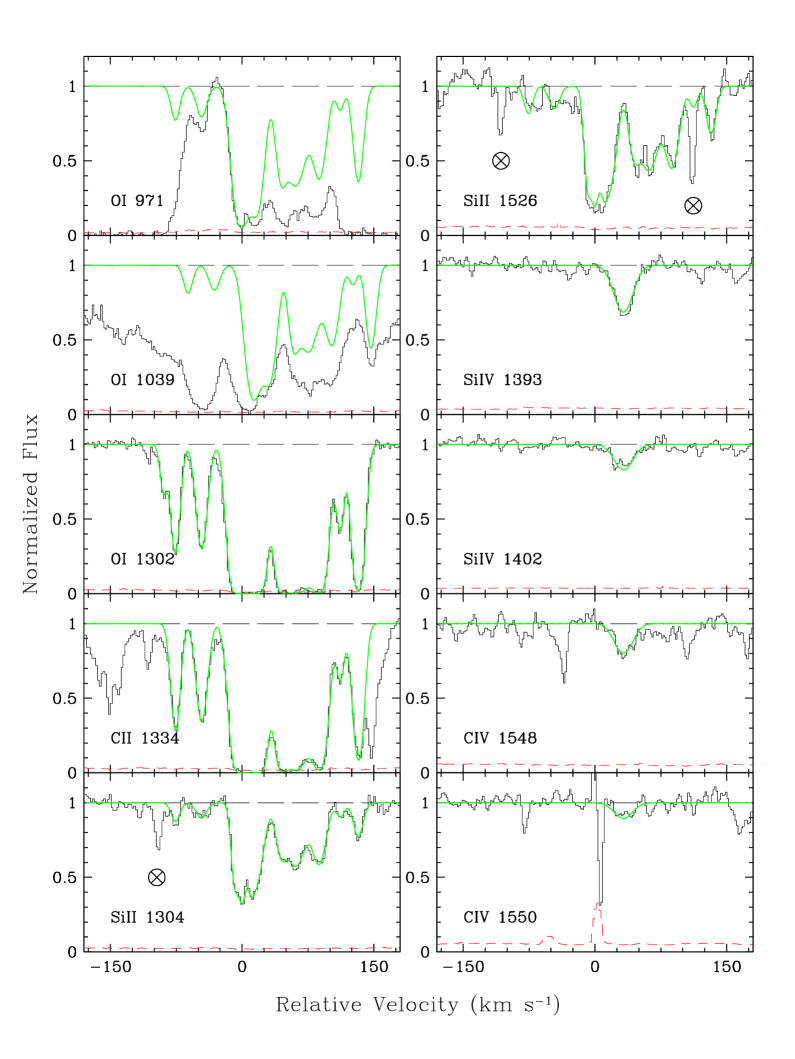
Outside the Ly- forest, we detected the following metal absorption lines: O i , Si ii , C ii , Si iv , C iv and Al ii blended with telluric lines. Unfortunately, the absorption corresponding to Fe ii falls into one of the two gaps of the spectrum.
| 4.381440 | |||
| 4.381969 | |||
| 4.382644 | |||
| 4.382805 | |||
| 4.382973 | |||
| 4.383096 | |||
| 4.383587 | |||
| 4.383901 | |||
| 4.384376 | |||
| 4.384813 | |||
| 4.385181 |
3.1 Low-ionization lines
The common velocity profile of low ionization transitions was well determined from the Si ii lines and fitted with 11 components (see Table 2).
O i is saturated as in most DLAs. We looked for fainter oxygen lines in the Ly- forest, namely O i , 948, 950, 971, 976, 988, 1025, 1026 and 1039. Although the majority of them was lost in the wealth of Ly- lines, we could set an upper and a lower limit to the O i total column density, O i, by constraining the strongest components with the partially blended transitions O i and 1039 and adopting the redshifts and the Doppler parameters of Si ii. The latter assumption is based on the concordance among the redshifts and the Doppler parameters of the non-saturated components of O i with those of Si ii. The final column density is: O i.
The central components of the C ii absorption feature are also saturated. In order to get an estimate of the C column density, we have followed the same strategy adopted for oxygen relying on the partially blended C ii absorption detected in the Ly- forest. We assumed the parameters of Si ii which is a good tracer of C ii (Levshakov et al. 2002). We obtained a minimum and a maximum column density consistent with the two profiles: C ii, providing C ii.
For the iron-peak elements we could only put an upper limit to the column density of Ni ii Å, Ni ii.
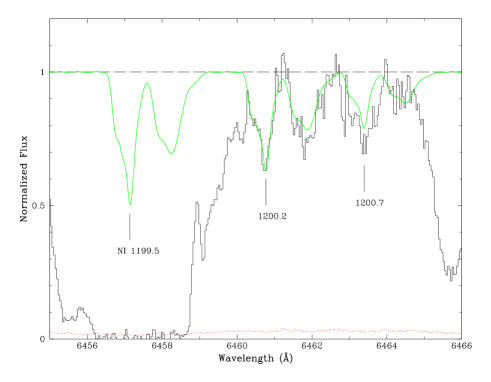
Inside the Ly- forest, we detected the lines and 1200.7 Å of the N i triplet apparently free from blending (see Fig. 3). We fitted them with the central stronger components detected in Si ii and obtained a column density which is in agreement with the limit given by Lu et al. (1998). The weaker N i triplet is lost in the forest, as are the absorption lines corresponding to S ii , and Ar i .
| Ion | log N (X) | [X/H]a | |
|---|---|---|---|
| H i | 1215 | 20.55 0.03 | |
| C ii | 1334 | 15.13 0.05 | -2.01 0.06 |
| C iv | 1548 | 12.86 0.04 | |
| 1550 | |||
| N i | 1200.2 | 13.81 0.05 | -2.67 0.06 |
| 1200.7 | |||
| O i | 1302 | 15.75 0.06 | -1.54 0.07 |
| 1039 | |||
| 971 | |||
| Si ii | 1304 | 14.39 0.05 | -1.70 0.06 |
| 1526 | |||
| Si iv | 1393 | 12.71 0.02 | |
| 1402 | |||
| Fe iii | 1122 | 12.83 0.09 | |
| Ni ii | 1317 | 12.5 | -2.3 |
| 1370 |
3.2 High-ionization lines
We detected weak, single component C iv and Si iv doublets at a velocity corresponding to a minimum in the low ion absorption profile. At the same redshift we detected in the Ly- forest a weak absorption line, possibly corresponding to Fe iii whose fit gives: Fe iii. The equivalent width of C iv is Å, while that of Si iv is Å. They are comparable with those of Ly- clouds with much smaller H i column densities (Songaila 2001; Pettini et al. 2003).
The weakness and the central position of the high ions with respect to the low ions in this system are peculiar if compared with other DLAs. In the sample of 33 DLAs with high ions compiled by Wolfe & Prochaska (2000a), only BRI 1202-0725 and Q2237-0608 show C iv spanning a velocity range smaller than that of low ions, they are also the only objects in the sample with redshift larger than 4. A possible dependence on redshift of the relative kinematics is also drawn from the result by Ledoux et al. (1998) who found a trend of decreasing C iv to O i velocity broadening ratio with increasing redshift for a sample of 26 DLA systems. On the other hand, the DLA at in the spectrum of BR J0307-4945 shows C iv and Si iv more extended than the low ions although not very strong (Dessauges-Zavadsky et al. 2001). The kinematics observed in BRI 1202-0725 and Q2237-0608 do not seem to be compatible either with the model of a rotating disk with infalling material (Wolfe & Prochaska 2000b) or with rotating protogalactic clumps (Haehnelt et al. 1998). We speculate that at large redshifts DLAs could probe objects kinematically less disturbed than those at lower redshifts. More systems are needed to confirm this trend with redshift and to draw a reliable scenario.
Lu et al. (1996) explained the weakness of the high ion absorptions associated with this DLA as due to a decrease with redshift of the metal enrichment in galactic disk and halo gas and/or to the decrease of the mean intensity of the UV ionizing background. Since the gas giving rise to the low ions shows a considerable amount of carbon (see next section), if the slab of ionized material is somewhat associated with the bulk of DLA gas we cannot invoke a deficit in carbon to explain the weakness of C iv. On the other hand, the ratio of Si iv over C iv equivalent width is greater than 1, which suggests an ionization by a softer UV spectrum than at lower redshifts, as expected from the evolution of the ionizing UV background (e.g. Haehnelt et al. 2001).
4 Metallicity and relative abundances
Lu et al. (1996) measured a Fe ii column density , giving [Fe/H]111Using the customary definition [X/Y] = log(X/Y) - log(X/Y)☉. , when the revised photospheric solar abundances by Holweger (2001) are adopted. A more recent determination is reported by Songaila & Cowie (2002), Fe ii, which gives [Fe/H] . In the following, we will adopt the weighted mean of the two determinations: Fe ii and [Fe/H] . In the presence of dust, iron is partially locked in the grains and a better estimator of metallicity is the non-refractory element zinc. In the case of our absorption system the two transitions Zn ii Å cannot be observed because they fall into the near-IR region.
The limit on nickel abundance, [Ni/Fe] , might strengthen the trend of decreasing nickel over iron ratio in low [Fe/H] DLAs, while the unweighted mean of all DLA measurements is slightly over solar (Prochaska & Wolfe 2002). This observational behaviour has not yet been understood and the nickel depletion onto dust is unknown (see also Dessauges-Zavadsky et al. 2001).
We were able to measure the abundances of carbon, nitrogen and oxygen, a rare event in DLAs. The transitions O i and C ii are in fact almost always saturated, while the N i lines are often blended in the Ly- forest.
4.1 Carbon
In the survey by Prochaska & Wolfe (2002) there are 14 lower limits of C abundances, all obtained from the saturated C ii Å line. Levshakov et al. (2002) and Lopez et al. (2002) claimed C measurements with reasonable error. They accounted for the saturation of the C ii lines through detailed modelling of the velocity structures and measured [C/Zn] . Also in the sample of sub-DLA systems collected by Péroux et al. (2003), where C measurements are easier, the [C/Fe] ratios are solar or slightly over-solar.
We found [C/H] , which gives a carbon over iron ratio consistent with solar, or under-solar if iron is affected by dust depletion. Molaro (2003) measured an even lower value, [C/Fe] , for a DLA with non-saturated C at towards SDSS 1044-0125. More carbon measurements are needed at large redshifts, maybe using sub-DLAs, to verify if, at variance with what is observed for the intergalactic medium (Pettini et al. 2003), the C abundance decreases with increasing redshift in denser absorbers. This would give interesting hints on the enrichment history of the universe and on the escape fraction of metals from collapsed or collapsing systems.
4.2 Oxygen and silicon
Silicon is commonly measured in DLAs, while only a dozen of systems with some information on the oxygen abundance are presently available.
We measured: [O/H] , [Si/H] and [O/Fe] , [Si/Fe] . The above /iron abundance ratios are in line with the average values observed in most DLAs (Prochaska & Wolfe 2002; Molaro 2003). We cannot state whether the observed values are due entirely to -element enhancement or if iron is partially depleted on dust grains (also silicon is mildly refractory). There are several reasons to favour the latter hypothesis: the observed metal column density measured by the non-refractory element zinc, and the abundance ratio [Fe/Zn] in DLA systems are anticorrelated (Hou et al. 2001), while the observed [Si/Fe] and [Zn/Fe] DLA abundance ratios are correlated (Prochaska & Wolfe 2002). These trends are expected if iron is affected by dust depletion. Once corrected for dust, the Si/Fe enhancement at [Fe/H] is typically [Si/Fe] instead of as observed (Vladilo 2002) and, considering 26 DLAs where both Si and the non-refractory element Zn were measured, the average value is [Si/Zn], consistent with moderate, if any, enhancement. In the three systems for which O and Zn are measured no genuine enhancement can be claimed with certainty (Molaro et al. 2000; Lopez et al. 2002; Ledoux et al. 2003).
To conclude the review of the detected elements, we found nitrogen much below the other elemental abundances at [N/H] , in agreement with the upper limit set by Lu et al. (1998). The abundance ratios to the observed -elements are: [N/Si] and [N/O] . In the next section we will discuss the outcomes of these results.
5 Nitrogen and the epoch of star formation
The production of nitrogen at very low metallicities is still a debated subject. Theoretically, it is assessed that primary N is created in the thermal pulses of AGB stars undergoing hot bottom burning, namely the intermediate-mass stars (4 to 7 M⊙).
DLAs proved to be very useful to measure N abundances at metallicities lower than starburst galaxies. They populate a plateau at [N/] extending over two orders of magnitude in oxygen abundance.
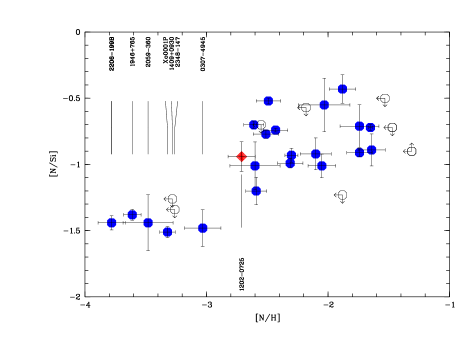
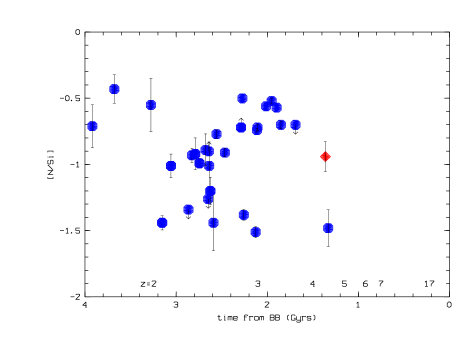
A few DLAs were found to form a possible second plateau with very little internal scatter at [N/] values about 0.7 dex below the main plateau (Prochaska et al. 2002; Centurión et al. 2003). Figure 4 reports all the available measurements including the revised value for QSO 2206-199 by Molaro et al. (2003), the weighted mean in the low plateau is [N/Si] = .
Low [N/] values are expected in relatively young objects where intermediate-mass stars did not yet have time to evolve and to contribute to the nitrogen enrichment, while the short lived massive stars have already produced their oxygen. The low plateau has been interpreted as due to the effect of top-heavy initial mass function in these clouds (Prochaska et al. 2002) or to N synthesis by the same massive stars which produce the oxygen (Molaro 2003). Within the latter scheme we expect to find high/low [N/Si] values in relatively old/young objects respectively. Here, old and young refers to the characteristic timescale of the main N production by intermediate-mass stars, which can be of the order of 250-500 Myrs (Henry et al. 2000), or longer if rotation plays an important role (Meynet & Maeder 2002). As a consequence, all 7 objects with low [N/Si] abundance shown in Fig. 5 are young independently from their redshift, implying a continuos formation of DLA absorbers at all epochs.
The DLA system we have analised in this paper and the one along the line-of-sight to J 0307-4945 (, Dessauges-Zavadsky et al. 2001) are the two highest redshift DLAs for which N has been measured. The two systems have similar nitrogen abundances but show remarkably different nitrogen over abundances. The DLA in J 0307-4945 is positioned at the high N end of the low plateau, while our DLA falls in the low N end of the upper plateau (see Fig.4), as if it had just made the jump, enriched by the N production of intermediate-mass stars.
The highest redshift system is also the youngest, according to the interpretation of the N abundance, but it shows O abundance similar to our DLA. The observed pattern suggests that the system under study is older but had a lower star formation rate (SFR) generating a smaller amount of oxygen. Then nitrogen might be considered a more reliable age indicator than oxygen, since the production of the latter is more dependent on the SFR. If, according to the chemical evolution models of Henry et al. (2000) with low SFR, the time to attain the upper plateau level is of the order of 500 Myrs, the onset of star formation in the studied protogalaxy is placed at redshift higher than 6.
This measure provides additional evidence of early star formation. More refined theoretical models for the production of nitrogen and more nitrogen detections in very high redshift DLAs will allow us to get closer and closer to the epochs of formation of the very first stars predicted by the satellite WMAP at (Bennett et al. 2003).
Acknowledgements.
We wish to thank our collaborators P. Bonifacio, M. Centuriòn, C. Pèroux and G. Vladilo for valuable discussion on this topic.References
- Ballester et al. (2000) Ballester, P., Modigliani, A., Boitquin, O., et al. 2000, ESO The Messenger, 101, 31
- Bennett et al. (2003) Bennett, C. L., Halpern, M., Hinshaw, G., et al. 2003, ApJS, 148, 1
- Cayrel et al. (2003) Cayrel, R., Depagne, E., Spite, M., et al. 2003, A&A, accepted
- Cen (2003) Cen, R. 2003, ApJL, 591, L5
- Centurión et al. (2003) Centurión, M., Molaro, P., Vladilo, G., et al. 2003, A&A, 403, 55
- Ciardi et al. (2003) Ciardi, B., Ferrara, A., White, S. D. M. 2003, MNRAS, 344, L7
- Dekker et al. (2000) Dekker, H., D’Odorico, S., Kaufer, A. et al. 2000, in Iye, M. and Moorwood, A. F. (eds), Optical and IR Telescope Instrumentation and Detectors, Proc. SPIE, 4008, p. 534-545
- Dessauges-Zavadsky et al. (2001) Dessauges-Zavadsky, M., D’Odorico, S., McMahon, R. G., et al. 2001, A&A, 370, 426
- Fontana & Ballester (1995) Fontana, A., & Ballester, P. 1995, ESO The Messenger, 80, 37
- Fontana et al. (1996) Fontana, A., Cristiani, S., D’Odorico, S., Giallongo, E., Savaglio, S. 1996, MNRAS, 279, L27
- Fontana et al. (1998) Fontana, A., D’Odorico, S., Giallongo, E., et al. 1998, AJ, 115, 1225
- Freudling et al. (2003) Freudling, W., Corbin, M. R., Korista, K. T. 2003, ApJ, 587, L67
- Giallongo et al. (1994) Giallongo, E., D’Odorico, S., Fontana, A., et al. 1994, ApJ, 425, L1
- Grevesse & Sauval (1998) Grevesse, N., and Sauval, A. J. 1998, Space Sci. Rev., 85, 161
- Haehnelt et al. (2001) Haehnelt, M. G., Madau, P., Kudritzki, R., Haardt, F. 2001 ApJ, 549, L151
- Haehnelt et al. (1998) Haehnelt, M. G., Steinmetz, M., Rauch, M. 1998, ApJ, 495, 647
- Heger & Woosley (2002) Heger, A. & Woosley, S. E. 2002, ApJ, 567, 532
- Henry et al. (2000) Henry, R. B. C., Edmunds, M. G., Köppen, J. 2000, ApJ, 541, 660
- Holweger (2001) Holweger, H. 2001, in Wimmer-Schweingruber, R. F. (ed), Solar and Galactic Composition, American Institute of Physics Conference proc., 598, 23
- Hou et al. (2001) Hou, J. L., Boissier, S., Prantzos, N. 2001, A&A, 370, 23
- Kogut et al. (2003) Kogut, A., Spergel, D. N., Barnes C., et al. 2003, ApJS, 148, 161
- Ledoux et al. (2003) Ledoux, C., Petitjean, P., Srianand, R. 2003, MNRAS in press, astro-ph/0302582
- Ledoux et al. (1998) Ledoux, C., Petitjean, P., Bergeron, J., Wampler, E. J., Srianand, R. 1998, A&A, 337, 51
- Levshakov et al. (2002) Levshakov, S. A., Dessauges-Zavadsky, M., D’Odorico, S., and Molaro, P. 2002 ApJ, 565, 696
- Lopez et al. (2002) Lopez, S., Reimers, D., D’Odorico, S., Prochaska, J. X. 2002, A&A, 385, 778
- Lu et al. (1998) Lu, L., Sargent, W. L. W., Barlow, T. A. 1998, AJ, 115, 55
- Lu et al. (1996) Lu, L., Sargent, W. L. W., Barlow, T. A., Churchill, C. W., Vogt, S. S. 1996, ApJS, 107, 475
- Maiolino et al. (2003) Maiolino, R., Juarez, Y., Mujica, R., Nagar, N. M., Oliva, E. 2003, ApJL in press, astro-ph/0307264
- Meynet & Maeder (2002) Meynet, G. & Maeder, A. 2002, A&A, 390, 561
- McMahon et al. (1994) McMahon, R. G., Omont, A., Bergeron, J., et al. 1994, MNRAS, 267, L9
- Molaro (2003) Molaro, P. 2003, in Charbonnel, C., Schaerer D., & Meynet, G. (eds), CNO in the Universe, ASP Conference Series in press, astro-ph/0301407
- Molaro et al. (2003) Molaro, P., Centurión, M., D’Odorico, V., Péroux, C. 2003, in McWilliam, A. & Rauch, M. (eds), Origin and Evolution of the Elements, 2003, Carnegie Observatories Astrophysics Series, Vol. 4 in press, astro-ph/0307173
- Molaro et al. (2000) Molaro, P., Bonifacio, P., Centurión, M., et al. 2000, ApJ, 549, 90
- Morton (1991) Morton, D. C. 1991, ApJS, 77, 119
- Ohta et al. (1998) Ohta, K., Nakanishi, K., Akiyama, M., et al. 1998 PASJ, 50, 303
- Péroux et al. (2003) Péroux, C., Dessauges-Zavadsky, M., D’Odorico, S., Kim, T.-S., McMahon, R. G. 2003, MNRAS, 345, 480
- Petitjean et al. (1996) Petitjean, P., Pécontal, E., Valls-Gabaud, D., Charlot, S. 1996, Nature, 380, 411
- Pettini et al. (2003) Pettini, M., Madau, P., Bolte, M., et al. 2003 ApJ, 594, 695
- Prochaska & Wolfe (2002) Prochaska, J. X, & Wolfe, A. M. 2002 ApJ, 566, 68
- Prochaska et al. (2002) Prochaska, J. X, Henry, R. B. C., O’Meara, J. M., et al. 2002, PASP, 114, 933
- Songaila (2001) Songaila, A. 2001, ApJ, 561, L153
- Songaila & Cowie (2002) Songaila, A. & Cowie, L. L. 2002, AJ, 123, 2183
- Spitzer & Fitzpatrick (1993) Spitzer, L. Jr., Fitzpatrick, E. L. 1993, ApJ, 409, 299
- Umeda & Nomoto (2003) Umeda, H. & Nomoto, K. 2003 Nat, 422, 871
- Vladilo (2002) Vladilo, G. 2002, A&A, 391, 407
- Wampler et al. (1996) Wampler, E. J., Williger, G. M., Baldwin, et al. 1996, A&A, 316, 33
- Wolfe & Prochaska (2000a) Wolfe, A. M. & Prochaska, J. X. 2000a ApJ, 545, 591
- Wolfe & Prochaska (2000b) Wolfe, A. M. & Prochaska, J. X. 2000b ApJ, 545, 603