Constraints on SN Ia Progenitors and ICM enrichment from field and cluster SN rates
Abstract
The iron mass in galaxy clusters is about 6 times larger than could have been produced by core-collapse SNe, assuming the stars in cluster galaxies formed with a standard IMF. Type-Ia SNe have been proposed as the alternative dominant iron source. We use our HST measurements of the cluster SN-Ia rate at high redshift to study the cluster iron enrichment scenario. The measurements can constrain the star-formation epoch and the SN-Ia progenitor models via the mean delay time between the formation of a stellar population and the explosion of some of its members as SNe-Ia. The low observed rate of cluster SNe-Ia at pushes back the star-formation epoch in clusters to , and implies a short delay time. We also show a related analysis for high- field SNe which implies, under some conditions, a long SN-Ia delay time. Thus, cluster enrichment by core-collapse SNe from a top-heavy IMF may remain the only viable option.
1 The SN Ia Rate in Galaxy Clusters and the Source of Cluster Iron
The iron mass in galaxy clusters is about 6 times larger than could have been produced by core-collapse supernovae (SNe), assuming the stars in the cluster formed with a standard initial mass function (IMF; e.g., Renzini 1997). SNe Ia have been proposed as the alternative dominant iron source. Different SN Ia progenitor models predict different “delay functions”, between the formation of a stellar population and the explosion of some of its members as SNe Ia. We use updated measurements of the total iron mass-to-light ratio in rich clusters to normalize the predicted SN Ia rate in clusters vs. redshift, using the delay function parameterization of Madau, Della Valle, & Panagia (1998). We then use our previous measurements of the cluster SN Ia rate at high redshift (Gal-Yam, Maoz, & Sharon 2002) to constrain SN Ia progenitor models and the star-formation epoch in clusters. The low observed rate of cluster SNe Ia at (Fig. 1) means that, if SNe Ia produced the observed amount of iron, they must have exploded at even higher . This puts a upper limit on the mean SN Ia delay time of Gyr ( Gyr) if the stars in clusters formed at (), assuming km s-1 Mpc-1 (see Maoz & Gal-yam 2003 for full details). In the next section, we show that, for some current versions of cosmic (field) star formation history (SFH), observations of field SNe Ia place a lower bound on the delay time, Gyr. If these SFHs are confirmed, the entire range of will be ruled out. Cluster enrichment by core-collapse SNe from a top-heavy IMF will then remain the only viable option.

2 The Redshift Distribution of Field SNe Ia: Constraints on Progenitors and Cosmic Star Formation History
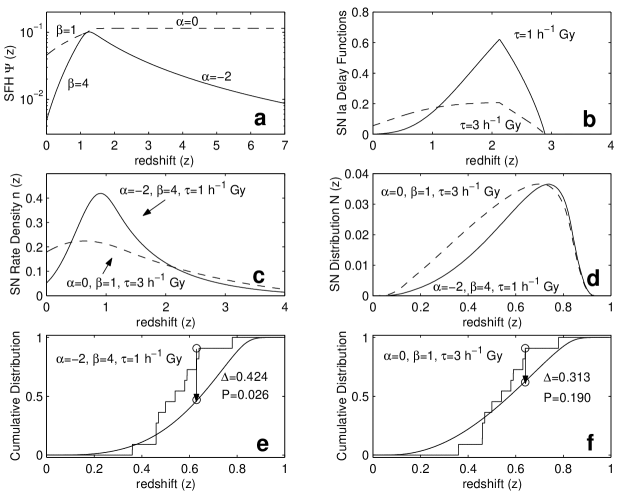
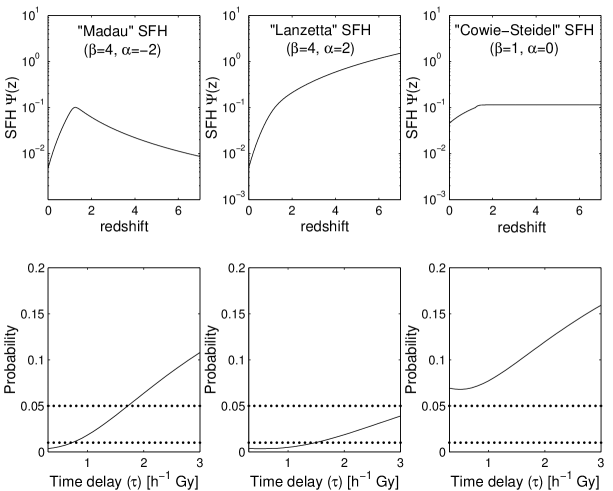
In this section, we use the redshift distribution of SNe Ia discovered by the Supernova Cosmology Project (Pain et al. 2002) to constrain the star formation history (SFH) of the Universe and SN Ia progenitor models. Fig. 2 illustrates how, for a given choice of parameters describing the SFH and SN Ia delay time, we predict the observed cumulative (i.e., unbinned) redshift distribution in a given survey, and compare it to the data. Given some of the recent determinations of the SFH, the observed SN Ia redshift distribution indicates a long ( Gyr) mean delay time between the formation of a stellar population and the explosion of some of its members as SNe Ia (Fig. 3). For example, if the Madau et al. (1998) SFH is assumed, the delay time is constrained to be Gyr at the confidence level (CL). SFHs that rise at high redshift, similar to those advocated by Lanzetta et al. (2002), are inconsistent with the data at the CL unless Gyr. Long time delays disfavor progenitor models such as edge-lit detonation of a white dwarf accreting from a giant donor, and the carbon core ignition of a white dwarf passing the Chandrasekhar mass due to accretion from a subgiant (e.g., Yungelson & Livio 2000). The SN Ia delay may be shorter, thereby relaxing some of these constraints, if the field star formation rate falls, between and the present, less sharply than implied, e.g., by the original Madau plot. The discovery of larger samples of high- SNe Ia by forthcoming observational projects should yield strong constraints on the progenitor models and the SFH (see Gal-Yam & Maoz 2003 for full details). In the previous section we have demonstrated that if SNe Ia produce most of the iron in galaxy clusters, and the stars in clusters formed at , the SN Ia delay time must be lower than Gyr. If so, then the Lanzetta et al. (2002) SFH is inconsistent with the data presented here (Figure 3).
3 Conclusions
The large mass of iron in clusters, combined with the low SN Ia rate we have measured in clusters, require that, if SNe Ia are the dominant iron source, their delay time must be short. This would cast doubt, e.g., on the double degenerate models. The observed redshift distribution of field SNe Ia implies a slowly changing field SNR(z) for SNe Ia. For several popular star-formation histories, this then indicates a long delay time. Taken together, these constraints may suggest that the iron in clusters is from core-collapse SNe, from an early stellar population with a top-heavy IMF.
References
- (1) L. L. Cowie, A. Songaila, & A. J. Barger: AJ 118, 603 (1999)
- (2) A. Gal-Yam, D. Maoz, & K. Sharon: MNRAS 332, 37 (2002)
- (3) A. Gal-Yam & D. Maoz: MNRAS, Submitted (2003)
- (4) K. M. Lanzetta, et al.: ApJ 570, 492 (2002)
- (5) D. Maoz, & A. Gal-Yam: MNRAS, Submitted (2003)
- (6) P. Madau, M. Della Valle, & N. Panagia: MNRAS 297, L17 (1998)
- (7) P. Madau, et al.: MNRAS 283, 1388 (1998)
- (8) R. Pain, et al.: ApJ 577, 120 (2002)
- (9) D. Reiss: The Rate of Supernovae in the Nearby and Distant Universe. Ph.D. Thesis, University of Washington, Seattle (2000)
- (10) A. Renzini: ApJ 488, 35 (1997)
- (11) C. C. Steidel, et al.: ApJ 519, 1 (1999)
- (12) J. L. Tonry, et al.: ApJ 594, 1 (2003)
- (13) L. R. Yungelson, & Livio, M.: ApJ 528, 108 (2000)