Spatially resolved spectrum of the Vela PWN
Abstract
A series of 13 Chandra observations provided the deepest images of the Vela PWN yet available. In addition to the fine structure of the inner PWN features, a much larger and fainter asymmetric X-ray nebula emerges in the summed images. The shape of this outer PWN is similar to that of the radio PWN. We also present the spectral map of the Vela PWN that reveals a shell of soft emission surrounding the inner PWN and an extended region of harder emission south-west of the pulsar. This may indicate that the outer jet is supplying particles to this region.
Dept. of Astronomy and Astrophysics, The Pennsylvania State University, 525 Davey Lab, University Park, PA 16802; green@astro.psu.edu, pavlov@astro.psu.edu
1. Introduction
Observations of the Vela and Crab pulsar-wind nebulae (PWNe) with the Chandra X-ray Observatory have revealed the complex structure and dynamics of relativistic outflows from pulsars (e.g., Hester et al. 2002; Pavlov et al. 2003). The innermost brightest parts of these PWNe exhibit approximately axially-symmetric morphologies, with extended jet-like structures stretched along the symmetry axis (Helfand et al. 2001; Pavlov et al. 2001).
To better understand the properties of the shocked pulsar wind, it is important to investigate the correlation between the spectral and spatial structures of the PWN. For instance, XMM observations of the Crab PWN (with resolution) have shown that the spatial dependence of the spectral slope is not isotropic, being well correlated with the PWN structure: e.g., the hardest emission comes from the inner torus region (Willingale et al. 2001). The Chandra resolution and proximity of the Vela pulsar ( pc; Dodson et al. 2003a) make it possible to obtain an even better quality spectral map of the Vela PWN, provided that a sufficient number of counts is collected.
Here we present the spectral map of the Vela PWN obtained from deep observations with the Chandra ACIS detector. We also investigate the large-scale morphology of the Vela PWN in X-rays and compare it with that of the radio PWN (Dodson et al. 2003b).
2. X-rays: PWN spatial and spectral structure
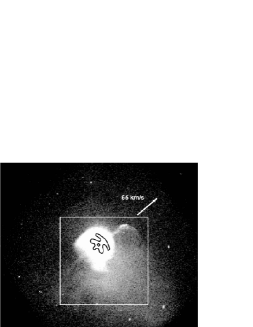
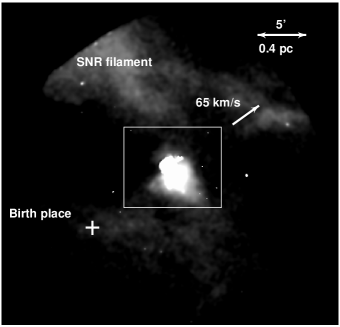
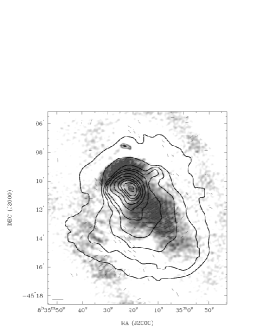
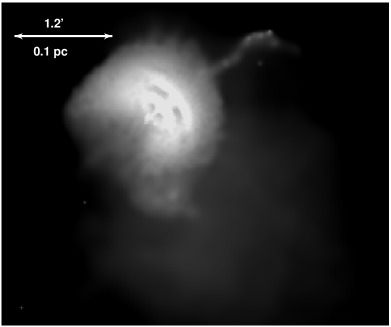
The large-scale X-ray structure of the Vela PWN is shown in the summed images composed of eight ACIS and three HRC observations (left and right panels of Fig. 1111see http://www.astro.psu.edu/users/green/IAU2003/ for the color images , respectively; see Pavlov et al. 2003 for technical details of image reduction). The brightness scale in the images is adjusted to emphasize a fainter, more diffused emission (the inner PWN features are shown by contours in the left panel of Fig. 1; see also Fig. 3). This faint emission is clearly asymmetric: most of it is located south-west (SW) of the symmetry axis that is approximately co-aligned with the direction of the pulsar’s proper motion (left panel in Fig. 1). Such asymmetry, as well as persistent bending of the northeastern jet to SW, suggest the presence of large-scale ( pc) density/pressure gradients or a wind (invisible in X-rays) blowing in the SW direction in the ambient SNR medium. Another region of even fainter emission is seen at the bottom of the image shown in the right panel of Figure 1. This emission could be produced by the pulsar wind at the time when the pulsar was located close to its birth place. If true, this places an upper limit of G on the magnetic field in the region. Alternatively, the emission could be due to a background SNR filament. To obtain the spectrum and resolve this issue, a deep exposure of this region with ACIS is needed.
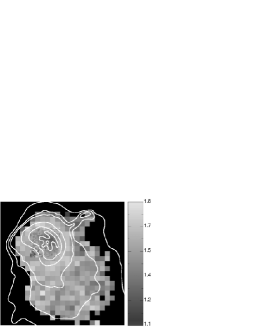
To investigate the PWN spectral properties, we produced a photon index map of a region (white box in the left panel of Fig. 1) from the merged ACIS event list with the aid of CIAO software222Chandra Interactive Analysis of Observations — see http://cxc.harvard.edu/ciao/, v.2.3. Although extracting the spectra from the merged event list is generally not recommended333 http://cxc.harvard.edu/ciao2.3/threads/combine/, we believe that in this case the uncertainties introduced by doing so are minimal since the PWN was imaged at the same location on the ACIS S3 chip in all 8 observations, and a properly averaged444 http://cxc.harvard.edu/ciao2.3/threads/wresp_multiple_sources/index.html#warf ARF was used. After some experimenting, we adopted and bins to be used for spectral extraction, depending on the distance from the pulsar. This provides roughly comparable signal-to-noise ratios for the bright inner PWN and much fainter outer PWN.
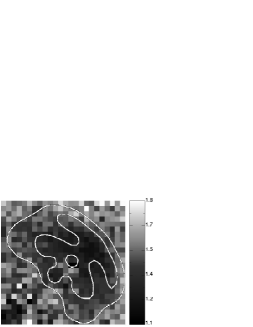
Most noticeable features in the spectral map (Fig. 2, left panel) are the shell of soft emission surrounding the inner PWN (which includes the arcs and the inner jets with hard spectra; Fig. 2, right panel) and the relatively hard spectrum of the diffuse emission SW of the pulsar (which is harder, on average, than that of the shell located closer to the pulsar). The harder spectrum can be explained if the bent outer jet (see Fig. 1), whose spectrum is also hard (photon index ), supplies particles to the region SW of the pulsar on a timescale shorter than the synchrotron cooling time years. The energy losses for the particles carried with the equatorial outflow can be larger than for the jet’s particles, e.g., due to additional expansion losses which are less important for the well-collimated jet. Emission produced by the particles associated with the equatorial outflow can give rise to the soft shell if the particles move outwards sufficiently slow and have enough time to cool.
3. Connection between the radio and X-rays
In the recently obtained radio images of the Vela PWN the emission mostly comes from two lobes of different sizes and brightnesses (Dodson et al. 2003b). Overlaying the X-ray contours on top of the radio image, we find that the outer contours (corresponding to lower X-ray brightness) are well correlated with the shape of the radio PWN (Fig. 3). This suggests that the X-ray and radio emitting electrons are carried with the same outflow which is mostly confined to a low-latitude (equatorial) region. In terms of relative brightness, the radio emission is brighter further away from the pulsar while the X-ray emission is the brightest close to the pulsar. Such a picture can be explained by the synchrotron and expansion losses which particles suffer as they travel away from the pulsar.
To conclude, the multiwavelength data continue to provide clues to understanding the complicated PWN topology and elucidate the dynamics of the relativistic pulsar winds and their interaction with the SNR medium.
Acknowledgments.
Support for this work was provided by NASA through grant NAG5-10865 and Chandra Award GO2-3091X.
References
Dodson, R., et al. Legge, D., Reynolds, J. E., et al. 2003a, ApJ, 569, 1137
Dodson, R., Lewis, D., McConnell, D., et al. 2003b, MNRAS, 343, 116
Helfand, D. J., Gotthelf, E. V., & Halpern, J. P. 2001, ApJ, 556, 380
Hester, J. J., Mori, K., Burrows D., et al. 2002, ApJ, 577, 49
Pavlov, G. G., Teter, M. A., Kargaltsev, O., et al. 2003, ApJ, 591, 1157
Pavlov, G. G., Kargaltsev, O., Sanwal, D., et al. 2001, ApJ, 554, 189
Willingale, R., Aschenbach, B., Griffiths, R. G., et al. 2001, A&A, 365, 212