R. S. Furuya et al.A Giant Flare on T Tauri Star Observed at Millimeter Wavelengths \Received2003/08/27 \Accepted2003/10/24
radio continuum: stars — stars: flare — pre-main sequence — individual (GMR-A) — techniques : interferometric
A Giant Flare on A T Tauri Star Observed at Millimeter Wavelengths
Abstract
We have conducted multi-epoch synthesis imaging of 2 and 3 millimeter (mm) continuum emission and near infrared K band (2.2 m) imaging of a flare event in January 2003 that occurred on the young stellar object GMR-A which is suggested to be a weak-line T Tauri star in the Orion cluster. Our mm data showed that the flare activity lasted at least over 13 days, whereas the K-band magnitude did not change during this event. In addition, we have succeeded in detecting short time variations of flux on the time scales of 15 minutes. The total energy of the flare is estimated to be erg, which makes it one of the most energetic flares reported to date. Comparing the mm continuum luminosities with reported X-ray luminosities, we conclude that the mm flare was similar in nature to solar and other stellar flares. Our results will be a crucial step toward understanding magnetically induced stellar surface activities in T Tauri stars.
1 Introduction
Recent radio and X-ray observations have revealed that pre-main-sequence stars show flare activity as seen in the Sun and late-type stars. The radio emission has been attributed to gyrosynchrotron emission from mildly relativistic electrons and is preferentially seen in X-ray bright stars. Luminosities of these flares at centimeter (cm) and those in soft X-rays are known to correlate well with each other (Güdel 2002; references therein). Moreover, Feldman, Laming & Doschek (1995) discovered a correlation between the peak temperature of a flare () and its volume emission measure () derived from X-ray spectra of solar and stellar flares. Shibata & Yokoyama (1999, 2002 hereafter SY02) attempted to explain the relation by magnetohydrodynamic models.
Stellar X-ray emission is highly time variable, but variability at millimeter (mm) wavelengths is poorly understood. This Letter111Based on the results from the Nobeyama Radio Observatory and Okayama Astrophysical Observatory which are branches of the National Astronomical Observatory, operated by the Ministry of Education, Culture, Sports, Science and Technology of Japan., presents in detail our mm interferometric observations of a flare that occurred in 2003 January in GMR-A. Initial results were reported in Nakanishi et al. (2003). The flare was originally discovered by Bower, Plambeck & Bolatto (2003a) using the BIMA array on January 20 UT at 86 GHz and subsequently reported by Bower et al. (2003b, hereafter BPB03). GMR-A is identified as a member of the Orion cluster (M42; distance of 450 pc) from early VLA observations (Garay, Moran & Reid 1987). BPB03 identified that the object is a K5 type weak-line T Tauri star (WTTS; bolometric luminosity ) by near-infrared (NIR) spectroscopy. During the flux monitoring campaign at cm wavelengths over 7 months in 1990, GMR-A showed one radio flare (Felli et al. 1993).
2 Observations
Synthesis imaging of the 2 and 3 mm continuum emission was carried out using the Nobeyama Millimeter Array (NMA) with the most expanded configuration (Table 1). Note that the two frequency bands were not observed simultaneously. The phase tracking center was set at R.A.\timeform5h35m11s.8, Decl.\timeform-5D21’49”.2 (J2000) and the field of view (FOV) was \timeform70” at 3 mm and \timeform50” at 2 mm. For the backend, the 1 GHz bandwidth correlator was employed. We used the continuum source 0420014 as a bandpass calibrator and 0528134 as a phase and gain calibrator. From observations of Uranus, we estimate the fluxes of 0528134 to be 2.560.5 Jy at 98 GHz and 2.110.4 Jy at 147 GHz.
(69mm,69mm)fig1.eps
The NIR K-band ( 2.2 m) data were taken with the Okayama Astrophysical System for Infrared imaging and Spectroscopy (OASIS) mounted on the 1.88 m telescope of the Okayama Astrophysical Observatory. OASIS has a FOV of \timeform4’ with an image pixel size of \timeform0.”97. The observations were done with seeing of \timeform1.7” on 2003 January 18.451 and 21.459 UT and its calibration was performed using 23 stars reported in Muench et al. (2002).
| UT 2003 | Time Range of HA∗*∗*footnotemark: | Time††\dagger††\daggerfootnotemark: | Frequency | Sensitivity‡‡\ddagger‡‡\ddaggerfootnotemark: | §§\S§§\Sfootnotemark: | |
|---|---|---|---|---|---|---|
| (hh:mm:ss.s) | (hrs) | (GHz) | (mJy beam-1) | (arcsecarcsec) | ||
| Jan.24.56 | 02:02:29.9 | 03:15:37.9 | 1.00 | 97.782 | 4.4 | 2.511.18 |
| Jan.25.55 | 00:31:08.8 | 01:45:22.1 | 1.00 | 146.969 | 5.1 | 1.320.91 |
| Jan.25.61 | 02:30:29.5 | 03:18:37.5 | 0.750 | 97.782 | 5.4 | 2.281.21 |
| Jan.28.44 | 02:46:34.1 | 00:46:13.7 | 1.90 | 98.243 | 4.1 | 2.251.35 |
| Jan.28.58 | 00:42:59.0 | 03:02:22.6 | 1.75 | 141.359 | 2.4 | 1.650.92 |
| Feb.02.57 | 00:32:38.8 | 03:22:05.5 | 2.25 | 99.023 | 4.1 | 2.892.50 |
| Feb.07.57 | 01:08:22.9 | 03:41:48.3 | 2.00 | 99.023 | 2.8 | 2.581.35 |
| Feb.15.37 | 04:02:00.0 | 00:07:37.6 | 3.25 | 99.023 | 3.1 | 2.851.56 |
Time ranges of the observations given with starting (left) and ending (right) hour angles (HAs), ††\dagger††\daggerfootnotemark: Effective integration times, ‡‡\ddagger‡‡\ddaggerfootnotemark: RMS image noise levels, §§\S§§\Sfootnotemark: Synthesized beam sizes along major () and minor () axes.
3 Results and Discussion
3.1 Overall Properties: The Maps and Time Variations
Fig. 1 is a map of the continuum emission at 2 mm superposed on a 2.2 m image. The peak positions of the 2 mm and 2.2 m emission coincide with each other within errors (), and their positions agree with the previous measurements with BIMA and VLA (e.g., Felli et al 1993). The K band flux was measured to be 9.6250.032 mag on January 18.451 and 9.5860.047 mag on January 21.46. There was no significant flux change at K band during the most prominent mm flare on January 20.188 (BPB03). Furthermore, the above measurements are consistent with those in 1997 (Muench et al. 2002) and in 1999 (Hillenbrand & Carpenter 2000) within 0.05 mag, suggesting that the K band flux is stable. Comparing our K band data with those of H band (Hillenbrand & Carpenter 2000), GMR-A is embedded in dust ( 0.047 mag). Such strong infrared excess is more consistent with a classical T Tauri star rather than a WTTS, as BPB03 argued as well.

| 3 mm | 2 mm | Spectral | |||||
|---|---|---|---|---|---|---|---|
| UT 2003 | Frequency | Flux | Frequency | Flux | Index | ||
| (GHz) | (mJy) | (GHz) | (mJy) | ||||
| Jan.24 | 97.782 | ∗∗\ast∗∗\astfootnotemark: | |||||
| Jan.25 | 97.782 | 22.35.4 | 146.969 | 39.15.1 | |||
| Jan.28 | 98.243 | 36.24.1 | 141.135 | ∗∗\ast∗∗\astfootnotemark: | ††\dagger††\daggerfootnotemark: | ||
| Feb.02 | 99.023 | 23.33.5 | |||||
| Feb.07 | 99.023 | 18.22.8 | |||||
| Feb.15 | 99.023 | ∗∗\ast∗∗\astfootnotemark: | |||||
upper limit, 5 upper limit.
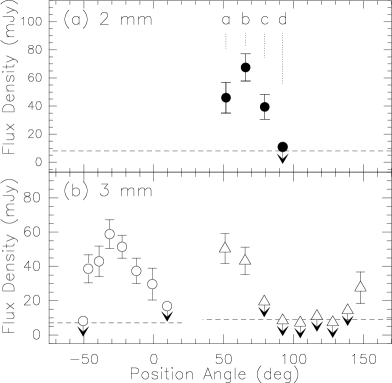
Table 2 summarizes flux densities measured at 2 and 3 mm integrated over one day. We present radio “light curves” in Fig.2a where a clear pattern of a flare can be seen at 3 mm: the flux density at 3 mm increased from January 25 to 28, then it gradually decayed and was not detected on February 15. Although BPB03 reported that the onset of the burst was January 20, we did not detect any emission at 98 GHz on January 24. BPB03 also reported non-detections in their VLBA observations on January 24 at 15 and 22 GHz. We suggest that these non-detections could be due to intrinsic short time variations of the source () or a possibility that the January 25 detection is attributed to a different (possibly the second giant) burst event as BPB03 suggested. It is also possible that January 28, February 2, and 7 measurements refer to independent flares that may occur frequently on the star. The behavior at 2 mm, on the other hand, was significantly different: though it showed bright emission on January 25.55, it was not detected at January 28.58.
The above time variation leads to a drastic change in the apparent spectral indices. We derived indices between 2 and 3 mm assuming a power-law type spectrum (): the index, , observed on January 25 was positive with , but the January 28 index was negative with a 5 upper limit of . The former could be explained with a combination of optically thin free-free emission and thermal emission emanating from dust, but the latter cannot be easily explained. Rodriguez et al. (1993) reported that a negative spectral index less than cannot occur for thermal processes involving free-free emission and absorption (Fig.2b), regardless of the electron density and temperature distribution. In fact, we found that the neither of the indices can be reproduced with the model of an H\emissiontypeII region embedded in a dust cloud core by Furuya et al. (2002). Cool dust radiating at those wavelengths should not exhibit such rapid variations of , as demonstrated by our K band observations.
3.2 Short Time ( A Day) Variations
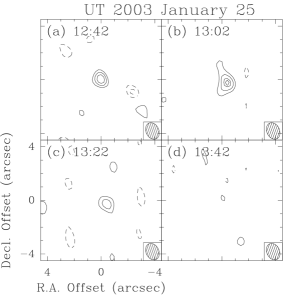
Solar and stellar flares are commonly accompanied by short time scale ( 1 day) variations at cm radio and X-ray wavelengths (Dulk, 1985). In fact, BPB03 detected short time variations at 86 GHz within a day of January 20. To investigate such rapid variation, we selected data sets containing 15-minute (min) integrations in which the emission was detected with signal to noise ratios higher than 3: the 2 mm data taken on January 25, and the 3 mm data on January 28 and February 2. Fig.3 is a series of 2 mm continuum maps taken every 20 min on January 25. The highly time variable nature of the source can clearly be seen. At the beginning, its flux was 4611 mJy (Fig.3a), it flared up to 68 10 mJy after 20 min (Fig.3b), then it was decaying (409 mJy; Fig.3c) and diminished ( upper limit of 33 mJy: Fig.3d) 60 min from the beginning. During the observations, the calibrator was observed every 20 min with 4 min integrations, and the amplitude of its raw visibilities taken by each baseline during each 4 min showed no systematic variation with fluctuation less than 12% of the mean value. Therefore the observed flux variations are not an artifact of calibration.
It is important to discuss how linearly polarized emission affects the flux measurements because radio emission showing short time variations might be intrinsically linearly polarized. Receiver systems detect one direction of incident radiation. The NMA receivers on each antenna are placed at the Nasmyth foci for each band and are aligned so that detected directions with individual antennas are parallel when they are projected to the plane of sky. Since the direction rotates while tracking the object, observing with such systems could cause apparent flux variation. Assuming that the radiation has a linearly polarized component and that its polarization angle is constant, the phase of the flux variation should be synchronized with the position angle (PA) of the receiver with a \timeform180D period. To verify lack or existence of such a periodic pattern, we present Fig.4 where the flux variation is transformed as a function of PA.
The flux variations of the three data sets in Fig.4 do not show any periodic pattern of phases. The 2 mm fluxes (Fig.4a) show variation on a time scale much shorter than a \timeform180D period. This strongly suggests the 2 mm flux variation is real. The 3 mm data taken on January 28 seem to show a considerable flux change peaked around PA\timeform-30D but there is no signature which suggests an existence of a \timeform180D period (Fig.4b). The other 3 mm data contain too many non-detection points to judge whether there is a sinusoidal variation with a \timeform180D period. Moreover, we did not find a unique solution that all the 3 mm data points satisfy with a \timeform180D period, even if we consider the overall decay of the flux (Fig.2a). We thus conclude that there is no significant contribution of linear polarization and that the observed short time variation with time scale less than an hour is due to intrinsic variations of the source. These results are consistent with those from the BIMA measurements.
3.3 The Nature of the GMR-A Flare in 2003 January
Fig.5 compares radio and soft X-ray luminosities of GMR-A in quiescent and flaring phases with those of magnetically active stars in quiescent phase (Güdel 2002). Solar flares which are less energetic than the stellar flares presented here are known to satisfy the correlation as well. Considering that GMR-A is most likely to be a single WTTS (BPB03), we conclude that the flux enhancements in 2003 January were due to stellar flares from a magnetically active WTTS, such as V773 Tau (e.g., Feigelson & Montmerle 1985). This is because the locus of GMR-A in quiescent phase is basically consistent with the correlation.
Physical parameters for a flare can be estimated from the data of January 20 on which the radio and X-ray observations were carried out simultaneously. Using the soft X-ray luminosities in the flaring phase and the time scale of the mm flare (BPB03; also our results from ) together with the reported time scale of the X-ray flare (a few 0.1 day; Getman et al. 2003), we estimate total energy () of the flare of erg, taking of erg s-1 (Getman et al., 2003). Once we know , we can pinpoint the locus of the flare in the diagram (see Fig. 8 in [SY02]): we estimate of K and of cm-3. Subsequently, using Fig.2 in SY02, we estimate a magnetic field strength () of G, which indicates that the cyclotron frequency should appear in the GHz range. This estimate is consistent with measurements of the stellar photospheric magnetic field strength (a few kG; BPB03) which is expected to be an order of magnitude stronger than those of coronal magnetic field strengths.
We believe that the and estimated above are applicable to the flares detected with the NMA. This is because the observed flux density (Table 2) and the flare’s size scale that can be estimated from plausible Alfvén velocity (0.05 assuming 100 G and typical solar flare density of cm-3) and the flaring time scale give us the brightness temperature of K, which is consistent with the estimated above. In conclusion, our results are an important step toward understanding magnetically induced stellar surface activities in T Tauri stars and will add to the growing evidence that magnetic reconnection processes could explain solar and stellar flares over various energy scales.

The authors thank all the staff at Nobeyama and Okayama observatories. Special thanks are due to Prof. K. Shibata for fruitful discussion. The authors gratefully acknowledge the anonymous referee whose comments significantly improved the quality of the paper. We wish to acknowledge discussions with R. Bandiera, R. Cesaroni, M. Felli, M. Güdel, K. Hamaguchi, H. Hirashita, S. Kameno, K. Shibasaki, M. Shimojo, S. Takahashi, L. Testi, C. M. Walmsley, A. Wootten, and K. Yanagisawa.
References
- Bower, Plambeck, & Bolatto (2003b) Bower, G. C., Plambeck, R., & Bolatto, A. 2003a, IAU Circ., 8055, 2
- Bower et al. (2003b) Bower, G. C., Plambeck, R., Bolatto, A., McGrady, N., Graham, J. R., de Pater, I., Lin., M. C., & Baganoff, F. K. 2003b, ApJ, in press (BPB03)
- Dulk (1985) Dulk, G. A. 1985, ARA&A, 23, 169
- Feigelson & Montmerle (1985) Feigelson, E. D., & Montmerle, T. 1985, ApJ, 289, L19
- Feldman, Laming & Doschek (1995) Feldman, U., Laming, J. M., & Doschek, G. A. 1995, ApJ, 451, L79
- Felli et al. (1993) Felli, M., Taylor, G. B., Catarzi, M., Churchwell, E., & Kurtz, S. 1993, A&AS, 101, 127
- Furuya et al. (2002) Furuya, R. S., Cesaroni, R., Codella, C., Testi, L., Bachiller, R., & Tafalla, M. 2002, A&A, 390, L1
- Garay, Moran, & Reid (1987) Garay, G., Moran, J. M., & Reid, M. J. 1987, ApJ, 314, 535
- Getman et al. (2003) Getman, K. V., Feigelson, E. D., Garmire, G., Murray, S. S., & Harnden, F. R. 2003, IAU Circ., 8068, 2
- Güdel (2002) Güdel, M. 2002, ARA&A, 40, 217
- Hillenbrand & Carpenter (2000) Hillenbrand, L. A., & Carpenter, J. M. 2000, ApJ, 540, 236
- Muench, Lada, Lada, & Alves (2002) Muench, A. A., Lada, E. A., Lada, C. J., & Alves, J. 2002, ApJ, 573, 366
- Nakanishi et al. (2003) Nakanishi, K., Saito, M., Furuya, R. S., Shinnaga, H., & Momose, M. 2003, IAU Circ., 8060, 2
- Rodriguez et al. (1993) Rodríguez, L. F., Marti, J., Canto, J., Moran, J. M., & Curiel, S. 1993, Rev. Mex. Astron. Astrofis., 25, 23
- Shibata & Yokoyama (1999) Shibata, K. & Yokoyama, T. 1999, ApJ, 526, L49
- Shibata & Yokoyama (2002) Shibata, K. & Yokoyama, T. 2002, ApJ, 577, 422 (SY02)