The Effect of Neutron Star Rotation on the Properties of Thermonuclear X-ray Bursts
Abstract
Using observations with the Rossi X-ray Timing Explorer, we previously showed that millisecond oscillations occur preferentially in thermonuclear X-ray bursts with photospheric radius expansion from sources rotating near 600 Hz, while they occur with equal likelihood in X-ray bursts with and without radius expansion for sources rotating near 300 Hz. In this paper, we use a larger sample of data to demonstrate that the detectability of the oscillations is not directly determined by the properties of the X-ray bursts. Instead, we find that (1) the oscillations are observed almost exclusively when the accretion rate onto the neutron star is high, but that (2) radius expansion is only observed at high accretion rates from the Hz sources, whereas it occurs only at low accretion rates in the Hz sources. The persistent millisecond pulsars provide the only apparent exceptions to these trends. The first result might be explained if the oscillation amplitudes are attenuated at low accretion rates by an extended electron corona. The second result indicates that the rotation period of the neutron star determines how the burst properties vary with accretion rate, possibly through the differences in the effective surface gravity or the strength of the Coriolis force.
1 Introduction
Nearly-coherent millisecond brightness oscillations with frequencies between 270–620 Hz have been observed during thermonuclear X-ray bursts from 13 neutron star low-mass X-ray binaries (see Strohmayer & Bildsten 2003, for a review). Two of these systems also show persistent millisecond pulsations at the same frequencies in their non-burst emission (Chakrabarty et al., 2003; Strohmayer et al., 2003). It is therefore widely accepted that the oscillations result from brightness patterns that form on the surfaces of these rapidly-rotating neutron stars during X-ray bursts, thus probing two very different pieces of physics: the distribution of neutron star spin frequencies (e.g., White & Zhang, 1997; Bildsten, 1998; Chakrabarty et al., 2003), and how unstable nuclear burning proceeds on a neutron star’s surface (e.g., Nath, Strohmayer, & Swank 2002; Spitkovsky, Levin, & Ushormirsky 2002; Muno, Özel, & Chakrabarty 2003b).
In the sources that exhibit the millisecond burst oscillations, they are only detected from about half of all X-ray bursts. We previously showed that if a distinction is drawn between sources rotating at Hz and Hz based on the timing properties of their persistent emission (see van der Klis, 2000, for a review), then there is a physical difference in the properties of the bursts that exhibit oscillations (Muno et al., 2001). The fast, 600 Hz oscillations almost always occur during the strongest X-ray bursts, during which the photosphere of the neutron star is driven to a large radius by radiation pressure. In contrast, the slow, Hz oscillations occur with equal likelihood in bursts with and without photospheric radius expansion. Observational selection effects or differences in viewing angles cannot by themselves produce the correlations between burst properties and the presence of oscillations.
The proposed explanation for this difference has two parts (Franco, 2001; Muno et al., 2001): (1) that burst oscillations are almost exclusively detected when the accretion rates onto the neutron stars are relatively high (), even though the X-ray bursts themselves have also been observed at significantly lower accretion rates, and (2) that the properties of bursts at these high accretion rates are different in the fast and slow rotators. This explanation was motivated largely by observations of only two systems (4U 172834 and KS 1731260), and still requires confirmation with a larger sample of sources. After seven years of operation, there is now sufficient data in the archive of observations taken with the Rossi X-ray Timing Explorer (RXTE) Proportional Counter Array (PCA; Jahoda et al., 1996) to examine this hypothesis for several sources. Therefore, in this paper we examine how the presence of millisecond oscillations and of photospheric radius expansion in thermonuclear X-ray bursts are related to the persistent accretion rates onto the neutron stars.
2 Observations and Results
We obtained public RXTE PCA observations of 12 out of 13 sources of millisecond burst oscillations.111We omitted MXB 174329 from our analysis because its persistent emission cannot be isolated from the several sources within 1∘ of the Galactic center. We searched for X-ray bursts using the using the algorithm
explained in Galloway et al. (in preparation). As of August 2003, we detected 394 bursts from these 12 sources.
2.1 Persistent Accretion Rate onto the Neutron Star
We first characterized the persistent accretion rates onto the neutron stars () using X-ray color-color diagrams. Using data with 128 energy channels between 2–60 keV and 16 s time resolution, we defined soft and hard colors as the ratio of the background-subtracted detector counts in the (3.6–5.0)/(2.2–3.6) keV and the (8.6–18.0)/(5.0–8.6) keV energy bands, respectively. We used 64 s integrations to calculate the colors when the source intensity was above 100 counts s-1, and 256 s integrations otherwise. We corrected the raw colors to account for changes in the gain of the PCA using linear terms that were determined by assuming that the Crab nebula had a constant count rate in all four bands (Muno, Remillard, & Chakrabarty 2002a).
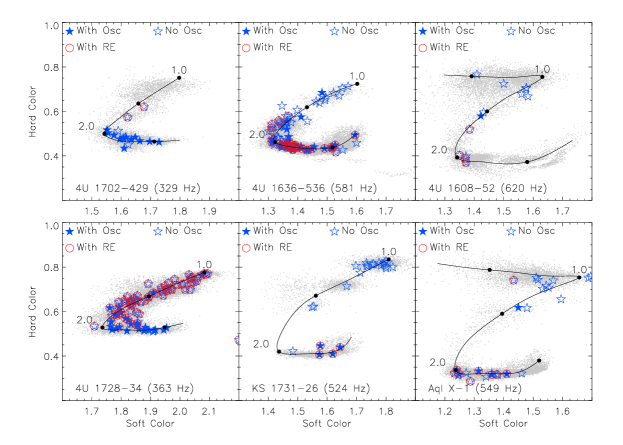
The resulting color-color diagrams are illustrated using the grey points in Figure 1. As onto the neutron star increases, a source moves from the top-left to the bottom-right, roughly tracing a Z-shaped pattern (Hasinger & van der Klis, 1989; Muno et al., 2002a; Gierlinski & Done, 2002a).222Note that all of the burst oscillation sources are traditionally classified as so-called “atoll” sources. They are not to be confused with the so-called “Z” sources, which are more luminous and do not usually exhibit X-ray bursts (see van der Klis, 2000, for a review). The transient systems Aql X-1 and 4U 1608522 were observed over the largest range of accretion rates, and therefore trace a full Z-shaped pattern in the color-color diagrams. The sources 4U 1702429, 4U 172834, 4U 1636536, and KS 1731260 trace portions of the bottom and diagonal branches of the Z-track (see also Muno et al., 2000; Franco, 2001; van Straaten et al., 2001). For these six sources, we have parameterized the position on the color-color diagram using the arc-length () along the solid curves in Figure 1 (see Dieters & van der Klis, 2000, for details of how this is defined). The remaining sources were observed on only a portion of the Z-track. The sources MXB 1659298 (Wijnands et al., 2002), 4U 1916053 (Boirin et al., 2000), SAX J1748.92021 (Kaaret et al., 2003), and SAX J1750.8-2900 (Kaaret et al., 2002) were observed almost extensively on the bottom portion of the Z-track. The persistent pulsars SAX J1808.43658 and XTE J1814-338 were only observed on the top (hard) branch of the Z-track, despite large variations in their luminosities. The color-color diagrams for these sources will be presented elsewhere (Galloway et al., in preparation).
In order to determine the accretion rate at the time the X-ray burst occurred, we calculated the hard and soft colors in the 256 s interval prior to the burst. These are indicated by the blue stars in Figure 1. Most of the conclusions that follow will be based on the six sources in which varies over a wide range.
2.2 Presence of Millisecond Oscillations
We searched for millisecond oscillations during the X-ray bursts in data recorded with s (122 s) time

resolution. We computed fast Fourier transforms of each 1 s interval of data for the first 15 s of the burst, and searched for signals within 5 Hz of the known spin frequencies. We considered a signal to be a detection if it had less than a 1% probability of occurring by chance given the 160 trial frequencies searched for each burst. A signal was considered significant if it passed any of three tests: (1) having a chance of that it was produced by noise in a single trial, (2) persisting for two adjacent time and frequency bins with a chance probability of , or (3) occurring in the first second of a burst with a chance probability of . Millisecond oscillations were detected from 137 bursts in this manner; fewer than 5 (%, conservatively assuming the tests were independent trials) should be spurious detections of noise signals according to our selection criteria. Oscillations are detected in all of the bursts from the millisecond pulsars SAX J1808.43658 and XTE J1814338 (Chakrabarty et al., 2003; Strohmayer et al., 2003), but are almost exclusively observed at high apparent accretion rates () in the remaining LMXBs. We have indicated the X-ray bursts with oscillations using filled blue stars in Figure 1.
We examined why the millisecond oscillations are not detected at low accretion rates by comparing the fractional rms amplitudes of the detected oscillations to the upper limits on the non-detections. The fractional rms amplitude is defined as
| (1) |
where is the power in the oscillations, is the total number of counts used to compute the power spectrum, and is the estimated background rate taken from the 16 s prior to the burst (Leahy et al., 1983). For the 6 sources in Figure 1, we plot in Figure 2 the amplitudes as a function of position on the Z-track. Each burst is recorded once in the figure. For detected oscillations, we plot the amplitude of the signal with the largest power. For upper limits, we plot the largest rms amplitude among the noise signals detected within 5 s after the start of the burst decay (most detected oscillations are observed at this time; see Muno et al. 2002b). Although the trend is not absolute, the upper limits on the non-detected signals at low are typically a factor of two smaller than the amplitudes of the detected signals at higher . This indicates that the fractional amplitudes decline as the accretion rates onto the neutron stars decrease.
2.3 Photospheric Radius Expansion
We characterized the spectral properties of the X-ray bursts by extracting spectra of the emission at 0.25 s intervals. The data used provided at least 32 energy channels between 2–60 keV. We accounted for the background and non-burst emission using spectra from the 16 s prior to each burst (e.g. Kuulkers et al., 2002). The instrumental responses for the detector units that were active during each burst were generated using the FTOOL pcarsp. We modeled the spectra between 2–25 keV using a blackbody function absorbed by the interstellar medium. The interstellar hydrogen column density was held fixed at the mean value determined from a prior fit in which it was allowed to vary. The model provides an apparent temperature () and a normalization equal to the square of the apparent radius () of the burst emission surface.
As a proxy for the other properties of the bursts, we adopt the presence of photospheric radius expansion, using the criteria of Galloway et al. (2003). We considered a source to have exhibited radius expansion if (1) reached a local maximum close to the time of peak flux, (2) was observed to be lower shortly after the flux, with a significance of at least , and (3) coincident with the maximum in , also reached a local minimum. X-ray bursts with radius expansion that are identified with these criteria also tend to have the largest peak fluxes and fluences, and usually rise and decay most quickly (Strohmayer & Bildsten, 2003, Galloway et al., in preparation).
The X-ray bursts with radius expansion are indicated with red circles in Figure 1. Radius expansion bursts occur preferentially at low () in the sources with Hz spin frequencies in Figure 1 (4U 1702429 and 4U 172834), but not at high (). In contrast, radius expansion occurs predominantly at high () in the sources with Hz spin frequencies in Figure 1 (4U 1636536, 4U 1608522, KS 1731260, and Aql X-1). The corresponding trends for the persistent millisecond pulsars are unclear, because they only trace the top branch of the Z-track on the color-color diagram, and all the observed bursts exhibit oscillations. However, the bursts from the 401 Hz pulsar SAX J1808.43658 all exhibit radius expansion like the fast sources (Chakrabarty et al., 2003), while the bursts from from the 314 Hz pulsar XTE J1814–338 all lack radius expansion like the slow sources (Strohmayer et al., 2003). The trends are less clear for the remaining LMXBs because less data is available, but they are consistent with those in Figure 1 (Galloway et al. in preparation).
3 Discussion
In a previous paper, we found that for neutron stars spinning at Hz, millisecond oscillations were observed preferentially in thermonuclear X-ray bursts with photospheric radius expansion, while for neutron stars spinning at Hz, oscillations were equally likely to be observed in bursts with and without radius expansion (Muno et al., 2001). The additional data that has entered the public RXTE archive in the past two years demonstrates that this initial distinction can be explained as a combination of two effects. First, in all of the sources oscillations are preferentially detected when the accretion rates onto the neutron stars are high. Second, the X-ray bursts that occur at high accretion rates in the fast rotators exhibit radius expansion, but do not in the slow rotators.
3.1 Millisecond Oscillations as a Function of
The detectability of millisecond burst oscillations is clearly not determined by the properties of the X-ray bursts that they appear in, because if one considers the entire sample of sources in Figure 1, bursts with and without photospheric radius expansion are equally likely to exhibit oscillations. The properties of the X-ray bursts are probably the best indicators of the conditions in the burning layer, while the low amplitudes of the oscillations (5–10% rms; Muno et al., 2002b) suggest that they are only a minor side-effect of the burning. Therefore, since the the properties of the bursts at low accretion rates are so dramatically different in the fast and slow rotators, it seems unlikely that there is some subtle change in the mechanism producing the oscillations that prevents them from being observed at low from all of the sources.
Therefore, we suggest that the mechanism producing the millisecond oscillations always operates during X-ray bursts, but that their amplitudes are attenuated at low by a mechanism external to the burning layer. The amount of attenuation required is quite small, since the fractional amplitudes of the detected signals are on average only a factor of 2 larger than the upper limits on the non-detections (Figure 2). The most likely source of attenuation is a corona of electrons that scatters photons from the surface of the neutron star (e.g. Brainerd & Lamb, 1987; Miller, 2000). A corona of optical depth would be sufficient to attenuate the burst oscillations by a factor of 2 (e.g., Miller, 2000). Such a corona of electrons is thought to produce the high-energy power-law tail that is often present in the X-ray spectra of LMXBs, by inverse-Compton scattering thermal photons form the neutron star (e.g., Barret et al., 2000; Gierlinski & Done, 2002b). This power-law tail is only observed at low , and is inferred to originate from a corona with temperature keV and optical depth (Barret & Olive, 2002; Gierlinski & Done, 2002b; Maccarone & Coppi, 2003). Therefore, this corona could be the reason that millisecond burst oscillations are not observed at in Figure 1.333We note, however, that at high accretion rates the same authors infer the presence of a cooler ( keV), more optically thick () Comptonizing corona. Our interpretation would require that at high this corona is geometrically arranged so as not to intercept photons from the surface of the neutron star.
The two persistent millisecond pulsars provide the only exceptions to the above trend: all of the burst oscillations, and all of the X-ray bursts, are observed in the hard portion of the Z-track on the color-color diagram that corresponds to low . The main proposed difference between the millisecond pulsars and the other bursters is that the former have stronger magnetic fields (Chakrabarty et al., 2003). It is therefore plausible that oscillations are observed at low inferred for the pulsars because magnetic effects either enhance the oscillation amplitudes, or supress a scattering corona.
3.2 X-ray Burst Properties as a Function of
The properties of X-ray bursts also are correlated with the accretion rate onto the neutron star, but in a manner that additionally depends on the neutron star rotation rate. We expect the burst properties to be determined by two factors (Fujimoto, Hanawa, & Miyaji 1981; Fushiki & Lamb, 1987; Bildsten, 2000). First, as increases, the temperature at the burning layer also increases, and thus the column density of helium required to trigger a burst generally decreases. Therefore, if the accretion is spherically symmetric, X-ray bursts that occur at high should be weaker.
Second, there is a competition between how quickly a sufficient column density is accumulated such that helium burning is unstable, and how quickly hydrogen in the accreted material can be stably fused into helium. The local accretion rate per unit area () actually drives the competition, but the accretion is generally assumed to occur with spherical symmetry. At values of thought to correspond to the lower end of those commonly observed from bursting LMXBs (equivalent to global accretion rates of ), H is burned into He faster than it can be accreted, so the X-ray burst occurs from pure He fuel. As increases (), H is accreted faster than it can be burned into He, so the bursts occur from mixed H/He fuel.444We note that at hydrogen burning is unstable, which should also produced mixed H/He bursts. However, in this regime the expected recurrence times (30 h to 10 days; see Bildsten 2000; Narayan & Heyl 2003) are significantly longer than those observed (2–10 h; see Cornelisse et al. 2003). This regime is unlikely to apply to the current data. The X-ray burst properties change between these regimes because the relative amount of H and He in the fuel determines how rapidly the nuclear energy is released during the bursts. Helium burns via a strong triple- process that releases energy quickly, so the low- He bursts are more likely to exhibit radius expansion. In contrast, H serves to moderate the He burning at the start of the burst, and only burns through a slow -capture process onto the products of He burning at the end of a burst. Therefore, the high- mixed H/He bursts should last longer, and be less likely to exhibit radius expansion.
As a result of these two effects, as the global accretion rate onto the neutron star increases, the X-ray bursts should become weaker and less likely to exhibit radius expansion. This is the case for the slow rotators, but in the fast rotators the bursts are more likely to exhibit radius expansion at high . One possible explanation for this is that the accretion is not spherically symmetric (Bildsten, 2000). In particular, if the local accretion rate () decreases as the global rate () increases in the fast rotators, then the high- bursts with radius expansion could occur at low , and the low- bursts without radius expansion could occur at high . In contrast, the change in burst properties in the slow rotators appears consistent with a local that increases as the global does. It is then possible that the rotation rate of the neutron star influences how accreted material spreads over its surface, either through a lower effective surface gravity or a stronger Coriolis force in the fast rotators.; (e.g. Bildsten, 2000; Spitkovsky et al., 2002).
Although we have determined observationally that the rotation rate of a neutron star influences how the properties of thermonuclear X-ray burst change with the accretion rate onto the neutron star, it is not clear what causes the observed correlations. Further progress should be made by studying this sample of sources to see how the burst time scales, peak fluxes, fluences, and recurrence times change with the accretion rates.
References
- Barret & Olive (2002) Barret, D. & Olive, J. F. 2002, ApJ, 576, 391
- Barret et al. (2000) Barret, D., Olive, J. F., Boirin, L., Done, C., Skinner, G. K., & Grindlay, J. E. 2000, ApJ, 533, 329
- Bildsten (1998) Bildsten, L. 1998, ApJ, 501, L89
- Bildsten (2000) Bildsten, L. 2000, in Cosmic Explosions, ed. S. S. Holt & W. W. Zhang (New York: AIP), 359, (astro-ph/0001135)
- Boirin et al. (2000) Boirin, L., Barret, D., Olive, J. F., Bloser, P. F., & Grindlay, J. E. 2000,A&A, 360, 583
- Brainerd & Lamb (1987) Brainerd, J. & Lamb, F. K. 1987, ApJ, 317, L38
- Chakrabarty et al. (2003) Chakrabarty, D., Morgan, E. H., Muno, M. P., Galloway, D. K., Wijnands, R., van der Klis, M., & Markwardt, C. B. 2003, Nature, 424, 42
- Cornelisse et al. (2003) Cornelisse, R., in ’t Zand, J. J. M., Verbunt, F., Kuulkers, E., Heise, J., Hartog, P. R. den, Cocchi, M., Natalucci, L., Bazzano, A., & Ubertini, P. 2003, A&A, 405,, 1033
- Dieters & van der Klis (2000) Dieters, S. W. & van der Klis, M. 2000, MNRAS, 311, 201
- Franco (2001) Franco, L. M. 2001, ApJ, 554, 340
- Fujimoto et al. (1981) Fujimoto, M. Y., Hanawa, T., & Miyaji, S. 1981, ApJ, 247, 267
- Fushiki & Lamb (1987) Fushiki, I. & Lamb, D. Q. 1987, ApJ, 323, L55
- Galloway et al. (2001) Galloway, D. K., Chakrabarty, D., Muno, M. P., & Savov, P. 2001, ApJ, 549, L85
- Galloway et al. (2003) Galloway, D. K., Psaltis, D., Chakrabarty, D., & Muno, M. P. 2003, ApJ, 590, 999
- Gierlinski & Done (2002a) Gierlisnki, M. & Done, C. 2002a, MNRAS, 331, L47
- Gierlinski & Done (2002b) Gierlisnki, M. & Done, C. 2002b, MNRAS, 336, 1373
- Hasinger & van der Klis (1989) Hasinger, G., & van der Klis, M. 1989, A&A, 225, 79
- Jahoda et al. (1996) Jahoda, K., Swank, J. H., Giles, A. B., Stark, M. J., Strohmayer, T., Zhang, W., & Morgan, E. H. 1996, SPIE, 2808, 59
- Kaaret et al. (2002) Kaaret, P., in ’t Zand, J. M. M., Heise, J., & Tomsick, J. A. 2002, ApJ, 575, 1018
- Kaaret et al. (2003) Kaaret, P., in ’t Zand, J. M. M., Heise, J., & Tomsick, J. A. 2003, ApJ accepted, astro-ph/0303379
- Kuulkers et al. (2002) Kuulkers, E., Homan, J., van der Klis, M., Lewin, W. H. G., & Méndez, M. 2002, A&A, 382, 947
- Leahy et al. (1983) Leahy, D. A., Darbro, W., Elsner, R. F., Weisskopf, M. C., Sutherland, P. G., Kahn, S., & Grindlay, J. E. 1983, ApJ, 266, 160
- Maccarone & Coppi (2003) Maccarone, T. J. & Coppi, P. S. 2003, A&A, 399, 1151
- Miller (2000) Miller, M. C. 2000, ApJ, 537, 342
- Muno et al. (2000) Muno, M. P., Fox, D. W., Morgan, E. H., & Bildsten, L. 2000, ApJ, 542, 1016
- Muno et al. (2001) Muno, M. P., Chakrabarty, D., Galloway, D. K., & Savov, P. 2001, ApJ, 553, L157
- Muno et al. (2002b) Muno, M. P., Özel, F., & Chakrabarty, D. 2002b, ApJ, 581, 550
- Muno et al. (2002a) Muno, M. P., Remillard, R. A., & Chakrabarty, D. 2002, ApJ, 568, L35
- Nath et al. (2002) Nath, N. R., Strohmayer, T. E., & Swank, J. H. 2002, ApJ, 564, 353
- Strohmayer & Bildsten (2003) Strohmayer, T. E. & Bildsten, L. 2003, to appear in Compact Stellar X-ray Sources, eds. W. H. G. Lewin & M. van der Klis, Cambridge University Press, astro-ph/0301544
- Strohmayer et al. (2003) Strohmayer, T. E., Markwardt, C. B., Swank, J. H., & in ’t Zand, J. 2003, ApJ, 596, L67
- Spitkovsky et al. (2002) Spitkovsky, A., Levin, Y., & Ushomirsky, G. 2002, ApJ, 566, 1018
- van der Klis (2000) van der Klis, M. 2000, ARA&A, 38, 717
- van Straaten et al. (2001) van Straaten, S., van der Klis, M., Kuulkers, E., & Méndez, M. 2001, ApJ, 551, 907
- White & Zhang (1997) White, N. E. & Zhang, W. 1997, ApJ, 490, L87
- Wijnands et al. (2002) Wijnands, R., Muno, M. P., Miller, J. M., Franco, L. M., Strohmayer, T., Galloway, D., & Chakrabarty, D. 2002, ApJ, 566, 1060