The XMM-Newton view of the X-ray halo and jet of NGC 6251
We present an XMM-Newton observation of the radio jet and diffuse halo of the nearby radio galaxy NGC 6251. The EPIC spectrum of the galaxy’s halo is best-fitted by a thermal model with temperature keV and sub-solar abundances. Interestingly, an additional hard X-ray component is required to fit the EPIC spectra of the halo above 3 keV, and is independently confirmed by an archival Chandra observation. However, its physical origin is not clear. Contribution from a population of undetected Low Mass X-ray Binaries seems unlikely. Instead, the hard X-ray component could be due to inverse Compton scattering of the CMB photons (IC/CMB) off relativistic electrons scattered throughout the halo of the galaxy, or non-thermal bremsstrahlung emission. The IC/CMB interpretation, together with limits on the diffuse radio emission, implies a very weak magnetic field, Gauss, while a non-thermal bremsstrahlung origin implies the presence of a large number of very energetic electrons. We also detect X-ray emission from the outer ( 3.5′) jet, confirming previous ROSAT findings. Both the EPIC and ACIS spectra of the jet are best-fitted by a power law with photon index , fixed Galactic column density, and 1 keV flux nJy. A thermal model is formally ruled out by the data. Assuming an origin of the X-rays from the jet via IC/CMB, as suggested by energetic arguments, and assuming equipartition implies a large Doppler factor (). Alternatively, weaker beaming is possible for magnetic fields several orders of magnitude lower than the equipartition field.
Key Words.:
Galaxies: active – Galaxies: nuclei – X-rays: galaxies1 Introduction
NGC 6251 is a giant elliptical galaxy at redshift =0.024. It is the host of a supermassive black hole with mass (Ferrarese & Ford 1999), dynamically estimated with HST. At radio wavelengths, the source is well studied. The radio source measures 1.2∘ across the sky with bright hotspots that lie toward the edges of its two bright radio lobes (Waggett et al. 1977). This structure is indicative of many powerful Fanaroff & Riley (1974) type-II radio galaxies. However, its power at 178 MHz (Waggett et al. 1977) is below the Fanaroff & Riley division between FRI/II sources, so NGC 6251 appears to be underluminous considering what is expected based on its morphology. A prominent radio jet appears to the N-W for 4.5’, as well as a weak counterjet opposite of the nucleus (Perley et al. 1984). The radio jet appears narrow out to 2’, where the radio shows a bright knot and more diffuse emission (see Fig. 1).
Together with NGC 6252, which lies a few arcminutes to the North, NGC 6251 belongs to the outskirts of the cluster of galaxies Zw 1609.0+8212 (Young et al. 1979). As discussed in Birkinshaw & Worrall (1993), the cluster does not significantly affect the dynamical properties of NGC 6251.
Previous X-ray imaging studies of NGC 6251 with ROSAT showed the presence of an unresolved nuclear source embedded in diffuse thermal emission associated with the galaxy’s halo (Birkinshaw & Worrall 1993), with no contribution from the cluster gas. X-ray emission from the outer radio jet was also detected with ROSAT (Birkinshaw & Worrall 1993), with two compact knots at 4′ and 6′ from the core (Mack et al. 1997a). The latter authors favor a thermal origin for the X-rays on the basis of energetic arguments. Optical emission from the jet region at 20′′ was also claimed (Keel 1988), but never confirmed with HST.
Comparison of the halo gas pressure to the internal jet pressure led Birkinshaw & Worrall (1993) to conclude that the jet cannot be confined by the atmosphere of the galaxy. Furthermore, Mack et al. (1997a) proposed that the jet is magnetically confined.
We observed NGC 6251 with XMM-Newton as part of a project aimed at studying the X-ray emission from the various components of the galaxy. With its better sensitivity and good resolution, the EPIC camera on-board XMM-Newton enables a detailed spectroscopic study of the nucleus and extended features in the 0.3–10 keV energy range. The analysis of the nuclear properties is presented in Gliozzi et al. (2003a; Paper I in the following). Here, we concentrate on the X-ray emission from the halo and the jet, using the EPIC data and archival Chandra and VLA data. In this paper, H km s-1 Mpc-1 and are adopted. With this choice, 1′′ corresponds to 446 pc at the distance of NGC 6251 (97.6 Mpc).
2 Observations and Data Reduction
2.1 XMM-Newton
XMM-Newton carries on-board three sets of CCDs in the focus of the telescope, the EPIC pn and the EPIC MOS1 and MOS2 cameras. While the pn has a larger effective area and is thus optimized for higher signal-to-noise spectroscopy, the MOS offers better imaging capabilities. Both the EPIC pn and MOS cameras operate in the energy range 0.3–10 keV.
We observed NGC 6251 on 2001 March 26 for a duration of ks with
the EPIC pn, and for ks with EPIC MOS1 and MOS2. The EPIC pn
camera was operated with the thin filter, and the MOS cameras with the
medium filter (to avoid pileup of the bright nucleus; Paper
I). Details of the reduction procedure were given in Paper I. In
summary, the data were reprocessed and screened with the
XMM-Newton Science Analysis Software (SAS v.5.3.3) to remove known hot
pixels and other data flagged as bad; only data with FLAG=0 were
used. Investigation of the full–field light curves revealed the
presence of a period of background flaring at the end of the
observation. These events were screened, reducing the effective total
exposures to ks for the EPIC pn and ks for the MOS
cameras. Background data were extracted from source-free circular
regions on the same chips containing the source. There were no signs
of pile-up in the pn or MOS cameras according to the SAS task
epatplot.
The X-ray spectrum of the jet was extracted from an elliptical region with semi-axes of 40′′and 12′′, located at 230′′ from the nucleus. The total count rate of the jet in the above extraction region in the energy range 0.5-9 keV is c/s with EPIC pn, c/s with MOS1, and c/s with MOS2.
Two different regions were used to investigate the spectral properties of the halo: 1) an annular region with radii 35–215′′; 2) a series of annular regions, with an increment of the radius of 30′′, with inner radii ranging from 35′′ to 215′′. In both cases, the radio jet and the point sources visible in the EPIC MOS image were removed. Conservatively, a region of the same size as the jet but at the opposite azimuth (where a possible counterjet could be present at X-rays) was also excised. The count rate of the halo in an extraction annulus with radii 35–215′′ in the energy range 0.5–2 keV is 0.37 0.01 c/s with EPIC pn, 0.102 0.003 c/s with MOS1, and 0.110 0.003 c/s with MOS2.
Spectral analysis was performed using XSPEC v.11. The EPIC pn
and MOS spectra were fitted jointly, leaving the relative
normalizations free to vary to account for inter-calibration
effects. The data were rebinned with a minimum of 20 counts per bin,
in order to apply the statistics, and fitted using the latest
calibration files provided by the XMM-Newton Guest Observer
Facility. Improvement of the fit when free parameters were added to
the fit was evaluated using the F-test, assuming as a threshold for
improvement =95%.
2.2 Chandra
A 25.4 ks archival Chandra image of NGC 6251 was investigated to derive better spatial constraints on the jet and halo. Chandra observed NGC 6251 on Sept 11, 2000 for 25.4 ks with ACIS-I (PI Kerp). In order to study the X-ray emission from the jet, the source was positioned with the nucleus on the gap between chips I1 and I2. While this strategy prevents a detailed analysis of the nuclear properties, the Chandra data in principle can be useful to investigate the spatial properties of the X-ray halo and jet.
We reduced the ACIS data using standard procedures with the
CIAO2.3 software. We restricted our analysis
to the 0.3–8.0 keV energy range, where the instrument is better
calibrated and the background is negligible. We inspected the light
curves of the background to search for possible background
fluctuations. No flares have been detected. Before extracting the
radial profiles of the sources, we removed field sources from the
images (see Appendix). To find the field sources we used the tool
wavdetect with the default value () for the threshold
for identifying a pixel as belonging to a source.
Using the tools dmextract and dmtcalc, we extracted the
radial profiles on a scale of 4′. The jet and halo spectra were
extracted in the same regions as for EPIC (see above), removing the
point sources and, in the case of the halo, the jet and possible
counterjet regions. In order to evaluate the instrumental response to
a point source, we used the method explained in Donato et
al. (2003). Although a script that automatically performs the same
task (ChaRT) has been released by the Chandra X–ray Center,
this script failed in the creation of the instrumental PSF, since the
source is positioned in the gap between chips (photons are created but
not detected).
2.3 Radio
In order to explore the spatial coincidence of X-ray features with the known radio jet, we obtained data from the archive of the NRAO111The National Radio Astronomy Observatory is a facility of the National Science Foundation operated under cooperative agreement by Associated Universities, Inc. Very Large Array (Thompson et al. 1980). We chose a L-band observation from August 15, 1995 which used the full VLA to collect over 3 hours of data “on-source” in its highest resolution A-configuration in spectral-line mode. This data has been published by its original investigators (Werner et al. 2001; Werner 2002) and was processed similarly. In brief, we used AIPS (Bridle & Greisen 1994) for the initial calibration utilizing scans of 3C 286 to set the flux densities to the VLA 1999.2 scale. The nearby source 1800+784 was used as the phase calibrator for NGC 6251, and bandpass calibration performed using 3C 286. The inner 22/31 channels were averaged to produce a single 9 MHz bandwidth continuum dataset centered at about 1.4 GHz which was then self-calibrated in the Caltech DIFMAP package (Shepherd et al. 1994). The final images were corrected for primary beam response using the AIPS task PBCOR. This correction amounts to up to an 5% correction near the 4′ distant X-ray feature in the jet.
3 Results


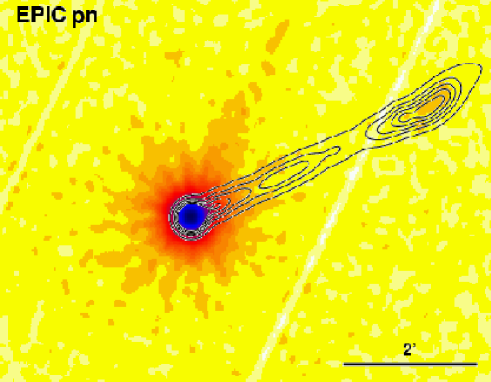
The EPIC pn image of NGC 6251 in 0.3–10 keV is shown in Fig. 1a, with
the VLA contours at 1.4 GHz superposed. The image was binned by a
factor 32 and smoothed with a Gaussian function with width
=6′′. The final resolution is 10′′.
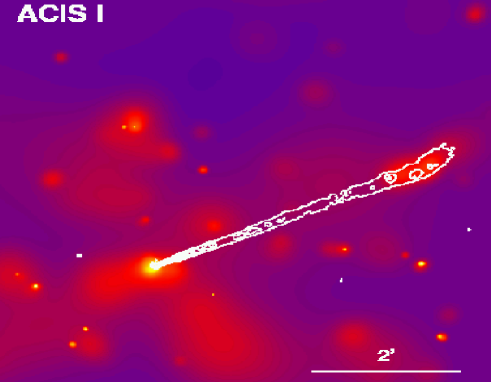
The smoothed ACIS-I image in 0.3–8 keV is shown in Fig.
1b. This image was binned by a factor 4 and smoothed with the
CSMOOTH with final resolution 2′′. The radio images
overlaid in the figures were restored with beamsizes matching the
resolutions of the respective X-ray images.
As apparent in Fig. 1a-b, various components contribute to the total X-ray emission of the galaxy: the nucleus, a diffuse isotropic halo associated with the elliptical galaxy (e.g., Birkinshaw & Worrall 1993), and jet emission at 4′ from the core. Also apparent in the Chandra image are several point sources scattered as far as 4–5′ from the nucleus (see Appendix). Using the Chandra data, we determined that their contribution to the total X-ray emission in the EPIC extraction radius of the halo is 5%.
3.1 The X-ray halo


To investigate the spatial properties of the halo, we extracted brightness radial profiles from EPIC MOS2 on-board XMM-Newton and ACIS-I on-board Chandra. The choice of the MOS2 detector is motivated by geometrical considerations, namely, the fact that the source is centered on its CCD1, and its higher sensitivity than MOS1, offering the best chance to study the extended emission. The EPIC radial profile in the total energy band 0.3–10 keV is shown in Fig. 2a, together with the instrumental PSF and the background, while the ACIS-I profile is shown in Fig. 2b. The MOS2 profile is fully consistent with the instrumental PSF (the MOS2 PSF was obtained using the analytical formula from Ghizzardi 2001) plus background, whereas the ACIS profile suggests the presence of an excess between 20′′ and 100′′. However, the limited signal-to-noise ratio of the ACIS data hampers a more quantitative spatial analysis. We fitted the Chandra profile with a model; the fitted parameters are unconstrained.
Fig. 2c shows the energy-dependent EPIC profiles at soft (0.3–2 keV) and hard (2–10 keV) X-rays. The soft and hard X-ray profiles are similar, suggesting that the the hard X-ray emission originates within the galaxy.
EPIC pn and MOS spectra for the halo were extracted as described
above. We first fitted the total integrated spectrum with a thermal
plasma model (apec in XSPEC), leaving as free parameters
the temperature, , the abundance, (in solar units), and the
normalization. All components are absorbed by a column density fixed
to the Galactic value,
cm-2 (Dickey & Lockman 1990). The fit gives .
Inspection of the residuals shows the presence of excess flux above
the model at energies 3 keV (Fig. 3a). Adding a power law to
the model gives =1.10/2911, improved at 99%
with
respect to the fit with the thermal alone. When the hard tail is
modeled with a thermal bremsstrahlung component, the fit is worse
() than with a power law. The best-fit
temperature is 199 keV, effectively mimicking a flat power law.
The fitted parameters of the thermal plus power law model are: keV, , and photon index . The confidence contours for the temperature and abundance of the thermal component are shown in Fig. 3b. The observed 0.5–2 keV flux of the thermal is F erg cm-2 s-1, and the intrinsic (absorption-corrected) 0.5–2 keV luminosity is L erg s-1. The power law accounts for 20% of the total X-ray emission in 0.5–2 keV. Its observed flux and intrinsic luminosity in 2–10 keV are F erg cm-2 s-1, and L erg s-1, respectively.
We investigated whether the hard power law is related to the contaminating wings of the PSF (the nucleus is a bright X-ray emitter; Paper I). We extracted the halo spectra in annuli of increasing radii, as described in Sect. 2.1. If these spectra are fitted with a thermal model only, the fit is acceptable () but the fitted temperature is very high, keV, much larger than typically found for the halo of radio galaxies, keV (e.g., Worrall, et al. 2001). Inspection of the residuals shows that a power law is present even in the spectrum extracted in the outermost annulus between 155′′ and 215′′. If the power law is added, the fits improve with high significance, 99%; its photon index is not well defined and ranges between –0.7 and 1.2. Within the uncertainties, there is no variation of either the temperature or the abundance of the thermal component with distance from core. The temperature varies in the range 1.3–1.9 keV and the abundance in 0.05–0.2 (90% uncertainties). Moreover, the nucleus spectrum has a substantially steeper slope, (Paper I), than the hard component. It is thus unlikely that the power law represents the contribution of the PSF wings.
A non-thermal component is also required to fit the Chandra spectrum of the halo. The latter was extracted in a similar region as for EPIC, an annulus of radii 35′′ and 215′′, after removing the jet region and the point sources. Spectra were extracted for each CCD and fitted jointly. A fit with a thermal only is good (/209), but yields an unacceptably high temperature keV for . Adding a power law causes the to decrease by =35, significant at 99.9% confidence. The fitted temperature then converges towards the EPIC value with keV.
To investigate the spatial distribution of the hard X-ray component, we extracted soft (0.5–2 keV) and hard (2–8 keV) ACIS images. The hard X-ray image is dominated by the nucleus point source and there are not enough counts in the diffuse emission to study its spatial properties.
In summary, the EPIC spectrum of the diffuse halo in NGC 6251 is best-fitted by a thermal model with temperature 1.6 keV and sub-solar abundances. There are no gradients of either parameter with distance from the core. The data also require a hard X-ray component above 3 keV, which is best-fitted by a power law with a flat slope, albeit poorly determined. The hard component, which accounts for 20% of the total 0.5–10 keV luminosity of the halo, is also detected in the Chandra spectrum.
3.2 X-ray emission from the jet
Fig. 1a-b shows that weak X-ray emission is detected at 4′ from the core in both the EPIC and ACIS images, coincident with the bright radio jet. To assess the significance of the jet detection we compared the average counts found in the elliptical jet region with the counts found in six identical elliptical regions randomly located around the jet. The significance of the jet detection is of the order of 10. We thus confirm the previous claim based on ROSAT of X-ray emission from the outer jet (Mack et al. 1997a). The X-ray emission of the jet is diffuse in both the EPIC and ACIS images, with no compact knots at the resolution of ACIS-I.
We extracted X-ray spectra of the jet with EPIC. The pn and MOS spectra were fitted with a single power law model with Galactic absorption, cm-2. This fit is acceptable, =0.98 for 102 degrees of freedom, and gives a best-fit photon index . An equally acceptable fit was obtained with a thermal model; however, the fitted temperature is keV and the abundances near zero, effectively mimicking a power law. A fit with a thermal plus a power-law model does not lead to significant improvement. Using the best-fit power law model, the observed 2–10 keV flux is erg cm-2 s-1, and the 1 keV flux is nJy.
A similar result is obtained with Chandra. The ACIS-I spectrum of the jet was extracted in a 38′′ 22′′ elliptical region. In the energy range 0.3–8 keV, about 109 counts were derived, allowing a crude spectral analysis. Again, the model that best-fits the ACIS data is a power law, with and 1 keV flux F nJy. These parameters are consistent with XMM-Newton within the uncertainties. As for the EPIC spectra, a thermal model is again formally acceptable but the fit converges to a temperature keV and near-zero abundances.
In summary, X-ray emission from the jet at 4′ from the core is detected with both XMM-Newton and Chandra. The X-ray spectrum of the jet is better fitted by a flat () power law.
4 Discussion
4.1 The X-ray halo
NGC 6251 is embedded in a diffuse X-ray halo extending 100′′, or 45 kpc from the core. The fitted temperature of the halo, keV, is significantly larger than derived from ROSAT PSPC data, 0.5 keV (Birkinshaw & Worrall 1993). This is not surprising, as NGC 6251 is thought to host a cooling flow in the nuclear region (Birkinshaw & Worrall 1993), which was excluded from our extraction region. Indeed, spectral fits to the EPIC spectrum of the nucleus requires a thermal component with a temperature (Paper I), in agreement with the ROSAT data.
A new result of our analysis is the detection of a hard X-ray component in the spectrum of the halo above 3 keV. The hard tail is best described by a power law, contributing 20% of the total 0.5–10 keV X-ray flux. A thermal model for the X-ray tail is inconsistent with the data. The hard non-thermal component is independently confirmed by an archival Chandra observation.
Inspection of the Chandra image (Fig. 1b) shows that the hard component in the EPIC spectrum cannot be due to the collective contribution of the detected off-axis X-ray point sources. The hard X-ray component is still present in the ACIS data when the point sources are excised. The hard X-ray profile follows closely the soft profile (Fig. 2c), indicating that the hard X-ray emission is related to the galaxy halo.
We thus investigated the possibility that the hard X-ray component could be due to the emission of a population of undetected Low-Mass X-ray Binaries (LMXBs). Based on recent Chandra observations of nearby ellipticals (e.g., NGC 1316, Kim & Fabbiano 2003; NGC 5128, Kraft et al. 2003; NGC 1399, Angelini et al. 2001), this contribution could be substantial. First, we examined the nature of the detected off-axis point sources in Table 1. Using the count rates reported in the Table, and assuming a power law model with and Galactic absorption, we estimate that the threshold X-ray flux in 0.3–8 keV for detecting point sources is erg cm-2 s-1. This corresponds to a luminosity L erg s-1, at least one order of magnitude larger than for LMXBs.
Based on the luminosity functions of field sources from X-ray deep surveys (Kim et al. 2003), in a 4′ radius centered on NGC 6251 we expect 14 4 serendipitous sources at soft X-rays, consistent with our measured rate of 10 sources (Table 1). It is thus likely that the off-axis point sources in Table 1 are field galaxies, although we cannot exclude the possibility that some are Ultra-Luminous X-ray sources, which indeed were found in other ellipticals (e.g., Jeltema et al. 2003).
If a population of LMXBs is indeed present in NGC 6251, it is undetected in our XMM-Newton and Chandra images. However, its presence could affect the integrated spectrum. To check for this, we added a new component to the best-fit model in Sect. 3.1 mimicking the integrated contribution of the LMXBs. Following Kim & Fabbiano (2003), we modeled this component with either a steep () power law, or a keV thermal model. The addition of either the power law or thermal does not improve the fit to the halo spectrum. Moreover, the spectral parameters of the best-fit model components (Sect. 3.1) are basically unaffected.
An independent indicator of the relative contribution of LXMBs to the X-ray emission of the galaxy is given by the ratio of the X-ray-to-optical luminosities, , where is in solar units. Kim et al. (1992) showed that the LMXB contribution decreases with increasing . For NGC 6251, we derive 32.3, which according to Kim et al. (1992) indicates that the LMXB contribution to the hard X-ray emission is negligible. This is confirmed by the later analysis of Matsumoto et al. (1997), who analyzed ASCA observations of 12 early-type galaxies. The X-ray halo luminosity of NGC 6251 is two orders of magnitude larger than predicted by the relationship in Fig. 6 of Matsumoto et al. (1997). We assumed the halo luminosity given in Sect. 3.1, and an optical magnitude mag (de Vaucouleurs et al. 1991). Based on this evidence, we conclude that it is unlikely that the hard X-ray tail in the EPIC spectrum of the NGC 6251 halo is due mostly to unresolved LMXBs.
The low abundances we detect for the halo are puzzling. While in some sources (e.g., NGC 1316; Kim & Fabbiano 2003) they seem to be related to LMXB contamination of the integrated diffuse emission, this is not the case for NGC 6251. Deeper X-ray observations designed to probe the structure of the diffuse thermal emission are needed.
We explored alternative origins for the hard X-ray component. There are theoretical reasons to believe that non-thermal halos should be present in clusters/groups containing radio galaxies, as the latter are important sources of energetic particles (e.g., Ensslin et al. 1997). The energy stored in intergalactic magnetic fields can be large and will last long after the activity in the nucleus is turned off (Kronberg et al. 2001), heating the ICM through dissipation processes. Interestingly, in NGC 6251 the 35′′ halo temperature, 1.6 keV, is hotter than in other “normal” giant elliptical galaxies (e.g., Xu et al. 2002) and to other less powerful radio galaxies (e.g., NGC 4261; Gliozzi et al. 2003b), where keV. This lends credit to the idea that the AGN can inject particles and energy heating the ISM.
The hard component detected in NGC 6251 is similar to the one previously observed with ASCA in the nearby group of galaxies HCG 62 (Fukazawa et al. 2001). The latter authors find that either a power law with photon index , or a very hot ( keV) bremsstrahlung best-fits the data at energies 4 keV, in both cases accounting for 20% of the total 0.5–10 keV flux of the halo. Fukazawa et al. (2001) conclude that the most likely origin of the hard X-ray component is either inverse Compton scattering of the Cosmic Microwave Background photons (IC/CMB) on a population of low-energy () electrons, if the magnetic field of the ICM is less than Gauss, or non-thermal bremsstrahlung from a population of energetically important relativistic electrons. More recently, non-thermal diffuse emission was detected in a deep Chandra image of the distant (=3.8) radio galaxy 4C 41.17 (Scharf et al. 2003), and interpreted as IC on the local CMB and FIR radiation fields.

Following Fukazawa et al. (2001), a possible origin for the X-ray tail in NGC 6251 is IC/CMB off a population of old electrons. This possibility is particularly attractive considering that NGC 6251 has an active radio core and a long jet which disrupts at 4′ from the core, where diffuse X-ray emission is detected. If the jet magnetic field is disrupted and becomes unable to confine the electrons, the latter could have escaped and diffused in the ICM of the galaxy. The relativistic electrons would then lose energy via IC scattering of the CMB photons, whose energy density at the redshift of NGC 6251 is non-negligible (see below).
However, the very flat slope of the hard X-ray component we measure from both XMM-Newton and Chandra spectra, (albeit with large uncertainties), posits a problem for the IC/CMB interpretation. In fact, this implies that the minimum Lorentz factor of the scattering electrons is large, . We would thus be observing the low-energy Compton tail emission (characterized by a spectral slope ) from a very energetic electron population.
Kronberg et al. estimate for NGC 6251 a minimum total energy content of the X-ray halo of ergs and a minimum halo magnetic field of Gauss. An immediate consequence of such large magnetic field and energetic electrons is that one should observe large radio fluxes from the halo.
A deep 326 MHz Westerbork Synthesis Radio Telescope (WSRT) map (Mack et al. 1997b) shows no obvious sign of such a radio halo surrounding this galaxy. The only diffuse emission in the image is detected in the actual radio lobes near the edges of the source. We estimate an integrated flux limit of 275 mJy (3 sigma) for the halo out to 215′′ (the extent of the XMM-Newton extraction aperture) from measuring the RMS in this region of the digital FITS version 326 MHz map of the Mack et al. (1997b) which was available to download from DRAGN web-site222J. P. Leahy, A. H. Bridle, & R. G. Strom, http://www.jb.man.ac.uk/atlas/. Fig. 4 shows the plot of the predicted synchrotron flux at 326 MHz versus the halo magnetic field for two different values of the radio spectral index. In this calculation we assume that the observed hard X-ray power-law is due to the low-energy tail of electrons at . Above an energy keV the (unobserved) emission would be a power-law with slope , produced by electrons with . In order to reproduce the observed radio flux (horizontal dotted line), a magnetic field 10Gauss is required. This is a factor 10 or more smaller than generally measured for radio galaxies (Feretti et al. 1995). However, measurements of rich clusters with BeppoSAX and RXTE suggest that intergalactic magnetic fields can be very weak (e.g., Valinia et al. 1999). Note that, however, for magnetic fields below G, if electrons have a high energy cut-off at the maximum frequency of the synchrotron emission will be located below MHz. Therefore if the high-energy non-thermal electron population has a narrow electron distribution, , the synchrotron emission would be unobservable at 300 MHz even with moderately low magnetic fields, G. A similar solution (IC/CMB scattering off low-energy electrons, emitting synchrotron radiation well below the observed frequencies) was independently proposed for the high-redshift () quasar GB1508+5714, where an X-ray halo with no radio counterpart was recently detected (Yuan et al. 2003).
Alternatively, as discussed by Fukazawa et al. (2001) for HCG 62, the X-ray tail could be due to non-thermal bremsstrahlung involving subrelativistic but suprathermal electrons (e.g., Kempner & Sarazin 2000). Assuming the ratio of thermal to non-thermal luminosity of 0.2, Fukazawa et al. derive that the energy density of non-thermal electrons would be 0.6 times that of thermal electrons. Similar conclusions apply in the case of NGC 6251, where the non-thermal component accounts for a similar fraction of the diffuse X-ray flux. Kempner & Sarazin (2000) discuss a model where the non-thermal X-ray tail in the cluster Abell 2199 is produced by a population of electrons distributed in energy as a power law of index . For a steep distribution ( 3.5), the X-ray tail can be approximated by a power law with . In our case, we would derive , implying the presence of a large number of very energetic electrons. As these electrons would lose energy via synchrotron, again one would expect to observe diffuse radio emission.
In summary, we find evidence for the presence of a non-thermal high-energy tail in the halo of NGC 6251 with both XMM-Newton and Chandra. The physical origin of this component, however, is not clear. A possible explanation - IC/CMB off electrons in the halo - implies very weak magnetic fields. Non-thermal bremmstrahlung requires the presence of a large number of very energetic electrons.
4.2 The X-ray jet
The EPIC and ACIS data confirm the previous findings from ROSAT that the outer jet emits X-rays. The X-ray spectrum of the jet is best described by a power law with , while a thermal model is formally ruled out by the data. Fig. 5 shows the radio-to-X-ray spectral energy distribution of the jet. The radio flux at 1.4 GHz was measured (see above) using the archival VLA image and an extraction region similar to the EPIC extraction region. The radio spectrum between 1.4 and 5 GHz throughout the jet was determined to be by Perley et al. (1984). We adopted this spectrum and used our 1.4 GHz measurement to calculate representative flux values at 1.66 and 4.885 GHz for the region of interest. The open bowtie represents the best-fit EPIC spectrum. Extrapolating the radio spectrum to the X-ray region (dotted line in Fig. 5) overestimates the X-ray flux by more than 2 orders of magnitude. Moreover, the X-ray spectrum is much flatter than the lower-energy extrapolation. This suggests that the X-ray emission is not the high-energy tail of the synchrotron responsible for the longer wavelengths, and that a different spectral component is needed to account for the X-rays.

Based on the ROSAT PSPC detection, Mack et al. (1997a) argue in favor of a thermal origin for the X-ray emission. However, a thermal origin for the X-ray emission is ruled out independently by the EPIC and ACIS spectra (see Sect. 3.2). We also note that there is no evidence for internal depolarization from the radio (Perley et al. 1984). This makes a thermal origin for the X-rays unlikely. However, vis-a-vis the limited signal-to-noise ratio of the EPIC/ACIS spectra, the possibility that at least a fraction of the X-rays are due to thermal emission from ambient gas remains open.
A likely possibility is inverse Compton (IC) scattering. Seed photons for IC can be provided by 1) the synchrotron photons themselves (SSC process); 2) the beamed emission from the inner jet; 3) the isotropic emission of the AGN; and 4) the Cosmic Microwave Background radiation (CMB). At a projected distance of 94 kpc from the nucleus, the Narrow Line Region and dusty torus are not a significant source of photons.
We compared the radiation densities (in the blob comoving frame) at the blob location for processes 1–4 in order to evaluate the dominant source of photons. The SSC luminosity was obtained integrating the radio spectrum in Fig. 5 up to Hz, erg s-1. Assuming a size for the X-ray emission region of 10′′ (the EPIC resolution), the synchrotron radiation density is erg cm-3. Here is the jet Doppler factor, defined as , with the jet Lorentz factor, the plasma speed, and the jet inclination to the line of sight.
The contribution from the inner jet (e.g., Celotti et al. 2001) can be evaluated as erg cm-3, where is the typical observed luminosity of blazars (e.g., Ghisellini et al. 1998) and is the Lorentz factor of the inner jet.
For the AGN luminosity, we used the bolometric luminosity from Paper I, erg s-1. At the location of the X-ray jet, the radiation density due to the isotropic radiation of the AGN is erg cm-3.
The CMB radiation density scales like and . We find erg cm-3. This is at least 2 orders of magnitude larger than , , and . Thus, the CMB is the dominant source of seed photons for the IC process. Note that assuming significant beaming increases the importance of and decreases that of the other processes.

To examine this in more detail, we plot in Fig. 6 the relationship between the Doppler factor, , and the magnetic field, , for the IC/CMB process (dashed line), the SSC process (continuous line), and the equipartition condition (dotted line). Assuming equipartition, the IC/CMB process accounts for the X-ray emission of the outer jet if and Gauss. Unless the magnetic field is extremely small (Gauss), SSC requires de-beaming.
Assuming the equipartition magnetic field, the radiative time of the synchrotron electrons at 1.4 GHz is yr. This is much larger than the light crossing time of the radio/X-ray emission region, yr, accounting for the diffuse morphology at radio and X-rays.
The assumption of IC/CMB in equipartition requires a strongly beamed () jet at 3.5′ (so at least 93.7 kpc) from the core. For a jet inclination 30∘, as expected from unifying schemes (e.g., Urry & Padovani 1995), this implies large Lorentz factors for the emitting plasma. Alternatively, weaker beaming () is allowed for a magnetic field at least one order of magnitude away from equipartition (Fig. 6).
We thus explored other possibilities accounting for the concave radio-to-X-rays spectrum in jets, such as the model proposed by Dermer & Atoyan (2002). The latter authors interpret the continuum from radio to X-rays as synchrotron emission from a single electron distribution, whose shape, due to the different IC cooling rate suffered by electrons with different energies, produces the optical “valley”. The model assumes that the electron cooling is dominated by IC scattering of the CMB photons. Low-energy electrons scatter the CMB in the Thomson limit, while the scattering by high-energy electrons, with Lorentz factor above , will be suppressed by the Klein-Nishina decline of the cross section. Due to the low cooling rate of the high-energy electrons, the resulting electron energy distribution will be characterized by a flattening, at large Lorentz factors, which in turn produces a “bump” in the synchrotron spectrum.

We have calculated the expected spectrum implementing the simple analytical formulas provided by Dermer & Atoyan (2002). We have assumed that the emission is very weakly beamed (). The result is presented in Fig. 7. Note that, due to the assumed dominance of IC losses, the magnetic field is constrained to be less than G (assuming no beaming). In our case this implies that the emitting plasma is strongly far from equipartition, since the number of electrons required to produce the observed flux implies erg cm-3 (weakly dependent on the minimum Lorentz factor ).
To conclude, we cannot identify a simple viable way to account for the observed X-ray emission from the jet, since all the possibilities explored above present important difficulties. However, it seems possible to conclude that the jet is not confined by the external gas. In fact, assuming a halo size of 200′′ or cm, the density of the gas is cm-3, implying a gas pressure of erg cm-3. If the plasma in the jet is not too far from equipartition with the magnetic field (see dotted line in Fig. 6), this value is smaller than or very close to the pressure inside the jet. On the other hand, even if the magnetic field is well below equipartition, the pressure of the relativistic electrons necessary to account for the observed X-ray emission, both in the IC/CMB model and in the Dermer & Atoyan model, is much larger then the pressure in the external gas. We conclude the X-ray jet is overpressured with respect to the external medium, and cannot be confined by the halo, in agreement with previous findings based on ROSAT (Mack et al. 1997a, Birkinshaw & Worrall 1993).
5 Summary
We presented a 40 ks XMM-Newton EPIC observation of the giant elliptical NGC 6251, host of an FRI/II radio galaxy. An archival 25 ks Chandra exposure was also used. Our results can be summarized as follows:
-
•
X-ray emission from the region of the 4′ jet is detected, as well as diffuse emission from the galaxy’s halo.
-
•
The X-ray spectrum of the halo is described by a thermal model with temperature keV and sub-solar abundances, .
-
•
A hard X-ray component is required to fit the EPIC spectrum of the halo above 3 keV. This component is best described by a very flat, power law, accounting for 20% of the total 0.5–10 keV flux. The hard component is also independently confirmed by the Chandra exposure.
-
•
The physical origin of the hard X-ray tail in the halo is not clear. We argue that contribution from a population of faint Low Mass X-ray Binaries in unlikely. If due to IC/CMB, the weak diffuse radio emission and the X-ray flux imply a very low magnetic field, Gauss, or a very narrow energy distribution of the high-energy electrons. Non-thermal bremsstrahlung from subrelativistic particles implies the presence of a large number of energetic electrons.
-
•
The jet X-ray spectrum is described by a power law with photon index . The thermal model advocated on the basis of previous ROSAT data (Mack et al. 1997a) is formally ruled out by the EPIC and ACIS data. However, based on the limited signal-to-noise ratio of both datasets, the possibility that a fraction of the jet X-ray emission is thermal remains open.
-
•
An IC/CMB interpretation of the jet X-ray emission implies strong beaming () at equipartition. Alternatively, weak beaming is possible if the magnetic field in the jet is more than one order of magnitude below equipartition. A similar conclusion holds from the Dermer & Atoyan (2002) model.
Appendix: X-ray point sources in the Chandra field
A glance at the Chandra image reveals the presence of several point
sources in the field of the target. We used the CIAO tool
wavdetect to search for serendipitous X-ray sources in the
field of view. In the algorithm, the parameter scale (a list of radii,
in image pixels, of Mexican Hat wavelet functions) was left free to
range between 1 and 16, and the parameter threshold (the number
of detected spurious sources in a pixel map) held fixed at
. The algorithm returns a list of elliptical regions that
define the positions and the shapes of the detected sources. We next
used the coordinates from wavdetect and its associated error
regions to search for their optical counterparts on ESO archival
plates. We used circular search regions with radii of 5′′ because it is known that most reprocessed ACIS-I observations have an
offset of up to 1.5′′. 333See the memo on astrometry
problems at http://cxc. harvard.edu/mta/ASPECT/improve_astrometry.html
The properties of the point sources are listed in Table 1.
| R.A. | DEC. | X | Y | Rate (c/s) | Notes |
|---|---|---|---|---|---|
| 248.09961 | 82.47877 | 4177 | 3596 21.02 | 4.69 | |
| 247.97225 | 82.48873 | 4299 | 3669 13.75 | 3.74 | (a) |
| 247.80649 | 82.54228 | 4455 | 4062 5.83 | 2.45 | |
| 247.67471 | 82.53810 | 4580 | 4032 34.00 | 5.92 | |
| 248.36962 | 82.53544 | 3920 | 4011 4.80 | 2.24 | |
| 248.33852 | 82.53210 | 3949 | 3986 16.65 | 4.12 | |
| 248.25310 | 82.52024 | 4030 | 3899 5.80 | 2.45 | |
| 248.23887 | 82.52276 | 4044 | 3918 4.81 | 2.24 | |
| 248.51997 | 82.51474 | 3776 | 3860 4.87 | 2.24 | (b) |
| 248.16867 | 82.57664 | 4111 | 4312 7.68 | 2.83 |
Columns: 1=Right Ascension at J2000; 2=Declination at J2000;
3, 4=Physical Coordinates on the detector; 5=Count rate and error in the
energy range 0.3–9 keV.
(a) optically identified, U1650-01867603, RA=247.9735,
DEC=+82.48894, =17.5 mag, =19.0 mag, offset from X-ray source =0.016′.
(b) optically identified, U1725-00533708 (NGC 6252), RA=248.16904,
DEC=+82.57678, =9.2 mag, =11.4 mag, offset from X-ray source =0.008′.
Outside the extraction radius of 4′ there are two more optically
identified sources:
(c1) U1650-01870981 , RA=248.63446,
DEC=+82.48589, =12.1 mag, =12.6 mag;
(c2) U1725-00532074 (2MASS J16290730+8231573), RA=247.27754,
DEC=+82.53217, =15.5 mag, =16.6 mag.
Acknowledgements.
We thank the referee for useful suggestions which improved the discussion session. RMS, MG, and DD are funded through NASA grants NAG5-10038, NAG5-10073, and LTSA NAG5-10708. In addition, RMS gratefully acknowledges support from an NSF CAREER award and from the Clare Boothe Luce Program of the Henry Luce Foundation. Radio astronomy at Brandeis University is supported by the NSF. Further support to CCC by NASA grant GO2-3195C from the Smithsonian Observatory is gratefully acknowledged.References
- (1) Angelini, L., Loewenstein, M., & Mushotzky, R. 2001, ApJ, 557, 35
- (2) Birkinshaw, M. & Worrall, D.M. 1993, ApJ, 412, 568
- (3) Bridle, A. H. & Greisen, E. W. 1994, AIPS Memo 87 (NRAO: Charlottesville)
- (4) Celotti, A., Ghisellini, G., & Chiaberge, M. 2001, MNRAS, 321, L1
- (5) Dermer, C.D. & Atoyan, A.M. 2002, ApJ, 568, L81
- (6) Dickey, J.M. & Lockman, F.J. 1990, ARAA, 28, 215
- (7) Donato, D., Gliozzi, M., Sambruna, R.M., & Pesce, J.E. 2003, A&A, 407, 503
- (8) Ensslin, T.A., Biermann, P.L., Kronberg, P.P., & Wu, X.-P. 1997, ApJ, 477, 560
- (9) Fanaroff, B. L. & Riley, J. M. 1974, MNRAS, 167, 31P
- (10) Feretti, L., Dallacasa, D., Giovannini, G., & Tagliani, A. 1995, A&A, 302, 680
- (11) Ferrarese, L., & Ford, H.C. 1999, ApJ, 515, 583
- (12) Fukazawa, Y. et al. 2001, ApJ, 546, L87
- (13) Ghisellini, G. et al. 1998, MNRAS, 301, 451
- (14) Gliozzi, M., Sambruna, R.M., Brandt, W.N., Mushotzky, R.F., & Eracleous, M. 2003a, A&A, in press (Paper I) (astro-ph/0309632)
- (15) Gliozzi, M., Sambruna, R.M., & Brandt, W.N. 2003b, A&A, 408, 949
- (16) Jeltema, T.E., Canizares, C.R., Buote, D.A., & Garmire, G.P. 2003, ApJ, 585, 756
- (17) Keel, W.C. 1988, ApJ, 329, 532
- (18) Kempner, J.C. & Sarazin, C.L. 2000, ApJ, 530, 282
- (19) Kim, D.-W. & Fabbiano, G. 2003, ApJ, 586, 826
- (20) Kim, D.-W. et al. 2003, ApJ, in press (astro-ph/0308493)
- (21) Kim, D.-W., Fabbiano, G., & Trinchieri, G. 1992, ApJ, 393, 134
- (22) Kraft, R.P. et al. 2003, ApJ, 592, 129
- (23) Kronberg, P.P., Dufton, Q.W., Li, H., & Colgate, S.A. 2001, ApJ, 560, 178
- (24) Mack, K.-H., Kerp, J., & Klein U. 1997a, A&A, 324, 870
- (25) Mack, K.-H., Klein, U., O’Dea, C. P., & Willis, A. G. 1997b, A&AS, 123, 423
- (26) Matsumoto, H., Koyama, K., Awaki, et al. 1997, ApJ, 482, 133
- (27) Perley, R.A., Bridle, A.H., & Willis, A.G. 1984, ApJS, 54, 291
- (28) Scharf, C. et al. 2003, ApJ, in press (astro-ph/0306314)
- (29) Shepherd, M. C., Pearson, T. J., & Taylor, G. B. 1994, BAAS, 26, 987
- (30) Thompson, A. R., Clark, B. G., Wade, C. M., & Napier, P. J. 1980, ApJS, 44, 151
- (31) Urry, C.M. & Padovani, P. 1995, PASP, 107, 803
- (32) Valinia, A. et al. 1999, ApJ, 515, 42
- (33) de Vaucouleurs, G., de Vaucouleurs, A., Corwin Jr., et al. 1991, Third Reference Catalogue of Bright Galaxies, v. 3.9
- (34) Waggett, P.C., Warner, P.J., & Baldwin, J.E. 1977, MNRAS, 181, 465
- (35) Werner, P. N. 2002, Ph.D. Thesis, University of Bristol
- (36) Werner, P. N., Worrall, D. M., & Birkinshaw, M. 2001, eds. R. A. Laing & K. M. Blundell, in Particles and Fields in Radio Galaxies, ASP Conf. Ser. 250, 294
- (37) Worrall, D.M., Birkinshaw, M., & Hardcastle, M. 2001, MNRAS, 326, L7
- (38) Xu, H. et al. 2002, ApJ, 579, 600
- (39) Young, P.J., Sargent, W.L.W., Kristian, J., & Westphal, J.A. 1979, ApJ, 234, 76
- (40) Yuan, W., Fabian, A.C., Celotti A., Jonker P.G., 2003, MNRAS, in press (astro-ph/0309318)