Mid-infrared spectral evidence for a luminous dust enshrouded source in Arp 220 ††thanks: Based on observations with ISO, an ESA project with instruments funded by ESA Member States (especially the PI countries: France, Germany, the Netherlands and the United Kingdom) and with the participation of ISAS and NASA
We have re-analyzed the 6–12 m ISO spectrum of the ultra-luminous infrared galaxy Arp 220 with the conclusion that it is not consistent with that of a scaled up version of a typical starburst. Instead, both template fitting with spectra of the galaxies NGC 4418 and M 83 and with dust models suggest that it is best represented by combinations of a typical starburst component, exhibiting PAH emission features, and a heavily absorbed dust continuum which contributes 40% of the 6–12 m flux and likely dominates the luminosity. Of particular significance relative to previous studies of Arp 220 is the fact that the emission feature at 7.7 m comprises both PAH emission and a broader component resulting from ice and silicate absorption against a heavily absorbed continuum. Extinction to the PAH emitting source, however, appears to be relatively low. We tentatively associate the PAH emitting and heavily dust/ice absorbed components with the diffuse emission region and the two compact nuclei respectively identified by Soifer et al. (Soifer02 (2002)) in their higher spatial resolution 10 m study. Both the similarity of the absorbed continuum with that of the embedded Galactic protostars and results of the dust models imply that the embedded source(s) in Arp 220 could be powered by, albeit extremely dense, starburst activity. Due to the high extinction, it is not possible with the available data to exclude that AGN(s) also contribute some or all of the observed luminosity. In this case, however, the upper limit measured for its hard X-ray emission would require Arp 220 to be the most highly obscured AGN known.
Key Words.:
Galaxies: individual: Arp220 — Galaxies: ISM — Galaxies: nuclei — Galaxies: starburst — Infrared: galaxies1 Introduction
The galaxy Arp 220 (IC 4553; cz=5450 km/s; D=73 Mpc) was originally classified by Arp (Arp66 (1966)) as a “galaxy with adjacent loops”. Its optical image (1 = 352 pc) shows faint structures, reminiscent of tails or loops, suggesting it to be the remnant of a recent galaxy merger (Toomre & Toomre Toomre72 (1972)). IRAS (1983) increased interest in Arp 220 through the discovery of its far-IR luminosity and infrared-to-blue ratio which characterized it as an extreme member of the “unidentified infrared sources” discovered during the mission (Houck et al. Houck84 (1984); Soifer et al. Soifer84 (1984)). When later the spectroscopic redshifts of these “unidentified infrared sources” became available, Arp 220 turned out to have a similarly large infrared luminosity (1.35 1012 L⊙), making it the nearest member (by a factor of 2) of the new class of UltraLuminous InfraRed Galaxies (ULIRGs; Sanders et al. Sanders88 (1988)), with L1012 L⊙. Numerous studies across all wavebands have since examined Arp 220 in close detail, also showing this nearest ULIRG to be unusual in some aspects rather than being typical for the class.
Like most other ULIRGs, Arp 220 is the product of the interaction of two gas-rich disk galaxies (Sanders & Mirabel Sanders96 (1996)). Groundbased observations at 10–30 m suggest that its luminosity arises in the innermost 250 pc (Wynn-Williams & Becklin Wynn-Williams93 (1993)). Radio and mm observations reveal its two nuclei to be surrounded by molecular disks of r100 pc, which counterrotate with respect to each other (Sakamoto et al. Sakamoto99 (1999)). The eastern nucleus seems to be embedded within an outer gas disk of r1 kpc, which rotates in the same sense. The western nucleus is connected to the eastern nucleus by a thin gas bridge, traced in absorption, and appears to lie above the outer gas disk (Mundell et al. Mundell01 (2001)). The projected separation of the two nuclei amounts to 345 pc (0.98; Baan & Haschick Baan95 (1995)). High sensitivity VLBI observations disclose the presence of multiple compact radio sources dispersed over the two nuclei. The knots are consistent with free-free emission from luminous radio supernovae expanding in a dense medium (Smith et al. Smith98 (1998, 1999)).
At shorter wavelengths (in the UV, optical and near-IR) the view towards the nuclear components is greatly impaired by strong dust extinction of at least AV=30–50 (Sturm et al. Sturm96 (1996)). In the mid-IR, the dust opacity (Aλ) is a factor of 10–100 less than at optical wavelengths and Smith et al. (Smith89 (1989)) used this property to study the nature of the central power source in Arp 220 in the 8–13 m (N-band) and 17–22 m (Q-band) atmospheric windows. Based on the weakness of the 11.2 m PAH emission band within the deep 9.7 m silicate absorption feature, they concluded that only 2–10% of the total infrared luminosity is powered by starburst activity, with an obscured AGN responsible for the rest. Further analysis of the 9.7 m silicate absorption feature led Dudley & Wynn-Williams (Dudley97 (1997)) to conclude, however, that the obscured power source resembles a scaled-up embedded protostar.
Not limited to the mid-IR atmospheric windows, ISO spectroscopy revealed two pronounced spectral features in the previously unstudied 5–8 m range. In line with ISO observations of Galactic star forming regions, the two features were identified as the 6.2 m and 7.7 m PAH emission bands (Genzel et al Genzel98 (1998)). Using the ratio of 7.7 m PAH emission to the underlying 7.7 m continuum as a criterium to discern starburst- and AGN-dominated galaxies, Genzel et al. (Genzel98 (1998)), Lutz et al. (Lutz98 (1998)), Spoon et al. (Spoon98 (1998)), Rigopoulou et al. (Rigopoulou99 (1999)) and Tran et al. (Tran01 (2001)) classified Arp 220 as starburst-dominated. High angular resolution groundbased N-band spectroscopy has since shown the 11.2 m PAH emission in the nuclear region to be diffusely distributed over the central 2 and the starburst associated with the PAH emission not to be able to account for more than 10–50% of the bolometric luminosity (Soifer et al. Soifer02 (2002)). In summary, the mid-IR low-resolution spectral diagnostics appear mostly starburst-like but star formation appears quantitatively insufficient to account for the bolometric luminosity, unless strongly obscured or otherwise modified. The same is, to a lesser degree, true for the more direct tracing of starburst activity by mid-IR fine-structure lines. The ratio of 1/37 of starburst ionizing luminosity and bolometric luminosity, derived by Genzel et al. (Genzel98 (1998)) for this source, is about a factor 2 less than in comparison starbursts.
Since Arp 220 is often regarded as a nearby template for dusty galaxies at high redshift undergoing vigorous star formation (e.g. faint SCUBA sources), it is imperative to clearly identify its power source(s). Despite the quantitative problems with the starburst origin for the luminosity, alluded to above, the general consensus since ISO has been massive young stars (Genzel & Cesarsky Genzel00 (2000)). However, the infrared luminous galaxy NGC 4945, which shows no outward evidence for an active galactic nucleus even in ISO observations (Genzel et al. Genzel98 (1998); Spoon et al. Spoon00 (2000)), has turned out to contain a heavily obscured AGN visible only in hard X-rays (Iwasawa et al. Iwasawa93 (1993); Done et al. Done96 (1996); Guainazzi et al. Guainazzi00 (2000)). For Arp 220, BeppoSAX and Chandra observations do not detect a similar hard X-ray source (Iwasawa et al. Iwasawa01 (2001); Clements et al. Clements02 (2002)). The only possibility for an energetically significant AGN to exist in Arp 220 would therefore be in the form of a deeply embedded source, hidden behind a ‘Compton-thick’ shell of N1025 cm-2 with a covering factor close to unity (Iwasawa et al. Iwasawa01 (2001)). The presence of huge amounts of molecular gas in the central parts (1010 M⊙; Scoville et al. Scoville97 (1997); Sakamoto et al. Sakamoto99 (1999)) indicates that sufficient obscuring material is indeed at hand. And the very large 850 m dust-continuum flux to 7.7 m PAH flux (Haas et al. Haas01 (2001)) could mean that the luminosity of this embedded source is redistributed into the far-IR.
2 The infrared spectrum of Arp 220
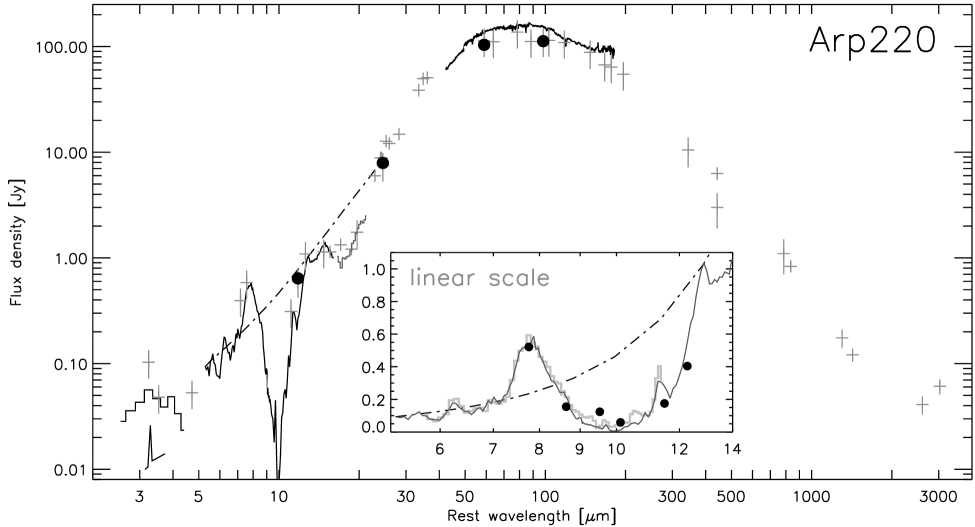
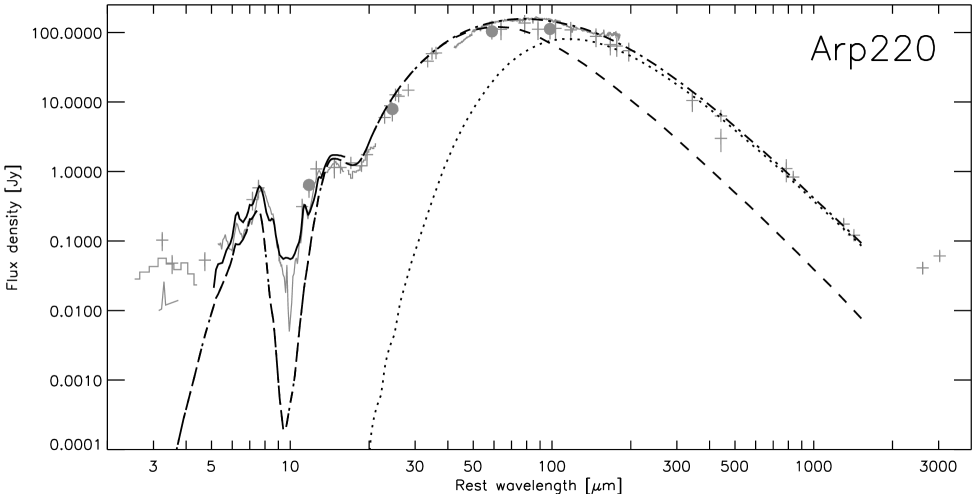
The 2–3000 m spectral energy distribution of Arp 220 (Fig. 1) is characterised by a steeply rising dust continuum, setting in around 4–5 m, and leading up to a remarkably strong far-IR flux peak at 60–100 m. The most prominent features in the infrared spectrum are the silicate absorption features at 9.7 m and 18 m and a broad flux peak at 7.8 m.
2.1 The mid-IR spectrum of Arp 220
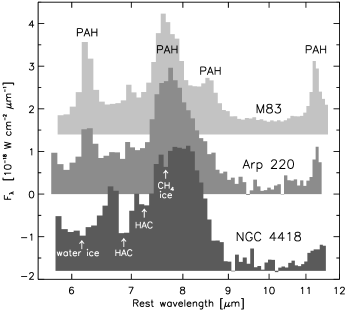
In Fig. 2 we compare the mid-IR spectra of Arp 220, NGC 4418 and the central region of the starburst galaxy M 83. At first sight the three spectra look quite similar. The spectral structure in the spectrum of NGC 4418 is, however, the product of strong ice and silicate absorptions (Spoon et al. Spoon01 (2001)), whereas the spectrum of M 83 is dominated by the commonly observed emission bands of Polycyclic Aromatic Hydrocarbons (PAHs). The spectrum of Arp 220 shows characteristics of both: PAH emission is readily detected at 6.2 m and 11.2 m (and in the groundbased 3 m spectrum; Imanishi & Dudley Imanishi00 (2000)), while absorptions from water ice and silicates are found at 6.0 m and 9.7 m, respectively (Spoon et al. Spoon02 (2002)). The strongest feature in the spectrum, peaking at 7.7 m, has been previously attributed exclusively to PAH emission. On closer inspection, however, the feature seems to be a blend of a 7.7 m PAH emission feature and a continuum peak resulting from absorption by ice on the short wavelength side and silicates on the long wavelength side.
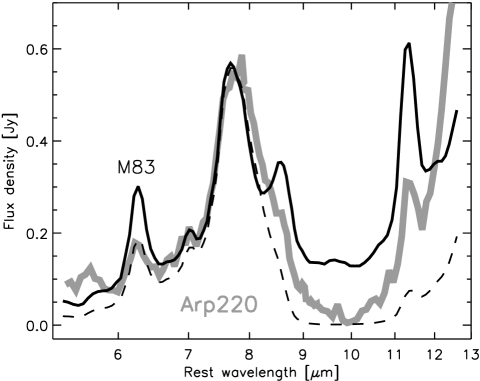
Close comparison of the 7.7 m feature in the spectrum of Arp 220 with the 7.7 m PAH feature in the spectrum of the starburst galaxy M 83 (Fig. 3) shows that the 7.7 m feature in Arp 220 is quite broad. Moreover, the ratio of the 7.7 m peak to the 6.2 m and 11.2 m PAH bands is very large in Arp 220 compared to other sources (cf. Fig. 3). The profile of 7.7 m PAH emission bands is, however, known to be very stable over a wide range of integrated galaxy spectra (Helou et al. Helou00 (2000)). Peeters et al. (Peeters02 (2002)) found that Galactic ISM spectra show a similarly stable 7.7 m PAH feature. Only for evolved stars and isolated Herbig AeBe stars are the width and central wavelength of the 7.7 m PAH feature known to vary (Peeters et al. Peeters02 (2002)). These stars are however very unlikely to dominate the spectrum of Arp 220. Therefore, there is no reason to assume that PAH features in Arp 220, if present, should have an intrinsically different shape than in any other galaxy spectrum. Likewise, while the relative strengths of the PAH features are known to vary from source to source, no Galactic or extragalactic sources show such extreme ratios as Arp 220 (Peeters et al. Peeters02 (2002)). Alternatively, the large width of the 7.7 m feature might also be the result of a strong velocity dispersion within the PAH emitting gas (v5000 km/s). A similar velocity broadening is, however, not observed for the 6.2 and 11.2 m PAH features. Strong extinction as a cause for the unusual strength and width of the 7.7 m peak can also be ruled out. This is best illustrated by fitting a starburst spectrum (here: M 83) to the peak of the 7.7 m feature and applying foreground extinction (Fig. 3). The weakness of the 6.2 m PAH feature is reproduced well for a foreground extinction A(V)=105, but the spectrum beyond 8.5 m and the 8.6 m and 11.3 m PAH features are not. While the relative feature strengths depend on the adopted extinction curve (Sect. 3.2), no plausible extinction will be able to widen the 7.7 m feature. We here propose instead the weakness of the 6.2 m PAH feature to be indicative of an unusually small contribution of the family of PAH emission features to the mid-IR spectrum of Arp 220 and the unusual strength and width of the 7.7 m feature to be the result of an underlying mid-IR continuum, peaking strongly near 7.7 m. Evidence in support for this model is presented below.
2.2 Broad 7.7 m feature similar to Mon R2:IRS 1+2
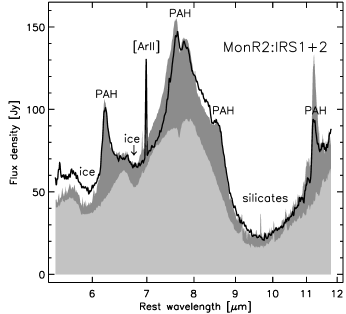
The shape of the 7.7 m feature in Arp 220 appears to be unique among a sample of more than 250 galaxies observed spectroscopically in the 6–12 m range (Spoon et al. in prep.). The feature has, however, a Galactic counterpart: the ISO–SWS spectrum of the combined line of sight to the sources Mon R2:IRS 1+2 (Fig. 4). Mon R2 is a massive Galactic star formation region. Infrared observations show several compact sources and extended emission in the central region of the giant molecular cloud (Beckwith et al. Beckwith76 (1976)). An elliptical ring encloses two IR sources, IRS 1 and IRS 2. IRS 1, with a presumed spectral type of B0 (Downes et al. Downes75 (1975); Howard et al. Howard94 (1994)), is the exciting source of the compact region enclosed by the IR ring (Massi, Felli, & Simon Massi85 (1985)). IRS 2 is still deeply embedded in the molecular cloud and most probably at an earlier stage of formation. Given this confused line of sight, the broad 7.7 m feature in the spectrum of Mon R2:IRS 1+2 may well be the result of the superposition of a strongly absorbed continuum, peaking at 8 m, and a ‘normal’ 7.7 m PAH emission feature. Fig. 4 shows the result of a crude decomposition of the Mon R2:IRS 1+2 spectrum into the ISO–SWS spectra of the embedded protostar NGC 7538:IRS 9 and the reflection nebula NGC 7023. The fit is quite good given the fact that the columns of ices and silicates vary a lot from one embedded protostar to the other. Note that the 8.6 m PAH feature is not suppressed by extinction, but instead stands out as a shoulder on the flank of the 7.7 m feature, filling in the blue wing of the 9.7 m silicate absorption feature.
2.3 Mid-IR continuum similar to NGC 4418
In Fig. 5 we compare the mid-IR spectra of Arp 220 and NGC 4418. The spectrum of NGC 4418 is dominated by strong silicate absorption bands at 9.7 m and 18 m (Roche et al. Roche86 (1986)) and ice absorption bands at 6.0 m (H2O), 6.85 m & 7.25 m (Hydrogenated Amorphous Carbons; HAC) and 7.67 m (CH4) (Spoon et al. Spoon01 (2001)). No mid-IR emission features, including the commonly detected 12.81 m fine structure line, have been detected so far (Spoon et al. Spoon01 (2001); R. Siebenmorgen, unpublished TIMMI2 spectra). A first order estimate for the mid-IR local continuum of NGC 4418 is obtained by fitting a power law through two feature-free “pure continuum” pivots at 8.0 m and 25 m (the dashed continuum in Fig. 5). Another, more conservative choice of continuum, assuming “pure continuum” at 6.7 m and 13 m too, is shown as a dotted line in Fig. 5.
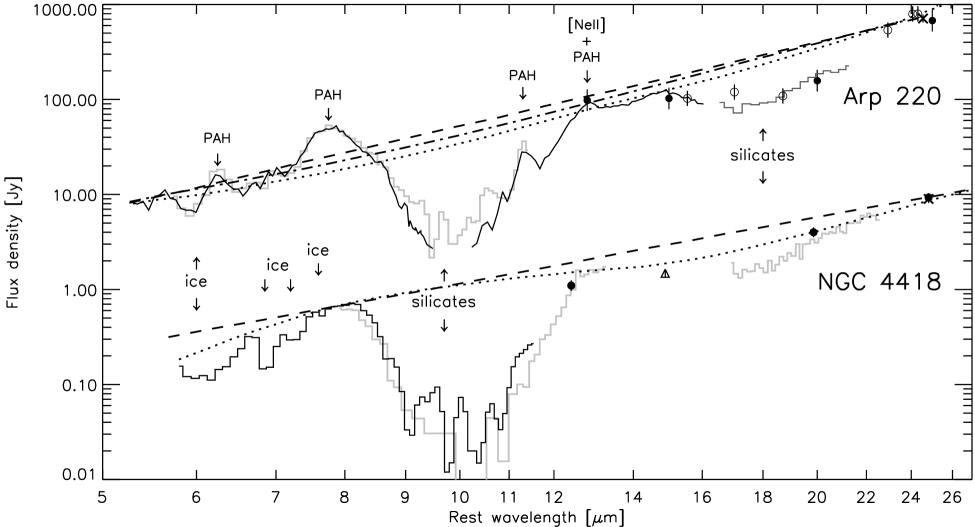
The mid-IR spectrum of Arp 220 (Fig. 5) looks very similar to the pure absorption spectrum of NGC 4418, except for the presence of weak emission features due to PAHs (6.2 m, 7.7 m and 11.2 m), 6.91 m H2 0–0 S(5) and 12.81 m (Sturm et al. Sturm96 (1996); Genzel et al. Genzel98 (1998)). Using the same method as for NGC 4418, we estimate the local continuum in Arp 220 by fitting a power law through two feature-free “pure continuum” pivots at 5.5 m and 25 m (the dashed continuum in Fig. 5). A more conservative estimate for the local continuum is obtained by including “pure continuum” pivots at 6.7 m and 14–15 m as well. This results in the dotted continuum for Arp 220. The dash-dotted continuum in Fig. 5 is a compromise between the two. Note that besides the obvious silicate absorption features at 9.7 m and 18 m all three continua imply the presence of an absorption feature due to water ice, which runs from 5.7 m to 8.0 m (Spoon et al. Spoon02 (2002)). The emission features within this range, 6.2 m PAH, 6.91 m H2 0–0 S(5), 7.7 m PAH and likely (though not targeted by ISO–SWS) 7.0 m , fill up the absorption partially or even turn it into emission.
Given the close similarity of the mid-IR continua of Arp 220 and NGC 4418 and the presence of strong silicate and ice absorption features in both spectra, the mid-IR spectrum of Arp 220 seems to be the superposition of a strongly absorbed continuum and a typical PAH-dominated spectrum. In the next Section we will test this hypothesis by decomposing the mid-IR spectrum of Arp 220 into a PAH-dominated spectrum and an absorbed continuum.
3 Mid-IR spectral decomposition
In order to test the superposition hypothesis, we have fit several combinations of a mid-IR absorbed continuum source and a PAH template to the observed Arp 220 mid-IR spectrum. Our method differs from existing methods (e.g. Tran et al. Tran01 (2001)) by using observed templates instead of model mid-IR continua. The latter usually do not take into account the complex radiative transfer effects due to ices and silicates that give rise to the exotic observed spectral shapes of the continuum sources and hence may fail to reproduce their spectra properly.
3.1 PAH and continuum templates
The absorbed continuum sources span a range of spectral shapes (Fig. 6a), with 6–12 m peak flux wavelengths ranging between 7.7 m for I 03344–2103 and 8.3 m for the Galactic Center (Sgr A∗). All four sources exhibit a strong 9.7 m silicate feature and three of them also show clear signs of ice absorption features. The silicate optical depths range from 1.9111 this is the aparent optical depth, measured from the ISO–SWS spectrum (Fig. 6a). Corrected for silicate emission along the line of sight the true value is 3.60.3 (Roche & Aitken Roche85 (1985)). for Sgr A∗ and 1.9 for IRAS 00183-7111 (Spoon et al. Spoon02 (2002)) to 3.5 for IRAS 03344–2103 and 3.7 for NGC 4418. For the latter, Roche et al. (Roche86 (1986)) claim an even higher value, 7. Judging from the steepness of the blue wing of its silicate feature (Fig. 6a), NGC 4418 may well have the largest dust column of all four absorbed continuum templates.
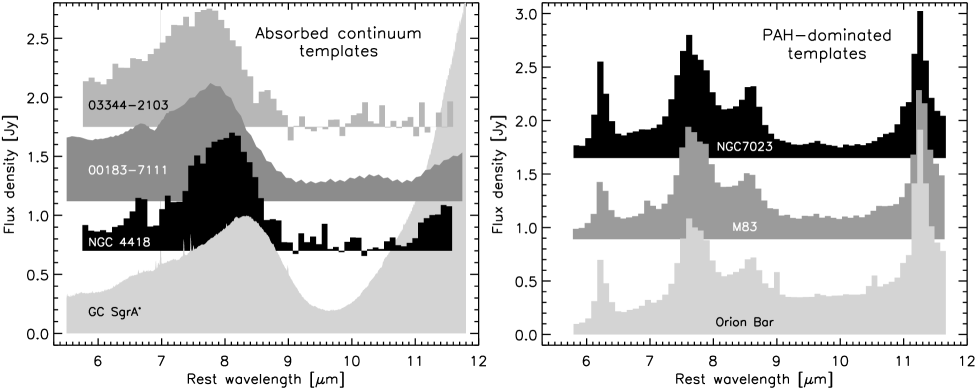
As PAH templates we selected the reflection nebula NGC 7023, the Orion Bar star forming region and the central region of the starburst galaxy M 83. The latter has been preferred over other nearby starburst templates, like M 82 or NGC 253, because its 5–16 m spectrum appears less affected by extinction than the other two galaxy spectra. Together, the three selected PAH templates (Fig. 6b) are meant to cover the full range of spectral shapes from quiescent PDRs to intense star forming regions. Note the large difference in strength of the 9–12 m continuum between the spectra of NGC 7023 and the Orion Bar. The difference is attributed to the presence of hot dust in the Orion region, which is absent in the cold environment of a reflection nebula. In contrast, the PAH spectra are quite similar, except for a somewhat weaker 6.2 m PAH feature relative to the 7.7 m PAH feature in M 83 and a somewhat stronger 11.2 m PAH feature relative to the 7.7 m PAH feature in the Orion Bar spectrum.
3.2 The extinction law at mid-infrared wavelengths
Unlike the extinction law at optical or near-IR wavelengths, surprisingly little is known about the shape and the general applicability of the extinction law at mid-IR wavelengths. Results obtained for different lines of sight vary considerably. A good definition of the shape of the mid-IR extinction law is, however, important for a good decomposition of the Arp 220 spectrum.
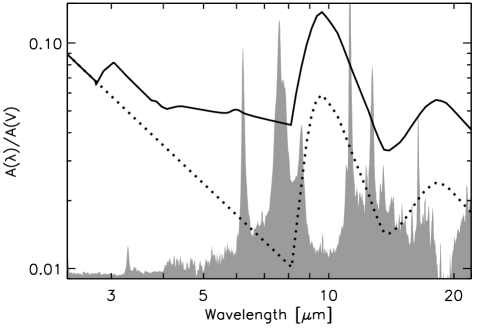
The differences among extinction laws appear largest at 3–8 m. Assuming a standard graphite-silicate mixture, a power law fall-off is expected for this wavelength range (Fig. 7; Draine Draine89 (1989); Martin & Whittet Martin90 (1990)). ISO measurements of molecular hydrogen towards the Orion Peak-1 as well as recombination lines of compact regions support this model (Bertoldi et al. Bertoldi99 (1999); Martín-Hernández et al. Martin03 (2003)). recombination line observations, probing the dusty, complex line of sight to the Galactic center (Sgr A∗), indicate, however, a nearly flat extinction curve between 3 and 8 m (Fig. 7; Lutz Lutz99 (1999)), with Aλ/AV a factor 4 higher at 7 m compared to the extinction law of Draine (Draine89 (1989)). This would point to the presence of larger, fluffier grains in the line of sight to the Galactic center than towards other Galactic sources (e.g. Krügel & Siebenmorgen Kruegel94 (1994)).
Beyond 8 m, the 9.7 and 18 m bands of amorphous silicates dominate the extinction curve. Both the shape (FWHM) and the strength of the bands (both A9.7/AV and A9.7/A18) are reported to vary between different lines of sight (e.g. Fig. 6a) and from observer to observer (Draine Draine89 (1989)). Here we will adopt the astronomical silicate profile of Weingartner & Draine (Weingartner01 (2001)).
In order to explore the effect of differences between mid-IR extinction curves on the spectral decomposition, we here define two extinction curves which should be representative for the range of extinction properties between different lines of sight. The extinction law, which we will refer to as Draine_local, combines the power law fall-off for 8.14 m with a silicate feature of strength A9.6/AV=0.06 typical for the local solar neighbourhood (Roche & Aitken Roche84 (1984)). In contrast, the Lutz_gc extinction law is ‘flat’ from 3–8 m and has a silicate feature strength of A9.6/AV=0.14 (Lutz Lutz99 (1999)). Both extinction laws are shown in Fig. 7
3.3 Decomposition method
For each continuum and PAH template combination we have explored a four parameter space for the best fit to the observed Arp 220 ISO spectrum. The four parameters explored are:
-
•
the contribution of the absorbed-continuum spectrum to the total spectrum
-
•
the contribution of the PAH spectrum to the total spectrum
-
•
the adopted extinction law: either draine_local or Lutz_gc
-
•
the amount of reddening (AV) on the PAH spectrum
For a 2-component model spectrum to give a good fit to the Arp 220 spectrum, the model spectrum has to reproduce several key spectral features which make the Arp 220 spectrum stand apart from other mid-IR galaxy spectra. These key features are, in order of decreasing importance:
-
•
the width of the 7.7 m feature
-
•
the absence of the 8.6 m PAH feature in the red flank of the 7.7 m feature
-
•
the strength of the 11.2 m PAH feature relative to the 7.7 m feature
-
•
the strength of the 6.2 m PAH feature relative to the 7.7 m feature
-
•
the depth of the 9.7 m silicate feature
-
•
the profile of the 6.0 m water ice feature
3.4 Decomposition results
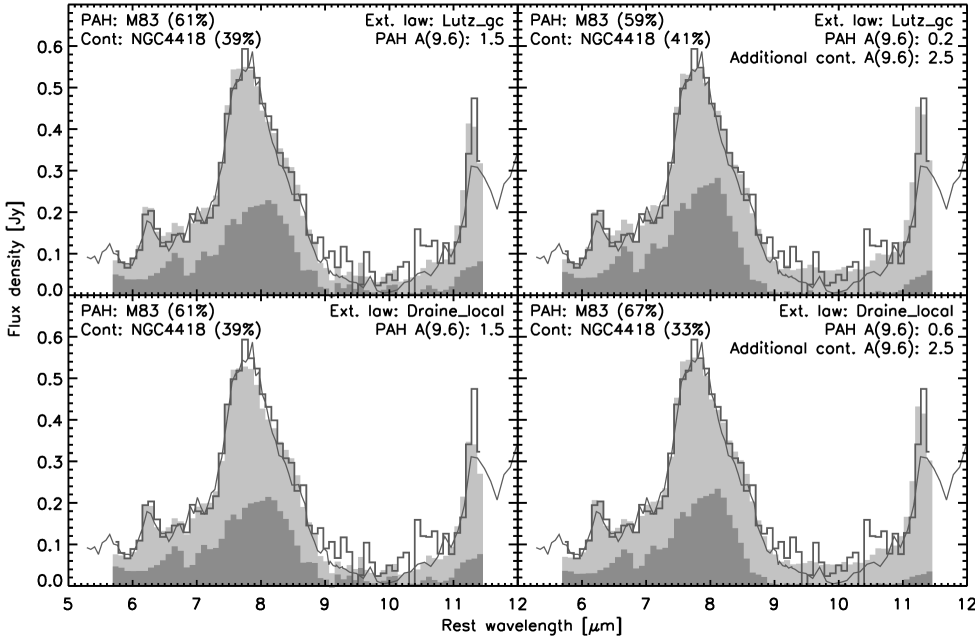
In Fig. 8 we present the best fits to the 6–12 m Arp 220 spectrum. The fits clearly show that an appreciable contribution from a strongly absorbed continuum source (e.g. NGC 4418, or a stronger absorbed version of this spectrum) is required for a good fit to the observed spectral features. Compared to the extinction on the continuum source (3.7), the extinction on the PAH component is minor, ranging from =0.2 to 1.4). At these small obscurations, the choice of extinction law does not play an important role. The best fits further reveal that a direct measurement of the silicate optical depth from the ISO spectrum will be severely hampered by the presence of filled-in emission from the PAH component (see Fig. 8), resulting in a serious underestimation of the true silicate optical depth.
Other combinations of our continuum and PAH templates fail to reproduce key features of the Arp 220 spectrum. Fits involving the continuum templates IRAS 03344–2103 and IRAS 00183–7111, for example, fail to fit the width of the 7.7 m feature, because their continua peak at too short a wavelength (Fig. 6a). The continuum of Sgr A∗, on the other hand, does peak at the right wavelength, but its silicate feature is too shallow and too narrow to leave much room for any contribution from the PAH component to the 8.5–11.5 m fit. Strong extinction will have to be imposed on the PAH component to minimize its contribution to the 8.5–11.5 m fit. This, however, also minimizes the flux in the 11.2 m PAH feature to beyond what is still consistent with the observations. A similar problem exists for the Orion Bar PAH template. Its 10 m continuum is the strongest among the three PAH templates (Fig. 6b) and hence requires an appreciable extinction on its contribution to any Arp 220 fit; too much for a good fit to the 11.2 m PAH feature. PAH template NGC 7023 suffers from the opposite problem. Its continuum is too weak to produce good fits to the Arp 220 spectrum.
Absorptions by ices play an important role in distorting the spectral shape of strongly dust enshrouded sources like NGC 4418 (Spoon et al. Spoon01 (2001); Fig. 6a). Their impact is, however, small for moderately absorbed spectra like the line of sight to Sgr A∗ (Fig. 6a). On the other hand, as the abundance of ices is variable and changes from one Galactic molecular cloud to another, it is useful to assess the impact of an increased water ice abundance on our fits. We therefore ran tests with a Lutz_gc extinction law with five times higher water ice abundance and compared the best fitting parameters to those for the unmodified Lutz_gc extinction law. Only for those template combinations requiring high foreground extinction on the PAH template were the individual parameters found to change noticeably (but 10%). For all other combinations, including our best fits (Fig. 8), the effects turn out to be negligible. Further experiments with an extinction curve supplemented with both the 6 m ice and 6.8 m HAC absorption features show that under these conditions successful fits can be obtained also with an (additionally obscured) Sgr A∗ continuum. This stresses the presence of ice absorptions in the continuum as a key requirement for a successful fit, and one of the reasons why NGC 4418 produces the best results in our original fits.
4 Discussion
Our successful decomposition of the 6–12 m ISO–PHT–S spectrum into a strongly absorbed continuum and a weakly absorbed PAH component confirms our initial suspicion that a) its exotic mid-IR spectrum resembles a blend of the spectra of NGC 4418 and M 83 (Fig. 2) and b) that the only difference between the mid-IR spectra of Arp 220 and a strongly ice- and dust-absorbed source like NGC 4418 is the additional presence of PAH emission features in the spectrum of Arp 220 (Fig. 5).
4.1 Identification of the spectral components
The large difference in obscuration of the two spectral components of our fit indicates that these most likely represent two spatially separate components. Recent high angular resolution N-band spectroscopy of the nuclear region (Soifer et al. Soifer02 (2002)) show the 11.2 m PAH emission and the 11–12 m continuum emission to have clearly different distributions. While the absorbed-continuum emission clearly peaks on the two nuclei, the PAH emission extends over a far wider area and does not peak on either nucleus. We therefore associate our absorbed continuum component with the two nuclei and our PAH component with the region in between and around the two nuclei.
We estimate the infrared luminosity associated with the diffusely distributed PAH component from the observed 6.2 m PAH emission feature by assuming a generic conversion ratio between L(6.2 m PAH) and L(IR) and taking into account the weak obscuration on the 6.2 m PAH feature as indicated by our best 2-component model fits. We derive the L(6.2 m PAH)/L(IR) ratio from our sample of 70 mid-IR ISO spectra of normal and starburst galaxies and obtain a value of 0.0030.001. Assuming this conversion factor applies also to the conditions in the ULIRG Arp 220 and applying it to our four best fitting template combinations (Fig. 8) we find the infrared luminosity associated with the diffuse PAH component to amount to 1.2–2.1 1011 L⊙; 9–15% of the total infrared luminosity of the system. A comparable result is obtained from the peak flux density of the 7.7 m PAH feature, using the empirical conversion factor S(7.7 m PAH)/F(IR)=10-11.84 Jy W-1 m2 for starburst galaxies, determined by Lutz et al. (Lutz03 (2003)). Taking into account the weak obscuration on the 7.7 m PAH feature (ranging from A(7.7 m)=0.07 to 0.49), the implied infrared luminosity is 0.7–1.8 1011 L⊙; 5–13% of the total infrared luminosity of the system. The results from both methods are in complete agreement with the value derived by Soifer et al. (Soifer02 (2002)), who infered a PAH-associated infrared luminosity of 1.2 1011 L⊙ (9% of the total infrared luminosity) from their N-band spectrum. Based on the small scatter between the three different methods, we conclude that the infrared luminosity associated with the diffusely distributed PAH component in Arp 220 amounts to 5–15% of the bolometric luminosity of the system, with some uncertainty due to the trend towards a larger FIR/PAH emission ratio with increasing interstellar radiation field intensity in galaxies (e.g. Dale et al. Dale01 (2001)).
The literature reports the detection in the nuclear region of several near- and mid-IR recombination and fine structure lines from star formation. While no spatial information is available as to the origin of the mid-IR lines (Sturm et al. Sturm96 (1996)), both the near-IR recombination lines (Armus et al. Armus95 (1995); Larkin et al. Larkin95 (1995)) and the radio recombination lines (Anantharamaiah et al. Anantharamaiah00 (2000)) are mostly concentrated towards the two nuclei, rather than following the diffuse PAH component. Extinction estimates range from A(V)10 in the near-IR (Armus et al. Armus95 (1995); Larkin et al. Larkin95 (1995)) up to A(V)40–60 in the mid-IR and radio (Sturm et al. Sturm96 (1996); Anantharamaiah et al. Anantharamaiah00 (2000)), with noticable uncertainties e.g. due to the measured line fluxes. This suggests that the starburst activity traced by the emission lines includes an intermediate obscuration component that is more concentrated on the nuclei than the PAH emission. Two factors suggest this component includes intermediate obscuration parts of the regions around the two nuclei rather than the deepest embedded parts: A(V)50 appears still moderate compared to the extremely obscured NGC 4418-like continuum, and the energy budget of this component stays a factor 2 below the bolometric luminosity of Arp 220 (Genzel et al. Genzel98 (1998)). The infrared emission lines may thus give a partial view of the circumnuclear absorbed region, but very likely not a complete one.
4.2 The nature of the nuclear power sources
Given the relatively small fraction of the bolometric luminosity associated with the diffuse PAH emission (5–15%), the bulk of the luminosity of the Arp 220 system must be associated with the absorbed-continuum component from the two nuclei. To be responsible for only 40% of the 6–12 m luminosity but for 85–95% of the total Arp 220 infrared luminosity, these nuclei must, hence, be deeply enshrouded indeed. Given the large amounts of molecular material detected in the nuclear environment (1010 M⊙ half of which is in the disk enclosing the two nuclei; Scoville et al. Scoville97 (1997); Sakamoto et al. Sakamoto99 (1999)), this comes as no surprise. Unfortunately, strong obscuration erases source-specific spectral signatures, not only at X-ray, UV, optical, near- and mid-IR wavelengths, but, depending on the absorbing column, also out to far-IR and, possibly, sub-mm wavelengths.
Based on the few identified spectral signatures at hand, we consider two possibilities for the nature of the nuclear power sources. First, each of the nuclei may contain a deeply embedded, extremely dense and luminous stellar cluster – a super-star cluster containing some 106 massive O stars within a region less than 100 pc in size. Less extreme deeply embedded clusters have been discovered in the starburst galaxies NGC 5253 and He 2–10 (Gorjian et al. Gorjian01 (2001); Vacca et al. Vacca02 (2002)). A stellar nature for the nuclear power sources in Arp 220 is further supported by the 18 cm VLBI observations of Smith et al. (Smith98 (1998), Smith99 (1999)), which show a dozen or so sources scattered over the two nuclei. These “knots” are consistent with free-free emission from luminous radio supernovae expanding in the dense (circum)nuclear environment (Smith et al. Smith98 (1998), Smith99 (1999)). Second, we consider two deeply embedded AGNs. Despite the lack of AGN features in any waveband, a deeply embedded powerful AGN at the center of each nucleus cannot be ruled out. The column density required to block the AGNs from detection by BeppoSAX in hard X-rays is N=1025.1–1025.3 cm-2 with a large covering factor (Iwasawa et al. Iwasawa01 (2001)). The non-detection of a high-Tb radio core in the 18 cm VLBI maps of Smith et al. (Smith98 (1998), Smith99 (1999)) would then imply the AGNs to be radio-quiet or strongly free-free absorbed.
4.3 Modeling of the nuclear continuum
In order to test whether the low mid-to-far-IR continuum ratio in Arp 220 may be attributed to strong dust obscuration on the emission of two identical, deeply buried, energetically dominant, nuclear sources, we used the dust radiative transfer code of Siebenmorgen et al. (Siebenmorgen99 (1999), Siebenmorgen01 (2001)) to model the 2–3000 m nuclear spectrum.
In the model we assume a cluster of OB stars, with stellar densities similar to those inferred for ultra-dense regions (UD regions; Vacca et al. Vacca02 (2002)), to reside at the center of each nucleus. For a given luminosity of 6 1011 L⊙, the stars will occupy a sphere with radius r=25 pc. Adopting a nuclear gas mass of 109 M⊙, spherical symmetry, constant gas density and a silicate optical depth of =4.6 (consistent with the silicate optical depth for our best fitting absorbed continuum source NGC 4418), we are forced to place the outer radius of the dust shell as far out as 325 pc in order to lower the dust temperature to values consistent with the observed 12–50 m SED. The FWHM of the 11 m light profile is 20 pc, consistent with the observations of Soifer et al. (Soifer02 (2002)). As the temperature in the dust shell does not drop below 40 K at the outer edge, we consider an additional cold dust component to account for the coldest dust in the system. This component likely accounts for the far-IR/submm emission associated with the diffuse PAH component and for far-IR/submm emission from the nuclear region not covered by our ‘simple’ model. Here, we characterize the cold dust component by a grey body spectrum of 30 K with a dust emissivity index of 1.8 and a dust optical depth of 1 at 100 m. Both the model spectrum of the nuclei and the grey body spectrum are shown in Fig. 9. The Figure also shows the assumed contribution of the diffuse PAH component (M 83; see Sect. 3.4) to the Arp 220 mid-IR spectrum.
We conclude from our modeling that the low ratios S(6 m)/S(60 m) and S(6 m)/S(100 m) can, in principle, be explained by the effects of strong dust obscuration on two deeply buried, energetically dominant, nuclear sources. However, this model predicts a hydrogen column of only 1023.2 cm-2 and hence favours stellar heating, as this column is a factor 100 too small to account for the upper limits on the hard X-ray flux if the total luminosity were dominated by AGN activity (Iwasawa et al. Iwasawa01 (2001)).
Note that if any deeply hidden AGN (N1025 cm-2) were present, the covering factor of the obscuration would have to be large in order to be consistent with the lack of reflected X-ray light measured by BeppoSAX (Iwasawa et al. Iwasawa01 (2001)). The AGN would hence strongly contribute to the far-IR continuum, but could not be responsible for the mid-IR continuum.
4.4 Mid-to-far-infrared spectral characteristics
Arp 220 is an outlyer in many spectroscopic diagnostic diagrams linking mid-IR to far-IR quantities. In all cases Arp 220 stands out by having a low ratio of the mid-IR characteristic with respect to the far-IR characteristic:
-
•
Already in the Bright Galaxy Sample of Sanders et al. (Sanders88 (1988)), Arp 220 stands out by the smallest S12/S60 ratio.
-
•
Similarly, Arp 220 has the lowest S5.9/S60 ratio among the larger sample studied spectroscopically in the mid-IR by Lutz et al. (Lutz98 (1998)).
-
•
The ratio of F(6.2 m PAH)/F(FIR) is lower than for any other galaxy in our database of more than 250 ISO mid-IR galaxy spectra.
-
•
The ratio F(Ne ii)/F(FIR) is a factor three lower than for the average starburst galaxy (Genzel et al. Genzel98 (1998)).
-
•
The ratio F(7.7 m PAH)/F(850 m) is the lowest among a sample of normal and ultra-luminous galaxies (Haas et al. Haas01 (2001)).
Our spectral decomposition offers a simple explanation for the above observations. A typical starburst spectrum associated with the extended PAH component will contribute strongly to the mid-IR but weakly to the far-IR, while the dominant deeply enshrouded nuclei contribute weakly to the mid-IR and strongly to the far-IR. The resulting combined 3–1000 m SED is hence mostly starburst-like in the mid-IR and dominated by cold dust emission from the enshrouded nuclei in the far-IR. Ratios of mid-IR to far-IR quantities, like F(Ne ii)/F(FIR), F(6.2 m PAH)/F(FIR) or F(7.7 m PAH)/F(850 m), will hence all be systematically lower than the values typically found for starburst galaxies. Interestingly, Luhman et al. (Luhman03 (2003)) advocate a similar scenario as a contributor to the low F(C ii)/F(FIR) ratio of Arp 220.
Other galaxies may exist with even more strongly obscured nuclei, emitting
an even smaller fraction of the nuclear luminosity in the mid-IR than
Arp 220 does. These galaxies would hence look starburst-like in
the mid-IR (contributed by a weakly obscured circumnuclear starburst)
but would be characterized by a very strong cold dust continuum in the far-IR.
Galaxies of this type, may be recognized spectroscopically
by their low S5.9/S60, S5.9/S100, S5.9/S850 or F(C ii)/F(FIR)
ratios and their starburst-like 6.2 m-PAH line-to-continuum ratios.
Perusal of our ISO spectral
database has led to the identification of several candidate galaxies.
Arp 220 may thus be a local and less extreme template of the class of
SCUBA sources seen in the Hubble Deep Field.
Arp 220 is not the only galaxy with spectral structure in the 6–12 m range reminiscent of strongly modified PAH bands. Other examples are Mrk 231 and most of the galaxies in the sample of Tran et al. (Tran01 (2001)). Some of these spectra show, in addition to strong silicate absorption longward of 7.7 m, clear signs of water ice absorption shortward of 7.7 m. Depending on the strength of the PAH emission features these galaxies have been classified as class I, II or III ice galaxies (Spoon et al. Spoon02 (2002)). Like Arp 220, their spectra may well be the result of strong extinction on one or more spectral components.
5 Conclusions
We have shown that the 6–12 m spectrum of Arp220 is not that of a scaled-up typical starburst galaxy but contains a ’normal’ starburst component characterized by PAH emission features plus a highly obscured dust continuum with ice and silicate absorption. Attempts to decompose the spectrum using a variety of extragalactic and Galactic template spectra yields a best fit in which a typical starburst, represented by M 83, contributes 60% and and an ice absorbed continuum galaxy, represented by NGC 4418, 40% of the 6–12 m luminosity. An important result in relation to previous studies is our conclusion that the pronounced emission feature peaking around 7.7 m is a blend of PAH emission and a broader feature in the continuum caused by ice absorption at shorter and silicate absorption at longer wavelengths. We tentatively conclude that the PAH emitting component is only weakly absorbed and arises in the extended region imaged at higher resolution around 10 m by Soifer et al. (Soifer02 (2002)) whereas the absorbed continuum is associated with one or both of the compact nuclei. This extended starburst component contributes only 5–15% of the total luminosity with the bulk emitted by the heavily obscured nuclear component(s). One possibility is that this luminosity is generated by starburst activity occuring in a higher density environment than found in lower luminosity starburst galaxies due to the larger quantity of molecular gas and dust funnelled to the center by merging of the two nuclei. Due to the high extinction, it is not possible with the available data to exclude that AGN(s) also contribute some or all of this luminosity. Based on the upper limits for hard X-ray emission (Iwasawa et al. Iwasawa01 (2001)), however, Arp 220 would need to be the most highly obscured AGN known.
Acknowledgements.
The authors wish to thank Tom Soifer and Eiichi Egami for sharing data with us and George Helou, Olivier Laurent, Matt Lehnert, Neil Nagar, Dave Sanders, Eckhard Sturm and Jacqueline van Gorkum for discussions. We are grateful to the referee for valuable suggestions. This research has made use of the NASA/IPAC Extragalactic Database, which is operated by the Jet Propulsion Laboratory, Caltech under contract with NASA.References
- (1) Anantharamaiah K.R., Viallefond F., Mohan, N.R., et al., 2000, ApJ 537, 613
- (2) Armus L., Shupe D.L., Matthews K., et al., 1995, ApJ 440, 200
- (3) Arp H.C., 1966, ApJS 14, 1
- (4) Baan W.A., Haschick A.D., 1995, ApJ 454, 745
- (5) Beckwith S., Evans N.J., Becklin E.E., Neugebauer G., 1976, ApJ 208, 390
- (6) Bertoldi F., Timmermann R., Rosenthal D., et al., 1999, A&A 346, 267
- (7) Clements D.L., McDowell J.C., Shaked S., 2002, ApJ 581, 974
- (8) Dale D.A., Helou G., Contursi A., et al., 2001, ApJ 549, 215
- (9) Done C., Madejski G.M., Smith D.A., 1996, ApJ 463, L63
- (10) Downes D., Winnberg A., Goss W.M., Johansson L.E.B., 1975, A&A 44, 243
- (11) Draine B.T., 1989, In: Infrared Spectroscopy in Astronomy, B.H. Kaldeich (ed.), ESA-SP 290, 93
- (12) Dudley C.C., Wynn-Williams C.G., 1997, ApJ 488, 720
- (13) Dunne L., Eales S., Edmunds M., et al., 2000, MNRAS 315, 115
- (14) Dunne L., Eales S.A., 2001, MNRAS 327, 697
- (15) Eales S.A., Wynn-Williams C.G., Duncan W.D., 1989, ApJ 339, 859
- (16) Evans A.S., Becklin E.E., Scoville N.Z., et al., 2003, AJ 125, 2341
- (17) Fischer J., Satyapal S., Luhman M.L., et al., 1997, In: First ISO Workshop on Analytical Spectroscopy, A.M. Heras, K. Leech, N.R. Trams, M. Perry (eds.), ESA-SP 419, 149
- (18) Genzel R., Lutz D., Sturm E., et al., 1998, ApJ 498, 579
- (19) Genzel R., Cesarsky C.J., 2000, A&ARA 38, 761
- (20) Gorjian V., Turner J.L., Beck S.C., 2001, ApJ 554, L29
- (21) Guainazzi M., Matt G., Brandt W.N., et al., 2000, A&A 356, 463
- (22) Haas M., Klaas U., Müller S.A.H., et al., 2001, A&A 367, L9
- (23) Helou G., Lu N.Y., Werner M.W., et al., 2000, ApJ 532, L21
- (24) Houck J.R., Soifer B.T., Neugebauer G., et al., 1984, ApJ 278, L63
- (25) Howard E.M., Pipher J.L., Forrest W.J., 1994, ApJ 425, 707
- (26) Imanishi M., Dudley C.C., 2000, ApJ 545, 701
- (27) Iwasawa K., Koyama K., Awaki H., et al., 1993, ApJ 409, 155
- (28) Iwasawa K., Matt K., Guainazzi M., Fabian A.C., 2001, MNRAS 326, 894
- (29) Klaas U., Haas M., Heinrichsen I., Schulz B., 1997, A&A 325, L21
- (30) Krügel E., Siebenmorgen R., 1994, A&A 288, 929
- (31) Larkin J.E., Armus L., Knop R.A., et al., 1995, ApJ 452, 599
- (32) Luhman M.L., Satyapal S., Fischer J., et al., 2003, ApJ 594, 758
- (33) Lutz D., Spoon H.W.W., Rigopoulou D., et al., 1998, ApJ 505, L103
- (34) Lutz D., 1999, In: The Universe as seen by ISO, P. Cox, M.F. Kessler (eds.), ESA-SP 427, 623
- (35) Lutz D., Sturm E., Genzel R., et al., 2003, A&A 409, 867
- (36) Martin P.G., Whittet D.C.B., 1990, ApJ 357, 113
- (37) Martín-Hernández N.L., van der Hulst J.M., Tielens A.G.G.M., 2003, A&A 407, 957
- (38) Massi M., Felli M., Simon M., 1985, A&A 152, 387
- (39) Mundell C.G., Ferruit P., Pedlar A., 2001, ApJ 560, 168
- (40) Peeters E., Hony S., Van Kerckhoven C., et al., 2002, A&A 390, 1089
- (41) Rigopoulou D., Spoon H.W.W., Genzel R., et al., 1999, AJ 118, 2625
- (42) Roche P.F., Aitken D.K., 1984, MNRAS 208, 481
- (43) Roche P.F., Aitken D.K., 1985, MNRAS 215, 425
- (44) Roche P.F., Aitken D.K., Smith C.H., James S.D., 1986, MNRAS 218, 19P
- (45) Sakamoto K., Scoville N.Z., Yun M.S., et al., 1999, ApJ 514, 68
- (46) Sanders D.B., Soifer B.T., Elias J.H., et al., 1988, ApJ 325, 74
- (47) Sanders D.B., Mirabel I.F., 1996, ARA&A 34, 749
- (48) Scoville N.Z., Yun M.S., Bryant P.M., 1997, ApJ 484, 702
- (49) Siebenmorgen R., Krügel E., Zota E., 1999, A&A 351, 140
- (50) Siebenmorgen R., Krügel E., Laureijs R.J., 2001, A&A 377, 735
- (51) Smith C.H., Aitken D.K., Roche P.F., 1989, MNRAS 241, 425
- (52) Smith H.E., Lonsdale C.J., Lonsdale C.J., et al., 1998, ApJ 493, L17
- (53) Smith H.E., Lonsdale C.J., Lonsdale C.J., et al., 1999, Ap&SS 266, 125
- (54) Soifer B.T., Helou G., Lonsdale C.J., et al., 1984, ApJ 283, L1
- (55) Soifer B.T., Sanders D.B., Madore B.F., et al., 1987, ApJ 320, 238
- (56) Soifer B.T., Neugebauer G., Matthews K., et al., 1999, ApJ 513, 207
- (57) Soifer B.T., Neugebauer G., Matthews K., et al., 2002, AJ 124, 2980
- (58) Spoon H.W.W., Genzel R., Lutz, D., 1998, In: Star Formation with the Infrared Space Observatory, J.L. Yun, R. Liseau (eds.), ASP Conf. Series 132, 414
- (59) Spoon H.W.W., Koornneef J., Moorwood A.F.M., et al., 2000, A&A 357, 898
- (60) Spoon H.W.W., Keane J.V., Tielens A.G.G.M., et al., 2001, A&A 365, L353
- (61) Spoon H.W.W., Keane J.V., Tielens A.G.G.M., et al., 2002, A&A 385, 1022
- (62) Spoon H.W.W., Moorwood A.F.M., Pontoppidan K.M., et al., 2003, A&A 402, 499
- (63) Sturm E., Lutz D., Genzel R., et al., 1996, A&A 315, L133
- (64) Sturm E., Lutz D., Tran D., et al., 2000, A&A 358, 481
- (65) Thornley M.D., Förster Schreiber N.M., Lutz D., et al., 2000, ApJ 539, 641
- (66) Toomre A., Toomre J., 1972, ApJ 178, 623
- (67) Tran Q.D., Lutz D., Genzel R., et al., 2001, ApJ 552, 527
- (68) Vacca W.D., Johnson K.E., Conti P.S., 2002, ApJ 123, 772
- (69) Weingartner J.C., Draine B.T., 2001, ApJ 548, 296
- (70) Wynn-Williams C.G., Becklin E.E., 1993, ApJ 412, 535