A movie of a star: multi-epoch VLBA imaging of the SiO masers towards the Mira variable TX Cam
Abstract
We describe an observing campaign using the Very Long Baseline Array (VLBA) to monitor the time-evolution of the SiO maser emission towards the Mira variable TX Cam. The data reported here cover the period 1997 May 24 to 1999 February 19, during which the SiO maser emission was imaged at approximately bi-weekly intervals. The result is an animated movie at an angular resolution of , over a full pulsation period, of the gas motions in the near circumstellar environment of this star, as traced by the SiO maser emission. This paper serves to release the movie and is the first in a series concerning the scientific results from this observing campaign. In this paper, we discuss the global proper motion of the SiO maser emission as a function of pulsation phase. We measure a dominant expansion mode between optical phases confirming ballistic deceleration, and compare this to predictions from existing pulsation models for late-type, evolved stars. Local infall and outflow motions are superimposed on the dominant expansion mode, and non-radial local gas motions are also evident for individual SiO maser components. The overall morphology and evolution of the SiO emission deviates significantly from spherical symmetry, with important implications for models of pulsation kinematics in the near-circumstellar environments of Mira variables.
1 Introduction
The astronomical SiO masers located in the extended atmospheres of asymptotic giant branch (AGB) stars act as unique tracers of the physical processes at work in the near-circumstellar environments of cool, evolved stars. The extended atmosphere is defined as the region between the photosphere and the inner dust formation radius. The individual SiO maser components have sufficiently high brightness temperatures to allow VLBI radio-interferometric imaging of this region at sub-milliarcsecond (mas) resolution. The detailed structure of SiO maser emission in the envelopes of AGB stars has accordingly been the subject of considerable recent research, much of it engendered by the imaging capabilities provided by the Very Long Baseline Array (VLBA) operated by the National Radio Astronomy Observatory (NRAO111The National Radio Astronomy Observatory is a facility of the National Science Foundation operated under cooperative agreement by Associated Universities, Inc.). This array permits routine imaging of 43 GHz SiO maser emission at a resolution of several hundred . Such observations of the circumstellar SiO masers towards several late-type evolved stars have shown that the masers are confined to a narrow, ring-like ellipsoidal global morphology, and are tangentially amplified (Miyoshi et al., 1994; Diamond et al., 1994; Greenhill et al., 1995; Boboltz, Diamond, & Kemball, 1997; Boboltz & Marvel, 2000; Desmurs et al., 2000; Cotton et al., 2003). The local morphology contains significant fine structure at radii larger than the inner ring however, including spatially coherent features and detailed sub-structures.
The VLBA is the first VLBI array to operate continuously throughout the year and thus offers the possibility of SiO monitoring observations with both high spatial and temporal resolution. The resulting time series of high-angular resolution images, when combined as an animated movie, provides a fundamentally new view of the gas motions in the near-circumstellar environments of AGB stars. Animated movies of astrophysical phenomena are rare despite their unique scientific value. This is primarily due to the associated technical and scientific challenges of such observations. Prominent examples of movies of objects within the solar system include the sequence of images of comet Shoemaker-Levy 9 colliding with Jupiter (Weaver et al., 1995) and the complex motions in the solar atmosphere revealed by the Yohkoh X-ray satellite (Aschwanden, Poland, & Rabin, 2001). Examples of movies of galactic and extra-galactic objects, in both the radio and the optical, are provided by Tuthill et al. (2000), Gomez et al. (2000), and Hartigan et al. (2001).
We have used the VLBA to create a movie of the 43 GHz, SiO maser emission towards the Mira variable TX Cam by observing a closely-sampled time series of high-resolution images. In this paper we present the first 44 bi-weekly epochs in this series, combined to produce a movie of the gas motions in the near-circumstellar environment of TX Cam, as traced by the SiO maser emission during this period.
Long-period variable (LPV) stars on the AGB, such as TX Cam, have typical stellar pulsation periods of several hundred days. They have significant mass-loss during the AGB phase of their evolution, and form substantial circumstellar shells containing molecular gas and dust. A full review of this phase of stellar evolution is provided by Habing (1996). The extended atmosphere in AGB stars is a complex region, dominated by the mass-loss process and permeated by shocks, magnetic fields and local temperature and density gradients. Models of the dynamical evolution of the envelopes of evolved stars of this type require treatment of a range of physical processes, including stellar pulsation mode, shock propagation, thermal relaxation mechanisms, dust formation, radiation pressure on dust and models for the coupling of gas and dust motions, amongst others, and are generally tractable only through computational approaches (Bowen, 1988; Bessell, Scholz & Wood, 1996; Willson, 2000; Humphreys et al., 2002).
A net loss of material occurs from the nearby stellar surface through the extended atmosphere to the outer stellar wind, although there remain many uncertainties regarding the physical processes underlying the mass-loss mechanism. In wind-driven mass-loss models, stellar pulsation drives shocks into the near-circumstellar environment and the stellar atmosphere becomes significantly distended relative to a hydrostatic atmosphere through passage of the outwardly propagating shocks (Bowen, 1988; Humphreys et al., 2002). This levitates gas above the photosphere. Subsequently, the gas and circumstellar dust become coupled and radiation pressure accelerates them outward. In this mass-loss model, some post-shock material falls back to the stellar surface during parts of the pulsation cycle, following a trajectory guided by gravity and local pressure gradients, but there is a net outflow of material to the outer stellar wind over several pulsation cycles (Bowen, 1988).
However, there remain many theoretical and empirical uncertainties in models of the extended atmospheres of AGB stars and the underlying mass-loss mechanisms. Current theoretical work generally assumes stationary, polytropic, homogeneous and spherically symmetric hydrodynamic models (Willson, 2000, and references therein). Stellar rotation and magnetic fields are expected to play a significant role however; supporting evidence is provided by the asymmetric structure of post-AGB objects and planetary nebulae (García-Segura et al., 1999; Balick & Frank, 2002), although specific mechanisms for magnetic shaping differ sharply in interpretation (Soker, 2002, and references therein). Direct observational data are difficult to obtain for the extended atmospheres around distant cool evolved stars. In this respect, VLBI offers a unique scientific opportunity to study these objects.
The data presented in this paper are drawn from a long-term VLBA SiO maser monitoring campaign to compile movies of the gas motions in the extended atmospheres of a small sample of LPV stars. The overall scientific goal of this observing program is to constrain models of these objects by providing empirical data on the detailed kinematics of the gas and shock motions in the extended atmosphere as well as information concerning global and local asymmetry. The kinematic and overall morphological evolution can also be determined as a function of stellar pulsation phase, which helps to discriminate between competing physical mass-loss mechanisms. In addition, individual SiO maser components are usually highly linearly polarized (McIntosh, 1987; Barvainis et al., 1987; Kemball & Diamond, 1997), and can be used to probe the magnitude and orientation of the underlying magnetic field at high spatial resolution when taken in conjunction with a theoretical model for the propagation of polarized maser emission. This measurement of the magnetic field, in turn, constrains gas dynamics in this region. A final scientific objective of this observing program is to compile detailed properties of the individual maser components detected in each epoch, including their size, shape, polarization properties and proper motions, in order to study component lifetimes, maser excitation mechanisms and related issues relevant to basic maser physics.
The variability of SiO masers has been well established through extensive single-dish observations (Martinez, Bujarrabal & Alcolea, 1988; Pijpers, Pardo, & Bujarrabal, 1994; Alcolea et al., 1999). The net result of these studies is that the integrated SiO flux appears to vary in phase with the well established optical variation of Mira variables but with a phase-lag of approximately 20% of the pulsation period. In a recent large-scale statistical single-dish study, Cho, Kaifu, & Ukita (1996b) found that the mean velocity of the v=1 and v=2 SiO masers varied with the optical phase of the star, the red-shifted emission being dominant between phases 0.3 and 0.8 suggesting that, near optical minimum, the SiO was falling towards the star. However, this is contradicted by VLBA observations of the proper motions of v=1, J=1-0 SiO masers in the circumstellar envelope of the symbiotic Mira R Aqr (Boboltz, Diamond, & Kemball, 1997). These authors showed that, between optical phases 0.78 - 1.04 (i.e. just prior to and covering optical maximum), the masers were falling inwards at a velocity of approximately 4 km/s. Detailed imaging of an ensemble of several stars is required to establish the true nature of the mass-loss mechanisms in AGB stars as a stellar class.
This paper concerns an imaging campaign for the late-type evolved star, TX Cam, which is a Mira variable with a spectral classification that varies between M8 and M10 over a pulsation period of 557.4 days (Kholopov et al., 1985). The Mira period-luminosity relationship yields a distance estimate of kpc for this star (Olivier, Whitelock, & Marang, 2001), and this distance is adopted here. SiO maser emission was first detected by Spencer et al. (1977), but there are no associated OH or H2O masers (Dickinson, 1976; Wilson & Barrett, 1972; Benson & Little-Marenin, 1996; Lewis, 1997). Observations of thermal CO emission lead to an estimated mass-loss rate of /yr (Knapp & Morris, 1985). SiO maser emission has been detected from a range of vibrational and rotational transitions (Jewell et al., 1987; Cho & Ukita, 1995; Bujarrabal et al., 1996; Cho, Kaifu, & Ukita, 1996a; Cho et al., 1998; Gray, Humphreys, & Yates, 1999) and SiO isotopomers (Barcia, Alcolea, & Bujarrabal, 1989; Cho & Ukita, 1995; González-Alfonso, Alcolea, & Cernicharo, 1996; Cho, & Ukita, 1998). In addition, several C- and S-rich molecular species are found in the circumstellar environment (Lindqvist et al., 1988; Bachiller et al., 1997; Olofsson et al., 1998; Bieging, Shaked, & Gensheimer, 2000).
This paper serves to publish the movie produced from the first 44 epochs of the observing campaign, and addresses the global morphological evolution of TX Cam during this period. Early results have been reported elsewhere (Diamond, Kemball, & Boboltz, 1997; Diamond & Kemball, 1999). Subsequent papers will address more detailed aspects of the scientific analysis of these data. The layout of this paper is as follows. The observational method and data reduction strategy are briefly discussed in Section 2. The global properties of the SiO structure and its evolution are discussed in Section 3 and the summary conclusions are presented in Section 4.
2 Observations and Data Reduction
We have observed the 43 GHz SiO maser emission towards TX Cam at multiple epochs using the Very Long Baseline Array (VLBA). This paper concerns the period 24 May 1997 until 19 Feb 1999, during which the source was observed approximately bi-weekly, and in which the optical phase increased from to . The date, project code and optical phase of each observing epoch are listed in Table 1. The optical phase is computed using the optical maximum at MJD = 50773 cited by Gray, Humphreys, & Yates (1999), and assuming their quoted uncertainty . A mean period of 557.4 days is adopted (Kholopov et al., 1985).
Great care was taken to ensure that the same observing schedule was used for each epoch in order to generate a uniform sequence of datasets. This included uniformity in both the data acquisition and correlation configuration. At each epoch the data were recorded in dual circular polarization in a bandwidth of 4 MHz centered on km s-1, adopting a rest frequency for the transition of 43.122027 GHz. Each observing run was of six hours duration and included interleaved observations of the continuum calibrators, 3C454.3 (catalog ), J0359+5057 (catalog ) and J0609-1542 (catalog ), which were included for residual group delay, bandpass and polarization calibration. Each schedule was shifted to a comparable local sidereal time (within a scheduling granularity of one hour) to minimize a priori differences in coverage between the epochs. Further differences in net -coverage did arise between epochs however, due to antenna failures during individual epochs and also as a result of data editing in post-processing, as described further below. Representative system temperatures and point source sensitivities for each 25-meter antenna at 43 GHz were of the order of K and Jy/K respectively. The data for each epoch were correlated in full cross-polarization at the VLBA correlator in Socorro, adopting a position for TX Cam (catalog ) of . The correlation accumulation interval was , and the spectra were generated with a sampling of 128 frequency channels over the 4 MHz band. A restoring beam of 540 x 420 at a P.A. of 20 was used in final imaging, representative of the lowest spatial resolution across the set of observational epochs. Initial 1024 x 1024 image cubes were generated using uniform gridding weighting and a pixel spacing of 100 .
The correlated visibility data rate for the project was Gbyte per epoch. Automated pipeline reduction is required as a result of the data volume alone, but is also dictated by the scientific requirement for a uniform sequence of images, processed as far as possible through identical calibration and imaging steps. The data were calibrated and imaged within the Astronomical Image Processing System (AIPS) using a POPS script developed by the authors which encodes the data reduction method described by Kemball, Diamond & Cotton (1995) and Kemball & Diamond (1997) for the reduction of spectral-line VLBI polarimetry observations. The data reduction heuristics specific to this project were embedded directly in the scripts; uniform datasets were accordingly essential for the smooth running of this basic reduction pipeline. The process was sufficiently automated that the only interaction with the data was confined to flagging. It was found that careful and ruthless interactive flagging of the data was essential however in order to generate images of acceptable quality. The total volume of data generated in this project ( 0.6 Tbytes in all, including all image cubes and intermediate calibration products) precluded extracting the ultimate dynamic range from each dataset which might be possible with highly interactive, custom reduction. Instead, dynamic ranges of between 100:1 and 200:1 were deemed acceptable. Occasionally, due to bad weather over parts of the array or the loss of crucial antennas near the array center in the southwest US, acceptable images could not be produced. Under these circumstances, the whole observation was discarded. In the -week period covered by these observations, this situation occurred five times. These epochs are marked in Table 1. In addition, one bi-weekly observation, near 4 Apr 1998, was not scheduled.
The time sequence of images was combined as an animated movie in order to explore the overall global evolution of the maser emission in the circumstellar envelope. A robust velocity moment image was formed from the Stokes image cube at each epoch by extracting the maximum intensity pixel over velocity at each pixel position in projected right ascension and declination. The animated movie was constructed from the inner 680 x 680 pixels centered on the projected ring. The moment images are good tracers of the overall maser structure given that the masers are tangentially amplified and generally confined to a narrow projected shell (Diamond et al., 1994). The singular scientific advantage in forming an animated sequence of velocity moment images is that it allows direct visualization and analysis of the gross morphological evolution of the total SiO maser emission towards TX Cam (catalog ) in three dimensions rather than four.
Direct astrometry at the level is not routinely possible for VLBI observations at 43 GHz. Without phase-referencing, the absolute astrometric position of each moment image is uncertain. This is the conventional outcome of VLBI imaging with phase self-calibration, as used in the reduction of these data. The images were therefore registered spatially in a separate, two-step process. In the first pass, the images were aligned based on the assumption that there were no major changes in overall morphology over the two-week interval between epochs. The angular offset between successive epochs was then determined by direct two-dimensional correlation of successive images using the image registration technique described by Walker (1997), and applying the resultant pixel-level shifts to each cube to maximize the correlation. Cross-correlation image registration techniques are optimal for aligning identical images but are known to introduce systematic alignment errors for sufficiently dissimilar images (Brown, 1992). The TX Cam velocity moment images at each epoch are sufficiently similar to permit the use of cross-correlation for the first-order alignment. A feature-based image registration technique was then used in the second pass to refine the initial frame offsets. For this method a set of individual component trajectories were extracted from the movie for a range of components with continuous motion across a lower limit of seven or more frames. The centroid of each component position in the velocity moment image at a given epoch (frame ) was measured interactively in the image plane, with an estimated rms measurement error of 2 pixels (0.2 mas). For this analysis, no deconvolved component shapes were fitted. These component trajectories can reasonably assumed to be linear or close to linear on average. An image registration similarity metric was then defined as , obtained by fitting a separate straight line to each measured trajectory. The frame translation offsets were then solved for using Powell’s minimization technique. This work was done in the AIPS++ package using the third-party222OptSolve++ is distributed by Tech-X corporation (http://www.techxhome.com) optimization library OptSolve++ for an implementation of Powell’s minimization method. In this joint fit for all frame offsets the first frame was held fixed as the reference point. The second-pass image registration yielded frame offsets within a range of mas over the course of the animated movie, which were then applied as two-dimensional translations of each frame to yield the final aligned movie sequence.
For failed and unscheduled observational epochs, as annotated in Table 1 ( of all data), a linearly-interpolated image was generated for the missing observational epoch and incorporated in the animated movie to ensure that the interval between frames was regular. This procedure caused no visible degradation in the movie. Two image processing filters were applied to each frame to enhance the visibility of the overall SiO emission in the animated movie sequence. These included taking the square root of the brightness at each pixel to minimize the range of amplitudes in the movie. In addition, pixels below were blanked to suppress emission likely to fall below the fidelity range of each frame.
The final animated movie can in viewed in MPEG graphics format at [http//to-be-supplied-by-ApJ].
3 Results and Discussion
This section discusses the gross kinematic properties of the SiO maser emission towards TX Cam in the period covered by these observations.
3.1 Morphological evolution
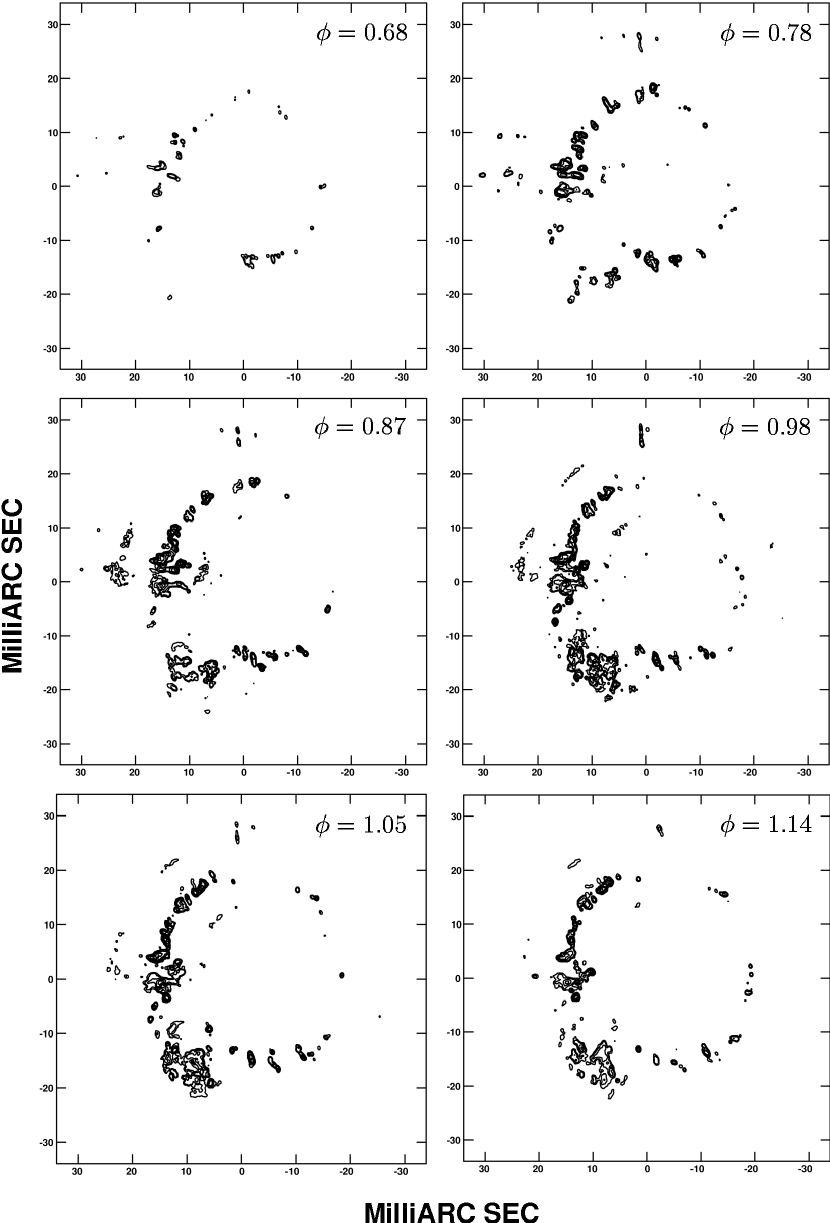
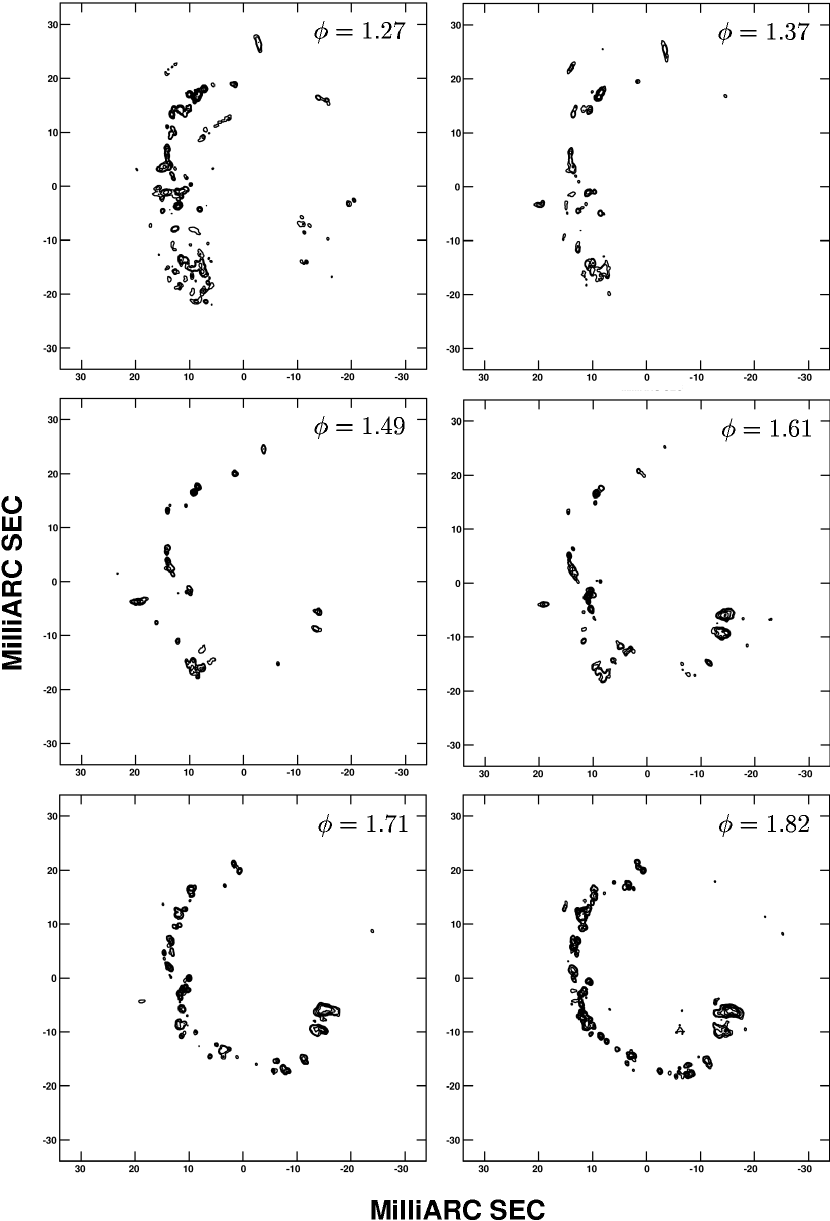
The optical light curve of TX Cam as derived from AAVSO data (J. Mattei 1998, private communication), is shown in Figure 1, with a series of markers indicating the times of the VLBA observational epochs. The VLBA observations, and the associated animated movie derived from the data, span an optical phase interval of to . Individual frames of the movie, evenly spaced by approximately , are shown as intensity contour plots in Figure 2.
In the movie, several key defining properties of the gross morphology of the SiO maser emission towards TX Cam are clearly visible. Most predominantly, the maser emission is confined to a narrow projected ring in all epochs, as found in earlier observations (Diamond et al., 1994; Kemball & Diamond, 1997). The projected ring structure is commonly explained by tangential amplification, arising from a radial velocity gradient at the inner boundary of the SiO maser region (Humphreys et al., 2002, and references therein). The inner shell boundary is relatively sharply defined and, in general, has an irregular ellipsoid or double-ellipsoid structure. Emission which is more diffuse is to be found outside the inner ring, principally to the east, southeast and north; such outlier emission is common throughout the period covered by these observations. There is significant complex fine-structure in the emission at radii beyond the inner shell, including spatially-coherent arcs and filaments. There is evidence that some of the outlying emission features may persist over multiple pulsation cycles. Previous observations in late 1994 (Kemball & Diamond, 1997) and early 1995 show complex outlying emission in the east and southeast, similar to the overall morphology visible in the data presented here.
The clumpiness and granularity of the SiO components in the maser region reflect a sampling function of the local SiO gas density, maser pumping conditions and line-of-sight velocity coherence. These are strongly influenced by anisotropies in the mass-loss process as well as local turbulent gas motions. Factors of this nature are likely responsible for the overall E-W asymmetry in the maser emission intensity evident over large parts of the observing period presented here.
There is significant variability in the structure of the SiO maser emission over the course of the movie. The gross morphology of the shell varies smoothly over time, with systematic changes in the completeness and ellipticity of the inner ring as a function of stellar phase. The inner ring is well-defined, more complete and more nearly circular during the initial epochs near an optical phase . From this phase, through the overall structure gradually changes from a well-defined circle to an irregular ellipsoidal shape with an approximate axis of symmetry at a P.A. of (N through E). At about the SiO masers in the west and south have faded and are no longer easily detectable. This condition persists until optical minimum at , at which point the south-western side of the envelope has reappeared and a new inner shell boundary starts to form, interior to the previously expanding shell. The shell becomes progressively better defined and more complete, bar the northwest quadrant, through the optical phase in the closing frame of the movie. During this final interval the shell takes on an irregular double-ellipsoid shape, but retains the approximate symmetry axis noted above. The size of the projected shell at the end of the movie is comparable to that measured at the starting phase .
The position and evolution of the overall structure and morphology of the SiO maser emission is not random, in the sense that individual bright maser features persist over many epochs and show coherent motions over these periods. There is also significant variability in the fine-scale structure of the emission between epochs. Overall, the strong variability in the spatial structure of the SiO maser emission shown by these data is entirely consistent with the strong inter- and intra-cycle variability of SiO spectra known from single-dish monitoring (Martinez, Bujarrabal & Alcolea, 1988; Alcolea et al., 1999).
Expansion is the dominant overall kinematic behaviour of the inner shell boundary between optical phases of and . There is significant variability in the fine-scale motions of individual maser components however. Simultaneous infall is superimposed on the dominant expansion mode in some parts of the shell, and during certain phases of the pulsation period. Local motions, particularly at radii beyond the inner shell boundary, may show both infall and outflow at the same optical phase. We will discuss this question in more detail in the following sections. Both radial and non-radial component motions are present, and non-radial motions often appear to trace arcs or filamentary structures in the shell.
The complex spatial structure of the SiO maser emission observed here, and the high degree of asymmetry have important implications for theoretical models of the gas kinematics in the near-circumstellar environment of LPV stars. Standard computational hydrodynamic models assume a piston-driven pulsation of the photosphere which, in turn, drives shocks into the extended atmosphere (Bowen, 1988; Humphreys et al., 1996, 2002). These models assume spherical symmetry in order to reduce the degree of computational complexity and thus make the models more tractable. The data presented here show strong evidence for localized mass-loss and a significant departure from spherical symmetry in the overall morphology and kinematics of the gas motions in the near-circumstellar environment of TX Cam.
The origin and evolutionary onset of the axisymmetry commonly observed in many planetary and proto-planetary nebulae remains an important area of current research (Imai et al., 2002). It is uncertain when the asphericity arises in the AGB or post-AGB phase and the dynamical cause remains unclear. Models have been proposed in which a circumstellar B-field plays a global dynamical role in shaping the outflow (García-Segura et al., 1999). Alternative models of localized mass-loss have also been proposed by Soker (2002, and references therein) based on starspot photospheric cooling over surface regions, leading to enhanced dust formation, and in which the ratio of magnetic energy density to thermal energy density in the outflow itself is not dynamically significant. The influence of binarity, interacting stellar winds and large-scale photospheric turbulence remain additional considerations.
The data presented in this paper however, clearly show that spherical symmetry is a poor assumption for the morphology or kinematics of the gas motions in the near-circumstellar environments of Mira variables even during their final evolution on the AGB. We should note however that while spherical symmetry is clearly a bad approximation for TX Cam, extrapolating this result to all Miras as a stellar class will require a larger sample of observed sources covering a range of evolutionary parameters on the AGB. We consider this question in further detail in subsequent papers in this series.
3.2 Mean shell kinematics
The TX Cam global shell kinematics can be quantified to first-order by measuring the variation of mean projected inner shell radius as a function of observational epoch. This provides a direct measurement of the mean radial gas motions in the SiO maser zone over the course of the pulsation cycle. The resulting radial velocity profile can be compared directly with that predicted by theory and therefore used as a direct constraint on models of the pulsation hydrodynamics in the near-circumstellar environment of LPV stars.
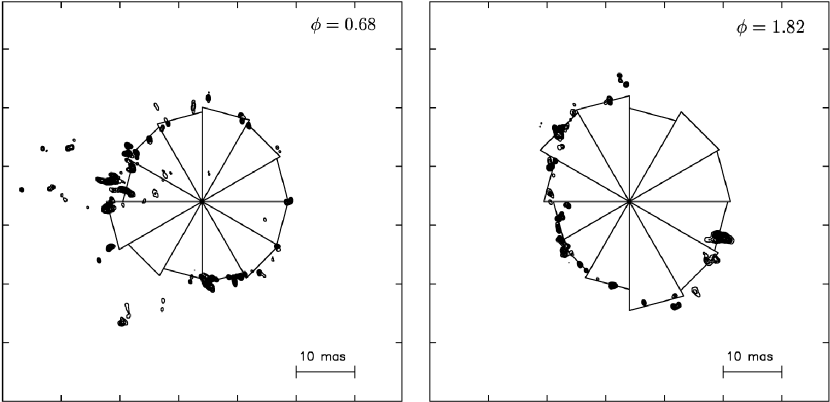
Measuring the TX Cam inner shell radius as a function of stellar phase requires some care given the highly fragmented nature of the inner shell during large parts of the pulsation cycle. It seldom takes a pure geometric or mathematical shape and as such is not amenable to direct and unbiased least-squares fitting in analytic form. In addition, in such a fit, an objective heuristic would be required to identify the subset of components which fall within the inner shell boundary and those which do not. In order to avoid these difficulties, a simple, but more robust, estimator of the inner shell boundary was developed within the AIPS++ package, making no assumptions about the geometric form of the shell itself. The inner shell radius at a position angle on the projected ring, was estimated by finding the position of the local maximum in the gradient of the radial intensity function:
where is the velocity moment image brightness at angular pixel position , and represents summation over a triangular image region with an apex at the image center pixel at a position angle , and of height . The base of the triangular integration region is therefore tangential to the projected shell. For each epoch , the inner shell boundary was estimated at each of position angles , and was determined as the mean of each , weighted by the magnitude of the radial intensity gradient at that point. The gradient function at times has multiple peaks at different radii, due to emission from earlier pulsation cycles. An adaptive windowing technique was used to maximize the probability of detecting the current shell in the search for the gradient peak at a given . Example results obtained using the inner shell boundary estimator on the first and last velocity moment frames of the movie, are shown in Figure 3.
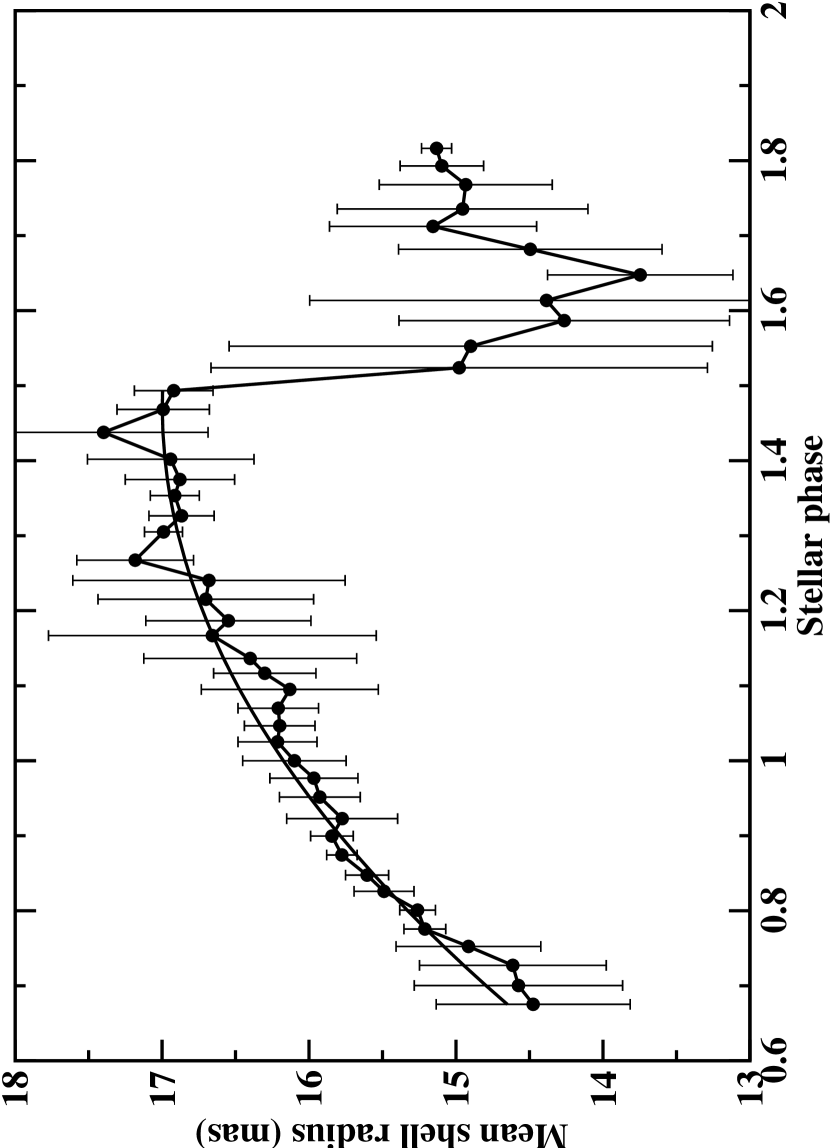
This overall method of estimating is inherently approximate given the fragmented shell structure but does minimize bias introduced by any assumption of a fixed mathematical shape for the shell. A quantitative error bar at each epoch was estimated as the range of obtained for each of and . The variation in mean shell radius as a function of stellar phase, computed in this way, is plotted in Figure 4.
This quantitative measure of the mean shell kinematics as a function of stellar phase confirms the overall morphological evolution discussed in the previous section. The expansion between phases and is clearly evident. Beyond optical minimum () through an optical phase in the closing frames of the movie, the projected shell appears to start contracting as a new inner shell boundary forms, interior to the previously expanding shell.
The measured radial velocity profile can be compared directly with model predictions. Theoretical models of the dynamics of LPV atmospheres have been developed based on numerical studies of pulsation hydrodynamics in the near-circumstellar environment (Bowen, 1988; Bessell, Scholz & Wood, 1996), as discussed above. Other strong qualitative constraints on LPV kinematics have also been provided by optical spectroscopic studies of systematic velocity signatures in photospheric lines (Wallerstein, 1985). In particular, near-infrared spectroscopy of the CO vibration-rotation absorption band at has proven an important observational diagnostic of LPV atmosphere kinematics (Hinkle, Hall, & Ridgway, 1982; Hinkle, Scharlach, & Hall, 1984; Wallerstein, 1985; Hinkle, Lebzelter, & Scharlach, 1997). The velocity centroid of these lines has a characteristic S-shaped curve, relative to the velocity center of mass, about a mean stellar phase of (Hinkle, Lebzelter, & Scharlach, 1997). The velocity curve is blue-shifted below a phase of , and red-shifted above, consistent with a shock emerging between pre-maximum and maximum visible light which rapidly accelerates gas radially outwards to a velocity of km s-1(Hinkle, Lebzelter, & Scharlach, 1997). After shock passage, the gas subsequently decelerates and falls back towards the photosphere through a stellar phase under the influence of gravity and subject to any local pressure gradients (Hinkle, Hall, & Ridgway, 1982). The absorption spectra are double-lined near maximum phase, consistent with simultaneous infall and outflow, above and below the shock front (Alvarez et al., 2000). The presence of emission lines (Merrill, 1921) from post-shock material further supports the shock-wave kinematic model for LPV atmospheres (Alvarez et al., 2000).
The CO velocity signature traces the shock kinematics close to the photosphere. For TX Cam, there has been no direct observational measurement of the photospheric radius . We adopt an estimate AU, obtained by scaling the model value reported by Pegourie (1987) to the adopted TX Cam distance of kpc (Olivier, Whitelock, & Marang, 2001). The TX Cam SiO maser zone, centered at mas, lies at approximately , assuming these parameters. Numerical models predict the LPV kinematics at the radius of the SiO maser emission (Humphreys et al., 2002; Bessell, Scholz & Wood, 1996), although sometimes subject to uncertainties in the registration of the model and observed stellar phases. The shock kinematics derived from near-infrared spectroscopy can also be extrapolated to the larger radius of the SiO maser emission. To first-order, there is an expected phase offset for the arrival of the shock in the SiO maser zone due to a propagation delay. From a ensemble of several Mira variables, Humphreys et al. (2002) quote a mean stellar phase of arrival of the shock in the SiO maser zone of . This is consistent with the phase at which a new inner SiO ring appears in the TX Cam data presented here. A simple propagation calculation for TX Cam leads to a mean shock front propagation velocity of km s-1over this phase interval. Numerical models by Bowen (1988) predict a velocity gradient over the shock fronts located close to the photosphere of approximately kms-1. Fundamental-mode and first-overtone pulsators lie at the upper and lower ends of that velocity range respectively (Bowen, 1988). Velocity amplitudes derived from near-infrared spectroscopy of a sample of Mira variables (Hinkle, Lebzelter, & Scharlach, 1997) lie in the range kms-1.
The appearance of a new inner shell in the TX Cam data at a phase is consistent with an extrapolation of the 1.6 shock kinematics to the SiO maser zone at and the mean propagation delay reported by Humphreys et al. (2002). From pulsation hydrodynamic models, the post-shock gas is expected to fall back ballistically (Bowen, 1988), modified by any local pressure gradients. The infalling gas will interact with subsequent outwardly-propagating shock fronts originating in the photosphere. The outflow and infall time-scales for a local parcel of gas in the near circumstellar environment vary strongly with radius from the photosphere however (Bowen, 1988; Bessell, Scholz & Wood, 1996). At larger radii, the reduced gravitational acceleration leads to longer infall times, which may then exceed the pulsation period. The interaction between these two time-scales leads to increasing inter-cycle irregularity with increasing radius, as noted by Bessell, Scholz & Wood (1996). For TX Cam at the adopted mid-point of the SiO maser zone ( mas), the gravitational acceleration is km s-2 for a central star mass of 1 , and km s-2 for a central star mass of 1.2 . For the mean gravitational acceleration, the corresponding infall time for a parcel of gas across a maser zone of mas width, starting from rest, will exceed the pulsation period days by a factor of . Therefore the difference in these time-scales can be expected to lead to complex kinematics in the SiO maser region with an inter-cycle dependence, dictated by the position at which the infalling and outflowing material meet and with what relative velocities. In contrast, closer to the photosphere, the time-scale for ballistic deceleration and gas infall back towards the photosphere is invariably shorter than the pulsation period.
To test the hypothesis of ballistic deceleration common in LPV dynamic models, we fitted a parabolic function to the data presented in Figure 4 over the phases to . Using the adopted error bars discussed above for the data points, we derive a mean deceleration over this region of kms-2 and an initial velocity at the inner edge of the SiO maser region of kms-1. Therefore our data on TX Cam are consistent with ballistic deceleration of post-shock SiO gas during this phase interval of the pulsation period considered here.
3.3 Component proper motions
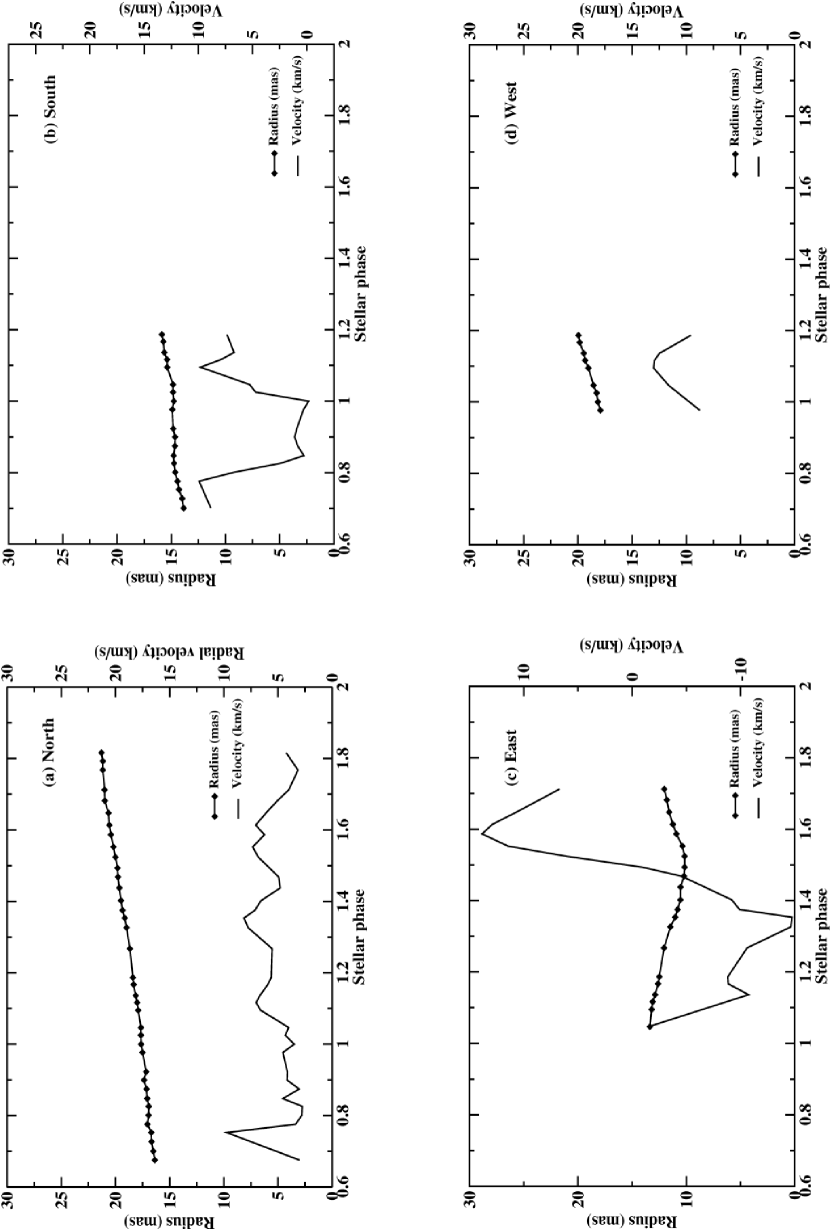
As noted in Section 2, we extracted component trajectories in the velocity moment images as part of the image registration process. In Figure 5, we have plotted the projected radial proper motions for four components from these data, selected for their location on the N, S, E and W sides of the shell. The radii were computed relative to the mean shell origin for the first observational epoch, which was held fixed as a reference in the movie alignment process. A projected radial velocity was computed at each point by fitting a simple parabolic model for in a five-point running window about each data point.
The maser components follow well defined paths but the velocity magnitudes are not symmetric as a function of position angle on the shell. This is expected from the global evolution visible in the animated movie, where considerable non-sphericity is evident over the pulsation cycle. The radial velocities fall broadly in the range kms-1, consistent with the mean shell kinematics discussed in the previous section. Limits on the measured variability of radio continuum flux density from LPV stars at centimeter wavelengths impose constraints on the possible variability in the temperature and radius of the radio photosphere (which is defined to lie immediately interior to the SiO maser zone), and hence on the shock damping which must apply over radii within (Reid & Menten, 1997). Although individual maser components shown in Figure 4 have proper motion magnitudes of up to kms-1, the measured mean gas motion at the inner edge of the SiO maser zone of kms-1, derived in the previous section, is comparable to the expected mean upper limit of 5 kms-1 derived by Reid & Menten (1997). In practice, the strong asymmetry in the near-circumstellar gas motions shown by the data presented here implies a similar level of asymmetry in the likely shock damping in the interior radio photosphere.
As discussed above, pulsation hydrodynamic models predict the simultaneous outflow of gas at inner radii and the infall of gas at larger radii. The outer gas was levitated above the photosphere in earlier pulsation cycles. This is quantified in the numerical models (Bowen, 1988) by a predicted saw-tooth pattern in velocity as a function of radial distance. We do see evidence for this radial distribution of velocities in the TX Cam data for the pulsation period presented here. The eastern component in Figure 5 starts beyond the inner shell radius and falls inwards over part of the cycle, until it meets the next outwardly propagating material near . Simultaneous infall at larger radii is also evident in the movie for other individual components, particularly in the north and south-east parts of the shell. A more detailed proper motion analysis forms part of a subsequent paper in this series.
4 Conclusions
We have monitored the evolution of the 43 GHz SiO circumstellar maser emission towards the Mira variable TX Cam at milliarcsecond spatial resolution over a full pulsation period, covering a stellar phase range from to . This paper presents an animated movie showing the SiO maser evolution over this period, and discusses the overall kinematic properties deduced from these data. In summary, we conclude:
-
(i) The structure of the SiO maser emission at individual observational epochs shows morphological features in common with those found in earlier studies. The maser emission is generally confined to a narrow, projected ring consistent with tangential amplification. The inner shell radius is well-defined but more diffuse emission is often detected at radii beyond the inner boundary. There is significant fine structure, including coherent arcs and filaments, suggestive of localized mass-loss. The high degree of spatial variability observed is consistent with earlier reported single-dish monitoring results.
-
(ii) The SiO maser shell shows significant asymmetry, and can best be described as a fragmented or irregular ellipsoid at many observational epochs. This non-sphericity has important implications for current and future theoretical models of pulsation hydrodynamics in the near-circumstellar environment of LPV stars, which currently generally assume spherical symmetry.
-
(iii) The gas motions, as traced by the SiO emission, predominantly show expansion over the stellar phase interval to . An analysis of the mean shell kinematics during this interval shows clear evidence for ballistic gravitational deceleration. Beyond optical minimum at a new shell forms interior to the outer shell.
-
(iv) Individual maser components have radial proper motion magnitudes in the range kms-1. The proper motions are not symmetric as a function of position angle around the SiO maser shell, and individual maser components may reach up to twice the mean velocity expected from shock damping limits imposed by known upper limits for radio continuum variability of LPV stars.
References
- Alcolea et al. (1999) Alcolea, J., Pardo, J.R., Bujarrabal, V., Bachiller, R., Barcia, A., Colomer, F., Gallego, J.D., Gomez-Gonzalez, J., del Pino Cisneros, A., Planesas, P., del Rio, S., Rodriguez-Franco, A., del Romero, A., Tafalla, M., & de Vicenta, P. 1999, A&AS, 139, 461
- Alvarez et al. (2000) Alvarez, R., Jorissen, A., Plez, B., Gillet, D., & Fokin, A. 2000, A&A, 362, 655
- Aschwanden, Poland, & Rabin (2001) Aschwanden, M.J., Poland, A.I., & Rabin, D.M. 2001, ARA&A, 39, 175
- Bachiller et al. (1997) Bachiller, R., Fuente, A., Bujarrabal, V., Colomer, F., Loup, C., Omont, A., & de Jong, T. 1997, A&A, 319, 235
- Balick & Frank (2002) Balick, B., & Frank, A. 2002, ARA&A, 40, 439
- Barcia, Alcolea, & Bujarrabal (1989) Barcia, A., Alcolea, J., & Bujarrabal, V. 1989, A&A, 215, L9
- Barvainis et al. (1987) Barvainis, R., McIntosh, G., & Predmore, C.R. 1987, Nature, 329, 613
- Benson & Little-Marenin (1996) Benson, P.J., & Little-Marenin, I.R. 1996, ApJS, 106, 579
- Bessell, Scholz & Wood (1996) Bessell, M.S., Scholz, M., & Wood, P.R. 1996, A&A, 307, 481
- Bieging, Shaked, & Gensheimer (2000) Bieging, J.H., Shaked, S., & Gensheimer, P.D. 2000, ApJ, 543, 897
- Boboltz, Diamond, & Kemball (1997) Boboltz, D.A., Diamond, P.J., & Kemball, A.J. 1997, ApJ, 487, 147
- Boboltz & Marvel (2000) Boboltz, D.A., & Marvel, K.B. 2000, ApJ, 545, 149
- Bowen (1988) Bowen, G.H. 1988, ApJ, 329, 299
- Brown (1992) Brown, L.G. 1992, ACM Computing Surveys, 24, 325
- Bujarrabal et al. (1996) Bujarrabal, V., Alcolea, J., Sánchez Contreras, C., & Colomer, F. 1996, A&A, 314, 883
- Cho & Ukita (1995) Cho, S-H. & Ukita, N. 1995, PASJ, 47, L1
- Cho, Kaifu, & Ukita (1996a) Cho, S-H., Kaifu, N., & Ukita, N. 1996a, A&AS, 115, 117
- Cho, Kaifu, & Ukita (1996b) Cho, S-H., Kaifu, N., & Ukita, N. 1996b, AJ, 111, 1987
- Cho, & Ukita (1998) Cho, S-H., & Ukita, N. 1998, AJ, 116, 2495
- Cho et al. (1998) Cho, S-H., Chung, H-S., Kim, H-R., Oh, B-Y., Lee, C-H., & Han, S-T. 1998, ApJS, 115, 277
- Cotton et al. (2003) Cotton, W.D., Mennesson, B., Diamond, P.J., Perrin, G., Coud́e du Foresto, V., Chagnon, G., van Langevelde, H.J., Ridgway, S., Waters, R., Vlemmings, W., Morel, S., Traub, W., Carleton, N., & Lacasse, M. 2003, A&A, in press
- Desmurs et al. (2000) Desmurs, J.F., Bujarrabal, V., Colomer, F., & Alcolea, J. 2000, A&A, 360, 189
- Diamond et al. (1994) Diamond, P.J., Kemball, A.J., Junor, W., Zensus, A., Benson, J., & Dhawan, V. 1994, ApJ, 430, L61
- Diamond, Kemball, & Boboltz (1997) Diamond, P.J., Kemball, A.J., & Boboltz, D.A. 1997, Vistas Astron, 41, 175
- Diamond & Kemball (1999) Diamond, P.J., & Kemball, A.J. 1999, in IAU 191: Asymptotic Branch Stars, eds. T. Le Bertre, A. Lèbre, & C. Waelkens IAU Symposium 191, 195
- Dickinson (1976) Dickinson, D.F. 1976, ApJS, 30, 259
- García-Segura et al. (1999) García-Segura, G., Langer, N., Różyczka, M., & Franco, J. 1999, ApJ, 517, 767
- Gomez et al. (2000) Gómez, J.-L., Marscher, A.P., Alberdi, A., Jorstad, S.G., & García-Miró, C. 2000, Science, 289, 2317
- González-Alfonso, Alcolea, & Cernicharo (1996) González-Alfonso, E., Alcolea, J., & Cernicharo, J. 1996, A&A, 313, L13
- Gray, Humphreys, & Yates (1999) Gray, M.D., Humphreys, E.M.L., & Yates, J.A. 1999, MNRAS, 304, 906
- Greenhill et al. (1995) Greenhill, L.J., Colomer, F., Moran, J.M., Backer, D.C., Danchi, W.C., & Bester, M. 1995, ApJ, 449, 365
- Habing (1996) Habing, H.J. 1996, ARA&A, 7, 97
- Hartigan et al. (2001) Hartigan, P., Morse, J.A., Reipurth, B., Heathcote, S., & Bally, J. 2001, ApJ, 559, L157
- Hinkle, Hall, & Ridgway (1982) Hinkle, K.H., Hall, D.N.B., & Ridgway, S.T. 1982, ApJ, 252, 697
- Hinkle, Scharlach, & Hall (1984) Hinkle, K.H., Scharlach, W.W.G., & Hall, D.N.B. 1984, ApJS, 56, 1
- Hinkle, Lebzelter, & Scharlach (1997) Hinkle, K.H., Lebzelter, T., & Scharlach, W.W.G 1997, AJ, 114, 2686
- Humphreys et al. (1996) Humphreys, E.M.L., Gray, M.D., Yates, J.A., Field, D., Bowen, G., & Diamond, P.J. 1996, MNRAS, 282, 1359
- Humphreys et al. (2002) Humphreys, E.M.L., Gray, M.D., Yates, J.A., Field, D., Bowen, G.H., & Diamond, P.J. 2002, A&A, 386, 256
- Imai et al. (2002) Imai, H., Obara, K., Diamond, P.J., Omodaka, T., & Sasao, T. 2002, Nature, 417, 829
- Jewell et al. (1987) Jewell, P.R., Dickinson, D.F., Snyder, L.E., & Clemens, D.P. 1987, ApJ, 323, 749
- Kemball, Diamond & Cotton (1995) Kemball, A.J., Diamond, P.J., & Cotton, W.D. 1995, A&AS, 110, 383.
- Kemball & Diamond (1997) Kemball, A.J., & Diamond, P.J. 1997, ApJ, 481, L111
- Kholopov et al. (1985) Kholopov, P.N., Samus, N.N., Frolov, M.S., Goranskij, V.P., Gorynya, N.A., Kireeva, N.N., Kukarkina, N.P., Kurochin, N.E., Medvedeva, G.I., Perova, N.B., & Shugarov, S.Yu. 1985, General Catalogue of Variable Stars (Moscow Publishing House:Moscow)
- Knapp & Morris (1985) Knapp, G.R., & Morris, M. 1985, ApJ, 292, 640
- Lewis (1997) Lewis, B.M. 1997, AJ, 114, 1602
- Lindqvist et al. (1988) Lindqvist, M., Nyman, L.-Å., Olofsson, H., & Winnberg, A. 1988, A&A, 205, L15
- Martinez, Bujarrabal & Alcolea (1988) Martinez, A., Bujarrabal, V., & Alcolea, J. 1988, AASS, 74, 273
- McIntosh (1987) McIntosh, G.C. 1987, Ph.D thesis, Univ. of Massachusetts.
- Merrill (1921) Merrill, P.W. 1921, ApJ, 53, 185
- Miyoshi et al. (1994) Miyoshi, M., Matsumoto, K., Kameno, S., Takaba, H., & Iwata, T. 1994, Nature, 371, 395
- Olofsson et al. (1998) Olofsson, H., Lindqvist, M., Nyman, L-Å., & Winnberg, A. 1998, A&A, 329, 1059
- Olivier, Whitelock, & Marang (2001) Olivier, E.A., Whitelock, P., & Marang, F. 2001, MNRAS, 326, 490
- Pijpers, Pardo, & Bujarrabal (1994) Pijpers, F.P., Pardo, J.R., & Bujarrabal, V. 1994, A&A, 286, 501
- Pegourie (1987) Pegourie, B. 1987, Ap&SS, 136, 133
- Reid & Menten (1997) Reid, M.J., & Menten, K.M. 1997, ApJ, 476, 327
- Soker (2002) Soker, N. 2002, MNRAS, 336, 826
- Spencer et al. (1977) Spencer, J.H., Schwartz, P.R., Waak, J.A., & Bologna, J.M. 1977, AJ, 82, 706
- Tuthill et al. (2000) Tuthill, P.G., Monnier, J.D., Danchi, W.C., & Lopez, B. 2000, ApJ, 543, 284
- Walker (1997) Walker, R.C. 1997, ApJ, 488, 675
- Wallerstein (1985) Wallerstein, G. 1985, PASP, 97, 994
- Weaver et al. (1995) Weaver, H.A., AH́earn, M.F., Arpigny, C., Boice, D.C., Feldman, P.D., Larson, S.M., Lamy, P., Levy, D.H., Marsden, B.G., Meech, K.J., Noll, K.S., Scotti, J.V., Sekanina, Z., Shoemaker, C.S., Shoemaker, E.M., Smith, T.E., Stern, S.A., Storrs, A.D., Trauger, J.T., Yeomans, D.K., & Zellner, B. 1995, Science, 267, 1282
- Willson (2000) Willson, L.A. 2000, in Unsolved problems in stellar evolution, ed. M. Livio (Cambridge: Cambridge Univ. Press), 227
- Wilson & Barrett (1972) Wilson, W.J., & Barrett, A.H. 1972, A&A, 17, 385.

| Epoch code | Observing date | Optical phase aaThe optical phase is computed using the optical maximum at MJD = 50773 cited by Gray, Humphreys, & Yates (1999), and assuming their quoted uncertainty . A mean period of 557.4 days is adopted (Kholopov et al., 1985). |
|---|---|---|
| BD46A | 1997 May 24 | 0.68 0.01 |
| BD46B | 1997 June 7 | 0.70 0.01 |
| BD46C | 1997 June 22 | 0.73 0.01 |
| BD46D | 1997 July 6 | 0.75 0.01 |
| BD46E | 1997 July 19 | 0.78 0.01 |
| BD46F | 1997 August 2 | 0.80 0.01 |
| BD46G | 1997 August 16 | 0.83 0.01 |
| BD46H | 1997 August 28 | 0.85 0.01 |
| BD46I | 1997 September 12 | 0.87 0.01 |
| BD46J | 1997 September 26 | 0.90 0.01 |
| BD46K | 1997 October 9 | 0.92 0.01 |
| BD46L bbFailed epochs, which could not be successfully reduced in full. | 1997 October 25 | 0.95 0.01 |
| BD46M | 1997 November 8 | 0.98 0.01 |
| BD46N | 1997 November 21 | 0.00 0.01 |
| BD46O | 1997 December 5 | 1.03 0.01 |
| BD46P | 1997 December 17 | 1.05 0.01 |
| BD46Q bbFailed epochs, which could not be successfully reduced in full. | 1997 December 30 | 1.07 0.01 |
| BD46R | 1998 January 13 | 1.10 0.01 |
| BD46S | 1998 January 25 | 1.12 0.01 |
| BD46T | 1998 February 5 | 1.14 0.01 |
| BD46U | 1998 February 22 | 1.17 0.01 |
| BD46V | 1998 March 5 | 1.19 0.01 |
| BD46W bbFailed epochs, which could not be successfully reduced in full. | 1998 March 21 | 1.22 0.01 |
| ccThis epoch was not scheduled. | 1998 April 4 | 1.24 0.01 |
| BD46X | 1998 April 19 | 1.27 0.01 |
| BD46Z bbFailed epochs, which could not be successfully reduced in full. | 1998 May 10 | 1.30 0.01 |
| BD46AA | 1998 May 22 | 1.33 0.01 |
| BD46AB | 1998 June 6 | 1.35 0.01 |
| BD46AC | 1998 June 18 | 1.37 0.01 |
| BD46AD | 1998 July 3 | 1.40 0.01 |
| BD46AE | 1998 July 23 | 1.44 0.01 |
| BD46AF | 1998 August 9 | 1.47 0.01 |
| BD46AG | 1998 August 23 | 1.49 0.01 |
| BD46AH | 1998 September 9 | 1.52 0.01 |
| BD46AI | 1998 September 25 | 1.55 0.01 |
| BD46AJ | 1998 October 14 | 1.59 0.01 |
| BD46AK | 1998 October 29 | 1.61 0.01 |
| BD46AL | 1998 November 17 | 1.65 0.01 |
| BD46AM | 1998 December 6 | 1.68 0.01 |
| BD46AN | 1998 December 23 | 1.71 0.01 |
| BD46AO bbFailed epochs, which could not be successfully reduced in full. | 1999 January 5 | 1.74 0.01 |
| BD46AP | 1999 January 23 | 1.77 0.01 |
| BD46AQ | 1999 February 6 | 1.79 0.01 |
| BD46AR | 1999 February 19 | 1.82 0.01 |