Chapter 0 Type Ia supernovae: spectroscopic surprises
Recent observations have extended the range of diversity among spectra of Type Ia supernovae. I briefly discuss SN Ia explosion models in the spectroscopic context, the observed diversity, and some recent results obtained with the Synow code for one normal and two peculiar SNe Ia. Relating the observational manifestations of diversity to their physical causes is looking like an ever more challenging problem.
1 Introduction
“Surprises” refers not only to some recent developments in Type Ia supernova (SN Ia) spectroscopy that will be discussed below, but also to additional recent discoveries that I will be able only to mention, such as the polarization signal in SN 2001el (Wang et al. 2003; see also the chapter by Wang); the unusual properties of SN 2001ay (see the chapter by Howell); and the circumstellar H emission of SN 2002ic (Hamuy et al. 2003; see also the chapter by Hamuy). The scope of this chapter is restricted to photospheric–phase optical spectra. For recent results on infrared spectra see, e.g., Marion et al. (2003).
Some background, including mention of the various kinds of SN Ia explosion models in the spectroscopic context, is in §1.2. An overview and update of the SN Ia spectroscopic diversity is in §1.3. Some recent results from direct analysis of the spectra of three events (the normal SN 1998aq and the peculiar SNe 2000cx and 2002cx), obtained with the parameterized, resonance scattering code Synow, are discussed in §1.4. The final section (§1.5) contains more questions than conclusions.
2 Background
Around the time of maximum light the optical spectrum of a normal SN Ia consists of a thermal continuum with superimposed features due to lines of ions such as Si II, S II, Ca II, and O I. Ubiquitous blends of Fe II develop shortly after maximum. The features are formed by resonance scattering of the photospheric continuum and have P Cygni–type profiles characteristic of expanding atmospheres. Emission components peak at the rest wavelength and absorption components are blueshifted according to the velocity of the matter at the photosphere, ordinarily km s-1.
SNe Ia are thought to be thermonuclear disruptions of accreting or merging carbon–oxygen white dwarfs. The classic SN Ia explosion model is model W7 of Nomoto, Thielemann, & Yokoi (1984), a 1D model that was constructed by parameterizing the speed of the nuclear burning front. Because the speed remained subsonic, W7 is known as a deflagration model (but see below). The composition structure of W7 is radially stratified, with a low-velocity ( km s-1) 1 M⊙ core of iron-peak elements (initially mostly radioactive 56Ni), surrounded by 0.3 M⊙ of intermediate-mass elements such as silicon, sulfur, and oxygen expanding at to km s-1, capped by 0.1 M⊙ of unburned carbon and oxygen moving at to km s-1. Synthetic-spectrum calculations of various levels of complexity (Branch et al. 1985; Wheeler & Harkness 1990; Nugent et al. 1995; Salvo et al. 2001; Lentz et al. 2001a) have shown that the spectra of W7, with or without mixing of the layers above km s-1, generally resemble the observed spectra of normal SNe Ia. Recent detailed calculations with the Phoenix code indicate that spectra of model W7 begin to differ from observed spectra after maximum light (Lentz et al. 2001a), and that they may fail to quantitatively reproduce the dependence of the parameter on temperature (S. Bongard et al., in preparation). Nevertheless, there seems to be something right about the basic composition structure of W7: an iron–peak core surrounded by lighter elements.
In 1D delayed–detonation models (Khokhlov 1991) the subsonic deflagration makes a transition to a supersonic detonation when the burning front reaches a transition density that is treated as a free parameter. Composition structures of 1D delayed–detonations are not extremely different from that of model W7. The main differences are in the outer, high–velocity layers, because in delayed–detonations the burning front extends farther into the outer layers of the white dwarf and leaves less unburned carbon than W7. [A nice comparison of the composition structures of W7 and a 1D delayed–detonation can be found in Sorokina et al. (2000).] Höflich and colleagues (e.g., Höflich 1995; Höflich, Wheeler, & Thielemann 1998; Wheeler et al. 1998; see also the chapter by Höflich) have maintained that spectra of delayed–detonation models agree well with the observed spectra of normal SNe Ia.
Only recently have 3D deflagrations been calculated (Khokhlov 2000; Gamezo et al. 2003; see also the chapter by Gamezo, Khokhlov, & Oran and references therein). The composition structure of the 3D deflagration presented by Khokhlov and Gamezo et al. is quite unlike that of a 1D deflagration. The 3D model contains clumps of iron–peak elements surrounded by shells of intermediate–mass elements, all embedded in a substrate of unburned carbon and oxygen. The angle–averaged composition is not strongly radially stratified; in fact, unburned carbon is present all the way to the center. Although the model has not yet been evolved to homologous expansion, it is unlikely that it will be compatible with the observed spectra of normal SNe Ia. The presence of unburned carbon at low velocity may not be a problem during the first months after explosion (Baron et al. 2003; see also the chapter by Lentz), but a strong argument can be made for a smooth distribution of silicon in normal SNe Ia in order to consistently produce the deep 6100 Å absorption (Thomas et al. 2002; see also the chapter by Thomas). The 3D model also would produce [C II] and [O I] lines in the nebular phase (C. Kozma et al., in preparation), which are not observed. However, some future 3D deflagration models may be different: much may depend, for example, on whether the deflagration originates at a single point or practically simultaneously at several or even a multitude of points.
In the chapter by Gamezo et al. a 3D delayed–detonation model is discussed, in which the composition structure is radially stratified, rather like 1D explosion models. If the composition structures of future 3D deflagrations continue to be very different from that of model W7, perhaps W7 should be referred to as a parameterized 1D model, rather than as a deflagration, because its composition structure may be more like 3D delayed–detonations.
The effects on explosion models of rapid rotation of the white–dwarf progenitors (Uenishi et al. 2003; see also the chapter by Yoon and Langer) has not yet begun to be taken into account.
3 Spectroscopic diversity
Nugent et al. (1995) showed that retaining the composition structure of model W7 and varying the temperature produced a sequence of synthetic spectra that resembled a sequence of observed SN Ia spectra ranging from the peculiar powerful SN 1991T, with its high–excitation Fe III features, through the normals, to the peculiar weak SN 1991bg, with its low–excitation Ti II features. Quantitatively, the sequence was arranged according to increasing values of the parameter , the ratio of the depth of an absorption feature near 5700 Å to the depth of the deeper absorption near 6100 Å that is primarily due to Si II 6355. [The major contributors to the 5700 Å aborption remain uncertain (Garnavich et al. 2001, S. Bongard et al., in preparation)]. As shown by Nugent et al. (1995), Garnavich et al. (200?), and Benetti et al. (2003), the parameter correlates with the light–curve decline–rate parameter of Phillips (1993).
But it has become well known that not all SNe Ia can be forced into a single spectroscopic sequence. Events such as SN 1984A have the same spectral features as normal SNe Ia but higher expansion velocities at a given epoch. I will refer to the most extreme of these as HPV (high photospheric velocity) SNe Ia. Lentz et al. (2001b) found that certain delayed–detonation models, with their high densities in the high–velocity ( km s-1) layers, were able to account well for the spectra of SN 1984A. The HPV SNe Ia have high values of the parameter — the velocity corresponding to the blueshift of the Si II 6355 absorption at 10 days after maximum light (Branch & van den Bergh 1993). Hatano et al. (2000) presented a plot of against to illustrate the extent to which some events having similar values of have different values of . Hatano et al. suggested that it may be useful to think of (like ) as a measure of the ejected nickel mass and as a measure of the density in the high–velocity layers — whether the high density actually is produced by a delayed detonation or not. Similarly, one can plot against , as in Fig. 1. Plotting allows some interesting events for which is unavailable to be included. The dashed line serves to represent the Nugent “temperature” sequence connecting the peculiar SN 1991bg to the peculiar SN 1991T via the normal SN 1994D (a different normal event, e.g., SNe 1989B, 1996X, or SN 1998bu, could just as well have been chosen). SN 2001ay, an HPV event with a very slow postmaximum light–curve decline (see the chapter by Howell) and SN 2002cx (Li et al. 2003) have extended the observed range of and , respectively, and the value of plotted for SN 2002cx is an upper limit because the Si II absorption was seen only near maximum light.

4 Recent results with Synow
The spectroscopically normal SN 1998aq was thoroughly observed by the CfA group. In Fig. 1 it falls in a region heavily populated by normals. One result of a recent direct analysis of the photospheric–phase spectra with the Synow code (Branch et al. 2003) was good evidence for the presence of C II lines indicating the presence of carbon at velocities at least as low as 11,000 km s-1. Mazzali (2000) identified the same lines, but at higher velocity, km s-1, in the normal SN 1990N. Carbon as slow as 11,000 km s-1 would be inconsistent with published 1D delayed–detonation models. Most of the other spectral features in the early spectra were securely identified, making SN 1998aq a useful benchmark for comparison with other SNe Ia.
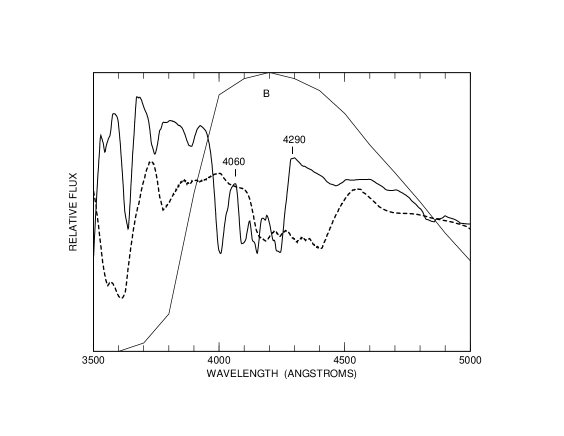
SN 2000cx was extensively observed by Li et al. (2002), who referred to it as uniquely peculiar. In Figure 1 it falls among the normals, but the unusual properties discovered by Li et al. included a lopsided –band light curve — quick to rise but slow to fall — and a strange color evolution — from redder than normal before maximum to bluer than normal after maximum. The many spectral peculiarities included Ca II infrared–triplet absorptions forming not only at the photospheric velocity of km s-1 but also at much higher velocity, greater than 20,000 km s-1. Thomas et al. (2003) investigated the high–velocity Ca II features with a parameterized 3D spectrum–synthesis code and concluded that they probably formed in a nonspherical high–velocity structure that partially covered the photosphere. Kasen et al. (2003) already had reached a similar conclusion for the high–velocity Ca II features discovered by Wang et al. (2003) in SN 2001el, for which polarization measurements clearly indicated a strong departure from spherical symmetry in the high–velocity matter. I will refer to features like these as DHVFs (detached high velocity features). Direct analysis of the photospheric–phase spectra of SN 2000cx with Synow (D. Branch et al., in preparation) reveals that in the blue, the spectra were composite, containing some features forming just above the photospheric velocity, but also containing additional DHVFs forming at the same high velocity as the Ca II DHVFs. In particular, blends of Ti II HDVFs suppressed the spectrum in the blue (see Figure 2). The flux blocking by Ti II HDVFs decreased with time, which is in the right sense to cause the –band light curve to rise more quickly and fall more slowly than it otherwise would have done, and to cause the peculiar evolution. Quantitative evaluation of the effects of line blocking by DHVFs forming in an asymmetric matter distribution will require 3D spectrum calculations such as those of Thomas et al. (2003). In any case, as an extreme case of DHVFs SN 2000cx shows the importance of learning how much of the SN Ia spectroscopic and photometric diversity is caused by DHVFs.
SN 2000cx spectra contained a distinct, persistent absorption feature near 4530 Å for which the most plausible identification that we (Thomas et al. 2003 and Branch et al., in preparation) can suggest is an H (4861) DHVF, blueshifted by the same high velocity as the Ca II and Ti II DHVFs. At this blueshift the H absorption happens to fall within the red Si II absorption. As discussed by Thomas et al. and Branch et al., if H and P are confined to a clump in front of the photosphere and have source functions that are elevated relative to the resonance–scattering source function (as they generally do in SNe II), then they could be difficult to see. In principle their spectroscopic signatures even could vanish. The H identification remains tentative, however, because there is no independent evidence for the presence of hydrogen.
SN 2002cx was just as surprising as SN 2000cx. Li et al. (2003) observed SN 2002cx and referred to it as the “most peculiar” SN Ia. Near maximum its spectra first contained features of Fe III; Fe II features developed later. Despite the fact that Si II and S II features apparently were not present, Li et al. argued that SN 2002cx should be regarded as a Type Ia — the first one observed to be blue, yet subluminous. At maximum light the velocity at the photosphere was only 7000 km s-1, making it the first good example of an LPV (low photospheric velocity) SN Ia. Li et al. called attention to mysterious emission lines in the red part of spectra obtained three weeks postmaximum, and to what appeared to be an unusually early appearance of nebular emission lines two months postmaximum. The early development of the nebular phase was taken as an indication that the mass ejection may have been sub–Chandraskhar. Direct analysis with Synow (D. Branch et al., in preparation) clarifies some of these issues. At maximum light the spectrum contained not only Fe III features but also weak features of Si III, Si II, and S II — confirming the Type Ia classification. The spectrum also contained Fe II and Ca II DHVFs forming at about 14,000 km s-1. The Synow analysis reveals that in the spectrum several weeks postmaximum the mysterious emission lines in the red actually are blends of P Cygni features of permitted Fe II and Co II lines (see Figure 3), and that the spectrum two months postmaximum had not gone nebular — it was much like the two–week postmaximum spectrum, but with stronger Fe II and weaker Co II. SN 2002cx raises several interesting questions. For example, if the ejected composition was dominated by iron–peak elements, the kinetic energy per unit mass should have been high, so why were the velocities low? And if the mass ejection was Chandraskhar, why was the luminosity low? One possibility (see the chapter by Kasen) is that SN 2002cx was a low–luminosity SN 1991bg–like event, viewed right down the hole in the ejecta caused by the presence of the donor star (Marietta, Burrows, & Fryxell 2000).

5 Questions
Thinking of as a measure of the nickel mass and of as a measure of the density at high velocity may be a useful way to think about the diversity, but clearly it is not enough. Some of the diversity is produced by DHVFs, which we now recognize to be not uncommon in SNe Ia. Weak DHVFs such as those of SN 1994D (Hatano et al 1999) may be caused by radial ionization variations in smooth ejecta density distributions (Höflich et al. 1998; Lentz et al. 2001a), but what is the origin of the stronger DHVFs — those that appear to require density enhancements at high velocity? The most extreme case so far is SN 2000cx with its strong Ti II DHVFs. The DHVFs of SNe 2001el and 2000cx appear to be in asymmetric matter distributions. Are they a consequence of asymmetric matter ejection?
Has an H DHVF been detected in SN 2000cx? If so, at least some of the matter producing the DHVFs of SN 2000cx must have come from a nondegenerate companion star. Do any other SNe Ia also show H DHVFs, at less noticeable levels? Gerardy et al. (2003) suggest that strong DHVFs are produced by high–velocity density enhancements owing to interaction with solar–abundance circumstellar matter. If this is correct, then it may be DHVFs, rather than narrow H emission or absorption, that are the first to reveal the presence of the long–sought circumstellar matter associated with SN Ia single–degenerate progenitor systems.
Events such as SNe 2001ay, 2002cx, and 2002ic seem, so far, to be peculiar each in their own way. As mentioned above, the effects of the Marietta et al. hole in the ejecta may be responsible for some of the peculiarities of SN 2002cx, as well as some of the other SN Ia diversity (see the chapter by Kasen). SN 2002ic (Hamuy et al. 2003; see also the chapter by Hamuy) evidently is a very special case, since it shows a clear signature of circumstellar hydrogen to a degree that would not have been missed in spectra of previously observed SNe Ia. Note that the characteristic velocity of the H emission of SN 2002ic, km s-1, is much lower than the velocity of the H DHVF tentatively identified in SN 2000cx ( km s-1).
Learning how to relate the various manifestations of observational diversity — the range of and values, the DHVFs, and the individually peculiar events — to their physical causes — e.g., nickel mass, flame propagation, asymmetric ejection, asymmetric circumstellar interaction, looking down the hole — is looking like an increasingly challenging problem.
Acknowledgements: I have had the benefit of many discussions of these matters with Eddie Baron, Peter Höflich, Dan Kasen, Peter Nugent, and Rollin Thomas. It is a pleasure to take this opportunity to thank Craig Wheeler for all he has done to make supernova research so interesting and enjoyable.
99
References
- Baron, E., Lentz, E. J., & Hauschildt, P. H. 2003, ApJ, 588, L29
- Benetti, S., et al. 2003, MNRAS, in press
- Branch, D., Doggett, J. B., Nomoto, K., & Thielemann, F.-K. 1985, ApJ, 294, 619
- Branch, D., & van den Bergh, S. 1993, AJ, 105, 2231
- Branch, D., et al. 2003, AJ, 126, 1489
- Gamezo, V. N., Khokhlov, A. M., Oran, E. S., Chtchelkanova, A. Y., & Rosenberg, R. O. 2003, Science, 299, 77
- Garnavich, P., et al. 2001, astro-ph/0105490
- Gerardy, C. L., et al. 2003, ApJ, submitted
- Hamuy, M., et al. 2003, Nature, 424, 651
- Hatano, K., Branch, D., Lentz, E. J., Baron, E., Filippenko, A. V., & Garnavich, P. M. 2000, ApJ, 543, L49
- Hatano, K., Branch, D., Fisher, A., Baron, E., & Filippenko, A. V. 1999, ApJ, 525, 881
- Höflich, P. 1995, ApJ, 443, 831
- Höflich, P., Wheeler, J. C., & Thielemann, F.-K. 1998, ApJ, 495, 617
- Kasen, D., et al. 2003, ApJ, 593, 788
- Khokhlov, A. M. 1991, A&A, 245, 114
- Khokhlov, A. M. 2000, astro-ph/0008463
- Lentz, E. J., Baron, E., Branch, D., & Hauschildt, P. H. 2001b, ApJ, 547, 402
- Lentz, E. J., Baron, E., Branch, D., & Hauschildt, P. H. 2001a, ApJ, 557, 266
- Li, W., et al. 2003, PASP, 115, 453
- Li, W., et al. 2002, PASP, 113, 1178
- Marion, G. H., Höflich, P., Vacca, W. D., & Wheeler, J. C. 2003 ApJ, 591, 316
- Marietta, E., Burrows, A., & Fryxell, B. 2000, ApJS, 128, 615
- Mazzali, P. A., 2001, MNRAS, 321, 341
- Nomoto, K., Thielemann, F.-K., & Yokoi, K., 1984, ApJ, 286, 644
- Nugent, P., Phillips, M. M., Baron, E., Branch, D., & Hauschildt, P. 1995, ApJ, 455, L147
- Phillips, M. M. 1993, ApJ, 413, L105
- Salvo, M. E., Capppellaro, E., Mazzali, P. A., Benetti, S., Danziger, I. J., Patat, F. & Turatto, M. 2001, MNRAS, 321, 254
- Sorokina, E. I., Blinnikov, S. I., & Bartunov, O. S. 2000, Astr. Let. 26, 67
- Thomas, R. C., Branch, D., Baron, E., Nomoto, K., Li, W., & Filippenko, A. V. 2003, ApJ, in press
- Thomas, R. C., Kasen, D., Branch, D., & Baron, E. 2002 ApJ, 567, 1037
- Uenishi, T., Nomoto, K., & Hachisu, I. 2003, ApJ, 595, 1094
- Wang, L., et al. 2003, ApJ, 591, 1110
- Wheeler, J. C., Höflich, P., Harkness, R. P., & Spyromilio, J. 1998, ApJ, 496, 908
- Wheeler, J. C., & Harkness, R. P. 1990, Rep. Prog. Phys. 53, 1467