XMM-Newton observation of SNR RX J1713.7–3946
Abstract
We present the first results of the observations of the supernova remnant RX J1713.7–3946 (also G347.3–0.5) obtained with the EPIC instrument on board the XMM-Newton satellite. We show a 5 pointings mosaiced image of the X-ray synchrotron emission. We characterize this emission by mapping its spectral parameters (absorbing column density and photon index ). The synchrotron spectrum is flat at the shock and steep in the interior of the remnant. is well correlated with the X-ray brightness. A strong is found in the southwest rim of RX J1713.7–3946. We suggest that the SNR is interacting with a Hi region there.
Service d’Astrophysique, CEA Saclay, 91191 Gif-sur-Yvette, France
Instituto de Astronomía y Física del Espacio, CC 67, Suc. 28, 1428, Buenos Aires, Argentina
1. Introduction
RX J1713.7–3946 is a shell-type supernova remnant (SNR) located in the Galactic plane that was discovered with the ROSAT all-sky survey (Pfeffermann & Aschenbach 1996). The observation of the northwestern shell of the SNR with the ASCA satellite has shown the presence of pure non-thermal emission (Koyama et al. 1997). Further observations with ASCA of most of the remnant did not reveal traces of the thermal emission, being likely overwhelmed by the bright X-ray synchrotron emission (Slane et al. 1999).
Both the distance and age of RX J1713.7–3946 are still not well known. Based on the X-ray measurement of the column density toward this source, Koyama et al. (1997) derived a distance of 1 kpc, while Wang et al. (1997) argued that it exploded in AD 393. Subsequently, Slane et al. (1999) proposed a larger distance of 6 kpc based on its probable association with three dense and massive molecular clouds. Assuming a Sedov phase evolution, an age of a few years is derived for such a distance.
In the radio, the emission arises from faint filaments aligned with the X-ray shell of RX J1713.7–3946. GeV and TeV -ray emissions were detected by EGRET to the northeast of the SNR (Hartman et al. 1999; Butt et al. 2001) and by CANGAROO in the northwest (Muraishi et al. 2000; Enomoto et al. 2002). The association of these high energy emissions with RX J1713.7–3946 has been the subject of debate (Reimer & Pohl 2002, Butt et al. 2002).
In this paper, we intend to give for the first time a detailed description of the X-ray emission of RX J1713.7–3946 with the XMM-Newton observatory. The high sensitivity of XMM-Newton will allow us to carry out a spectral analysis at medium scale of the emission structures and then to produce for the first time a mapping of the spectral parameters of RX J1713.7–3946.
2. Observations
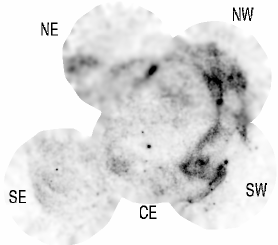
SNR RX J1713.7–3946 was observed with the three EPIC instruments (namely the MOS1, MOS2 and pn cameras) on board the XMM-Newton satellite in the course of the AO-1 program. The observations were performed in five distinct pointings, each of around 10 ks duration. They correspond schematically to the center, northeast, northwest, southwest and southeast (hereafter CE, NE, NW, SW, SE, respectively) parts of RX J1713.7–3946.
 |
 |
 |
 |
3. Spectro-imaging of SNR RX J1713.7–3946
3.1. X-ray morphology
Figure 1 (top-left panel) shows the mosaiced image of RX J1713.7–3946 in the 2-10 keV energy band. The 5 pointings do not permit to cover the entire remnant (notably in the East) and show an unclassical X-ray synchrotron morphology. The brightest regions found in the west are also the more structured. At large scale, a kind of double shell stands out. A first shell toward the interior is more or less circular whereas a second one, less easy to imagine, is split into a few arcs.
3.2. Spatial and spectral characterizations of the synchrotron emission
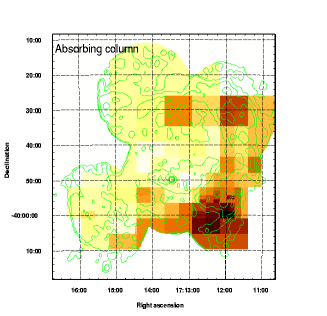
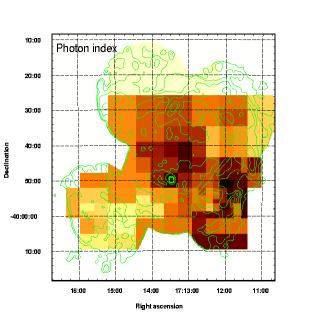
To map and characterize the spectrum of the non-thermal emission, we create an adaptative spatial grid from which the X-ray spectra (MOS, pn) are extracted and fitted with a simple power-law. Each pixel of the grid has approximately counts (MOS+pn). The adjusted value of the spectral parameters (absorbing column density and photon index ) is then attributed to the corresponding pixel grid to construct the map.
Figure 1 (bottom panels) shows the (left) and (right) maps obtained by the method described above. The variations of absorbing column density are strong since varies from cm-2 to cm-2. The mean relative error on the absorbing column in each pixel grid is with a maximum value of . In the SE and CE, is low with a value cm-2 whereas it is larger in the NW ( cm-2) and SW ( cm-2). It is surprising to find a high value in the SW since no molecular clouds are found there. This point is discussed in Sect. 3.3..
Figure 1 (bottom-right panel) shows that the variations of photon index are important. varies from to . The mean relative error on in each pixel grid is with a maximum value of . The spectrum is steep in the faint CE region and flat at the shock particularly in the SE and NW, except in a few places in the SW which are coincident with the faint X-ray emission.
3.3. Interaction with clouds
Figure 1 (bottom-left panel) shows that the absorbing column density and the X-ray brightness are correlated. For instance, the is large where the X-ray brightness is strong. If the absorbing column was not related to the remnant, we would not expect any link between the and the X-ray brightness. That we observe a correlation means that the increased absorption density somehow amplifies the X-ray brightness. This can be interpreted as the result of the SNR interaction with some absorbing material in the brightest regions.
It is possible to estimate the density of the absorbing material if one assumes that the angular size of the absorbing material is the same along the line-of-sight and in projection on the sky. If it is so, the density of the absorbing matter is
| (1) |
where is the SNR distance and is the variation of the absorbing column density at scale . Typically in the SW region, and cm-2. At 6 kpc, it yields .
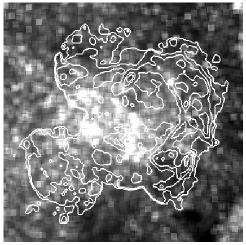
To check that the additional column density is real, we have looked at the map of integrated star light (Fig. 1, top-right panel) which should somehow reflect variations. This test confirms a good correlation between our inferred column density and the optical brightness which makes us confident in our map.
The pending question is then to determine the nature of the matter interacting with SNR RX J1713.7–3946. In the west side of the remnant, there is no evidence for an interaction with molecular clouds since CO observations have shown that they are located in the north. The shock front of the remnant may have reached a stellar wind bubble shell. This is a possible and already proposed scenario (Slane et al. 1999) due to the low density medium in which the remnant seems to evolve. However, the regions of low integrated star light extend much further than the remnant’s extent (Fig. 1, top-right panel) whereas a stellar wind shell would be relatively thin. So it is also possible that a preexisting Hi region is interacting with SNR RX J1713.7–3946. This point is supported by the fact that the density that we derive from Eq. (1) is typical of Hi densities in the ISM. Recent Hi observations at high resolution around RX J1713.7–3946 (Koo et al. 2004) also indicate an excess in that direction.
Acknowledgments.
G.C.-C. would like to thank cordially Jocelyn Bell Burnel and Joseph H. Taylor for their encouragements.
References
Butt, Y. M., Torres, D. F., Combi, J. A., Dame, T., & Romero, G. E. 2001, ApJ, 562, L167
Butt, Y. M., Torres, D. F., Romero, G. E., Dame, T. M., & Combi, J. A. 2002, Nature, 418, 499
Enomoto, R., Tanimori, T., Naito, T. et al. 2002, Nature, 416, 823
Hartman, R. C., et al. 1999, ApJS, 123, 79
Koyama, K., Kinugasa, K., Matsuzaki, K. et al. 1997, PASJ, 49, L7
Koo, B.-C., Kang, J., & McClure-Griffiths, N. 2004, these proceedings.
Muraishi, H., Tanimori, T., Yanagita et al. 2000, A&A, 354, L57
Pfeffermann, E. & Aschenbach, B. 1996, in Roentgenstrahlung from the Universe, ed. H. H. Zimmermann, J. Trümper, & H. Yorke (MPE Rep. 263; Garching: MPE), 267
Reimer, O. & Pohl, M. 2002, A&A, 390, L43
Slane, P., Gaensler, B. M., Dame, T. M. et al. 1999, ApJ, 525, 357