Thermal states of coldest and hottest neutron stars in soft X-ray transients
We calculate the thermal structure and quiescent thermal luminosity of accreting neutron stars (warmed by deep crustal heating in accreted matter) in soft X-ray transients (SXTs). We consider neutron stars with nucleon and hyperon cores and with accreted envelopes. It is assumed that an envelope has an outer helium layer (of variable depth) and deeper layers of heavier elements, either with iron or with much heavier nuclei (of atomic weight ) on the top (Haensel & Zdunik, 1990, 2003). The relation between the internal and surface stellar temperatures is obtained and fitted by simple expressions. The quiescent luminosity of the hottest (low-mass) and coldest (high-mass) neutron stars is calculated, together with the ranges of its possible variations due to variable thickness of the helium layer. The results are compared with observations of SXTs, particularly, containing the coldest (SAX J1808.4–3658) and the hottest (Aql X-1) neutron stars. The observations of SAX J1808.4–3658 in a quiescent state on March 24, 2001 (Campana et al., 2002) can be explained only if this SXT contains a massive neutron star with a nucleon/hyperon core; a hyperon core with a not too low fraction of electrons is preferable. Future observations may discriminate between the various models of hyperon/nucleon dense matter. The thermal emission of SAX J1808.4–3658 is also sensitive to the models of plasma ionization in the outermost surface layers and can serve for testing such models.
Key Words.:
stars: neutron – dense matter – equation of state – stars: individual: Aql X-1, SAX J1808.4–3658– X-rays: binaries1 Introduction
We study the thermal structure of accreting neutron stars in soft X-ray transients (SXTs) — close binaries with a low-mass companion (e.g., Chen et al. 1997). Active states of SXTs are associated with intense accretion energy release and accretion outbursts on the neutron-star surfaces. These states are separated by long periods of quiescence, when the accretion is switched off or strongly suppressed. As noticed by Brown et al. (1998), the spectrum of quiescent emission is well fitted by a neutron-star atmosphere model and may thus be of thermal origin, being supported by the deep crustal heating due to nuclear transformations in the accreted matter.
Recently the thermal structure and thermal emission of neutron stars in the SXTs has been studied by Brown et al. (2002), taking into account that hydrogen burning in the surface layers may proceed far beyond Fe, up to Te (with nuclear mass numbers ), via the rapid proton capture process (Schatz et al., 2001). The ashes of this burning have large nuclear charges , which greatly reduces the thermal conductivity of accreted matter and increases the internal stellar temperature for a given effective surface temperature (or a given surface thermal luminosity ). However, the heavy nuclei may photodisintegrate in “superbursts” (Schatz et al., 2003), producing nuclei of the iron group, with smaller . Moreover, recently Woosley et al. (2003) have performed new modeling of X-ray bursts with updated physics input. Among many simulated X-ray bursts, only one anomalous burst produced heavy nuclei (), while the other bursts produced nuclei with . Taking into account a very wide range of physical conditions in bursting neutron stars, we consider both possibilities of burning to the elements with and .
The nuclear ashes, left after bursts and superbursts or after steady-state thermonuclear burning in the outermost layers, sink in the neutron star crust under the weight of newly accreted matter. With increasing pressure, the sinking matter undergoes a sequence of nuclear transformations (particularly, pycnonuclear reactions), accompanied by heat deposition (the so called deep crustal heating in accreting neutron stars). Haensel & Zdunik (1990) (hereafter HZ90) studied these processes, starting from the 56Fe ashes (see Bisnovatyi-Kogan 2001, for references to some earlier work). Recently the case of ashes of much heavier elements has been considered by Haensel & Zdunik (2003) (hereafter HZ03), with special attention to 106Pd ashes. The initial mass number strongly affects the composition of accreted matter at densities , less strongly at higher , where pycnonuclear reactions operate, and moderately affects total crustal heat release (1.45 MeV and 1.12 MeV per accreted nucleon for for 106, respectively).
Thermal states of neutron stars in SXTs have been studied and compared with observations by a number of authors (e.g., Ushomirsky & Rutledge, 2001; Colpi et al., 2001; Rutledge et al., 2002b; Brown et al., 2002; Yakovlev et al., 2003).
Particularly, Yakovlev et al. (2003) used a simplified model of neutron-star thermal structure with the iron heat-blanketing envelope, and employed the relation between and from Potekhin et al. (1997) (hereafter PCY). However, even a small mass of non-burned accreted H or He on the surface ( depending on the surface temperature) noticeably increases the thermal conductivity of the envelope (Chabrier et al. 1997; PCY). On the contrary, the thermonuclear burning to high- elements (see above) decreases the thermal conductivity. In the present paper, we take into account both effects. First, we derive the relation between and for an envelope composed of a helium layer of arbitrary thickness and an underlying heavy-element crust, described either by HZ90 or by HZ03 model. Second, we use this relation for calculating the thermal states ( as a function of ) of accreting neutron stars for several neutron-star models with our fully relativistic code of neutron-star thermal evolution. We consider five model equations of state (EOSs) of matter in the neutron star cores for two compositions of this matter — nucleon matter and nucleon-hyperon matter. Finally, we compare the theoretical results with observations of several SXTs in quiescence. We make special emphasis on the hottest and coldest neutron stars, in Aql X-1 and SAX J1808.4–3658, respectively.
2 Thermal structure of heat-blanketing envelope
We calculate the thermal structure of a transiently accreting neutron star in a quiescent state using the same framework as for an isolated neutron star with an accreted envelope considered in PCY. A huge energy released in the surface layers during the active states of the system (heating of the surface by infall of accreted matter and by thermonuclear burning of this matter) is quickly carried to the surface by the thermal conduction and radiated away by the surface photon emission, especially after a quiescence onset. Thus, we solve numerically the thermal structure equation in the stationary plane-parallel approximation assuming no energy sources in the heat-blanketing envelope. In this way we calculate the temperature distribution in the blanketing envelope, with the thermal flux emergent from warm stellar interiors. The equation to be solved is
| (1) |
where is the temperature, is the pressure, is the surface gravity, and is the opacity. The gravity is determined by the total gravitational stellar mass and the circumferential stellar radius : , where km is the Schwarzschild radius. The total opacity is determined by the radiative (photon) opacity and the electron thermal opacity : . The effective temperature is defined by the Stefan law,
| (2) |
where is the Stefan–Boltzmann constant, and is the thermal surface luminosity in a local neutron-star reference frame. The apparent luminosity measured by a distant observer is , and the apparent surface temperature inferred by the observer from the radiation spectrum is (e.g., Thorne 1977).
We adopt the standard outer boundary condition to Eq. (1) by equating to the temperature at the stellar “radiative surface,” which is found from the equation . Shibanov et al. (1998) have checked that the replacement of this boundary condition by a more realistic condition, which involves a solution to the radiative transfer problem in the stellar atmosphere, has almost no effect on the temperature distribution within the blanketing envelope. We assume that the blanketing envelope extends to the density g cm-3 and we integrate Eq. (1) from the surface to . Thus, we define the internal neutron-star temperature as .
We assume further that the outermost neutron-star layer is composed of 4He, which may be left as a non-consumed fuel, or may accrete on the stellar surface after the last burst. Actually, the outermost layer may be partly composed of hydrogen: the replacement of He with H has very little effect on the thermal structure of the envelope (PCY). We measure the thickness of this light-element layer by the parameter
| (3) |
where is the total mass of He (and H), and cm2 s-1) ( ranges from to , for different neutron-star masses and EOSs; for a “canonical” neutron star of and km). The parameter is directly related to the pressure at the bottom of the light-element envelope (see, e.g., Ventura & Potekhin 2001, Eq. (8)): dyn cm-2. Brown et al. (2002) parameterized the thickness of the helium layer using the column density ; it is related to as
| (4) |
where cm. At , the helium layer reaches the density , where it efficiently transforms into heavier elements via pycnonuclear reactions and -captures (e.g., Müller & Langanke 1994). We do not consider higher values of .
Under the helium layer, the crust is composed of the burst ashes transformed under the action of beta captures, emission and absorption of neutrons and (at ) pycnonuclear reactions. We consider two model compositions of these layers of the crust: the traditional composition originating from the Fe nuclei (, HZ90) and the one originating from the Pd nuclei (, HZ03).
As in PCY, we employ the OPAL radiative opacity tables111http://www-phys.llnl.gov/V_Div/OPAL/opal.html (Iglesias & Rogers, 1996), interpolated or extrapolated whenever necessary. For the electron opacity (inversely proportional to the electron thermal conductivity), we use our code222http://www.ioffe.ru/astro/conduct/ based on the theory presented by Potekhin et al. (1999). In order to determine the density at a given pressure, we use the Saumon–Chabrier EOS for the outer helium layer (Saumon et al., 1995), and the EOS of ideal relativistic electron plasma in the deep layers of the envelope (using the fitting formulae of Chabrier & Potekhin 1998).
Note that our treatment of the thermal conductivity of He and Fe matter takes into account the effects of partial ionization, while the thermal conductivity of Pd matter (HZ03) is calculated assuming full ionization (because of the absence of appropriate ionization models). Our estimates show that the partial recombination of heavy ion plasma () occurs (very roughly) at g cm-3 and K (see Fig. 1 of PCY). If the main temperature gradient in the blanketing envelope takes place within the indicated domain, our results for the Pd/He envelope become inaccurate. We expect, however, that the thermal structure of such envelopes will not be too different from the structure of equivalent He/Fe envelopes (calculated with account for the partial ionization). Nevertheless, strictly speaking, our calculations fail for cold neutron stars ( K) with the HZ03 envelopes and small amount of He on the surface (). We have checked this assumption by constructing artificial models of He/Fe envelopes with fully ionized Fe. In a cold star with K and such a model gives the thermal surface luminosity about 2–3 times smaller than the accurate calculation. We will see (Sect. 3.5) that the effects of partial ionization are important for interpretation of observations.
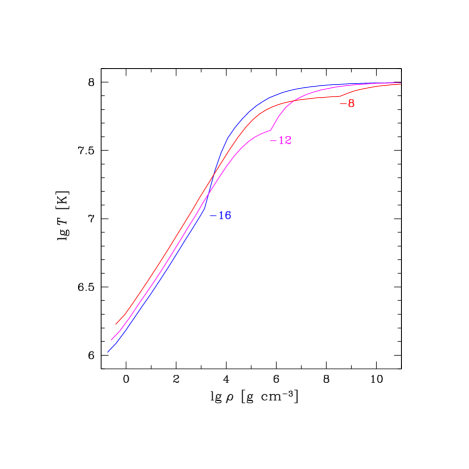
Taking each model of the heavy-element accreted envelope (HZ90 and HZ03), we have calculated for a representative sample of pairs of and values, in order to find the – relation. The calculated temperature profiles are exemplified in Fig. 1 (for , , and ). As explained in PCY, the light-element layer of the envelope (He in our case) provides a lower thermal insulation than the heavy-element one. This causes a sharper temperature drop from the inner isothermal layers to the light/heavy-element interface. The interface produces a cusp on each profile in Fig. 1. Outside the interface, the temperature gradient is smaller than just inside. Therefore, the thicker the He layer, the higher the effective temperature and the emitted radiation flux, for a given .
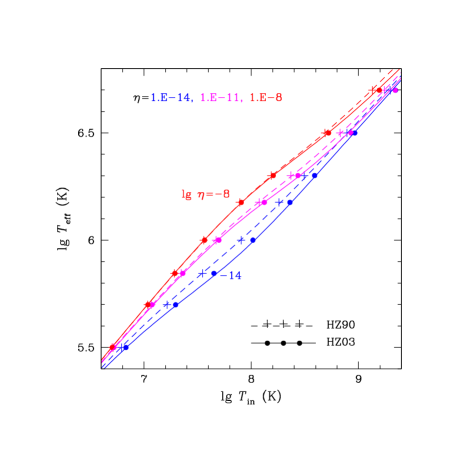
As expected, the – relation in the HZ90 case is almost the same as for a light-element accreted envelope on top of the Fe layer considered by PCY (with small corrections derived by Potekhin et al. 2003). The replacement of H by He has little effect on the – relation; the effect is completely negligible if exceeds the temperature of hydrogen thermonuclear burning ( K, Ergma 1986). However, the replacement of the HZ90 crust by the HZ03 crust noticeably affects the relation, as illustrated in Fig. 2. In this figure, the solid lines and filled circles show the dependence of on for the HZ03 accreted crust, while the crosses and dashed lines show this dependence for the HZ90 crust. The symbols demonstrate the results of numerical calculations, while the lines correspond to the following fitting expressions:
| (5a) | |||||
| (5b) | |||||
| (5c) | |||||
| (5d) | |||||
Here, K, K, and the parameters () are given in Table 1; and refer to in the absence of a helium layer and in the presence of most massive helium layer, respectively. If K K, the difference between the calculated and fitted values of does not exceed 4% for values used in the calculations: from 0 to for the HZ90 composition and from to for the HZ03 composition (although the interval of , where our physical model is applicable, is smaller, as explained above).
| HZ90 | HZ03 | |
|---|---|---|
| 2.87 | 2.67 | |
| 0.534 | 0.560 | |
| 2.203 | 2.596 | |
| 1.349 | 1.136 | |
| 8.328 | 9.838 | |
| 0.01609 | 0.00967 | |
| 0.1378 | 0.1590 |
3 Thermal states of transiently accreting neutron stars
3.1 Observations
We will calculate the quiescent thermal luminosity of neutron stars in SXTs versus the mean mass accretion rate (from to yr-1) and compare the results with observations. Let us outline the observations first.
We take the same observational basis as in Yakovlev et al. (2003). It consists of five SXTs whose quiescent thermal luminosity and mean mass accretion rate are measured or constrained (Fig. 3): Aql X-1 (Rutledge et al., 2000, 2002a), Cen X-4 (Chen et al., 1997; Rutledge et al., 2001), 4U 1608–52 (Chen et al., 1997; Rutledge et al., 1999), KS 1731–26 (Wijnands et al., 2002; Rutledge et al., 2002b), and SAX J1808.4–3658 (Bildsten & Chakrabarty, 2001; Campana et al., 2002). We adopt the same data (see Yakovlev et al. 2003 for details) but analyze more carefully the hottest and coldest sources, Aql X-1 and SAX J1808.4–3658. The data are rather uncertain and are plotted thus as thick crosses. The estimated values of for Cen X-1 and KS 1731–26 are likely to be the upper limits, as indicated by arrows.
Note that the quiescent luminosity of SXTs may vary from one observation to another. It is not clear if this variability is associated with the thermal radiation component or the non-thermal (power-law) one, not related to the radiation emergent from neutron star interiors. For instance, Rutledge et al. (2002a) report temporal variability of radiation from Aql X-1 over five months in quiescence after an outburst in November 2000. They fitted the thermal component of X-ray spectra with the hydrogen atmosphere model assuming a constant neutron-star radius. In the beginning of the quiescent period the thermal luminosity was estimated as erg s-1. It decreased to about erg s-1 in three months, increased to about erg s-1 in the next month, and stayed constant in the last month. In Fig. 3 the observational error box is centered at the minimum value, erg s-1, while the upper value of the errorbar approximately corresponds to the maximum value of . Recently, Campana & Stella (2003) have proposed another interpretation of the same data. They assume that the quiescent thermal luminosity stays constant while the temporal variability of the Aql X-1 radiation is associated with the variable nonthermal radiation component (which arises outside the neutron star, for instance, due to interaction of a pulsar wind with an accretion flow from the companion star). Their value of the quiescent thermal luminosity (redshifted for a distant observer) is in good agreement with the central value of the observational errorbar in Fig. 3.
We will also be interested in SAX J1808.4–3658. Campana et al. (2002) report its XMM-Newton observation in a quiescent state on March 24, 2001, when it was extremely weak. The spectrum of its emission was well fitted by power-law. It is most likely that the radiation originates in a neutron-star magnetosphere or in a surrounding accretion disk and is not related to the surface thermal emission. Thus, Campana et al. (2002) detected no thermal emission but obtained an upper limit on in that quiescent state. The limit depends on the model of the thermal radiation (black-body or hydrogen atmosphere model) and on assumed neutron-star parameters (mass, radius, distance) and varies from erg s-1 to erg s-1.
We consider two possible values (Figs. 3 and 6) of the upper limit on discussed by Campana et al. (2002). They seem to be more realistic than several other possible upper limits mentioned by these authors. The first value, erg s-1, is the upper limit on the unabsorbed bolometric thermal luminosity with the black-body (BB) spectrum. It is obtained from the 90% upper limit on the unabsorbed bolometric black-body flux of erg s-1 cm-2. To translate the flux to the luminosity we adopt the distance to the source, 2.5 kpc, cited by these authors. The second value, erg s-1, is the upper limit on the unabsorbed bolometric thermal luminosity obtained with the neutron-star hydrogen atmosphere (NSA) model.
As mentioned, e.g., by Campana et al. (2002) and Yakovlev et al. (2003), the quiescent thermal luminosity of SAX J1808.4–3658 is so low that the source should contain a very cold neutron star (with strong neutrino emission). Particularly, as shown by Yakovlev et al. (2003), the data are compatible only with the model of a massive neutron star whose core contains nucleons (and possibly hyperons) and does not contain any exotic matter (pion- or kaon condensates or quark matter, which would imply lower neutrino emission and a noticeably hotter star). This restricts the class of possible EOSs of dense matter to the models of nucleon/hyperon matter. We extend the analysis of Yakovlev et al. (2003) by simulating thermal states of neutron stars using an exact cooling code and several models of nucleon/hyperon EOSs.
3.2 Numerical simulations
Following Brown et al. (1998), we assume that neutron stars in SXTs are warmed up by deep crustal heating in accreted matter. It is supposed that the heat released at their surface in active states is radiated away, especially during quiescence, and does not warm the stellar interiors. Neutron stars in SXTs are thermally inertial objects, with typical relaxation times kyr (Colpi et al., 2001), while the mass accretion rate in SXTs varies on much shorter time scales. Therefore, we will study a global thermal state of a transiently accreting neutron star by replacing a variable deep crustal heating with the time-averaged heating determined by the time-averaged accretion rate . The deep-heating power is
| (6) |
where is the nucleon mass, and is the total amount of heat released per one accreted nucleon ( MeV and 1.12 MeV for the HZ90 and HZ03 models, respectively).
We simulate thermal states of accreting neutron stars with our fully relativistic code of neutron-star thermal evolution (Gnedin et al., 2001) by solving the stationary thermal-balance equation:
| (7) |
where is the neutrino luminosity of the star as detected by a distant observer, and is the deep heating power for the same observer (see, e.g., Yakovlev et al. 2003 for details). Since the mass accretion rates in SXTs are determined with large uncertainties, we do not make a difference between and in Eq. (7). The neutron star interior () is assumed isothermal (with the proper account of the general relativistic effects). In this case is a function of , while is related to (Sect. 2).
We have updated our code in three respects. First, we have incorporated the internal energy sources associated with deep crustal heating. Second, we have modified the relation between the surface and internal stellar temperatures in accordance with the results of Sect. 2. Third, we have included new microphysics (neutrino emissivities and heat capacities) which allows us to consider neutron-star cores containing , , , , , and hyperons (in addition to neutrons, protons, electrons, and muons).
3.3 Model equations of state of dense matter
We will use five model EOSs in neutron star cores. Three of them (EOSs N1, N2, and N3 listed in Table 2) refer to a nucleon dense matter (neutrons, protons, and electrons), while other two (EOSs NH1 and NH2 listed in Table 3) refer to a matter containing nucleons, electrons, muons and hyperons (of all types).
| Low-mass | Maximum-mass | ||||||
| EOS | |||||||
| (g cm-3) | () | (g cm-3) | (km) | () | (g cm-3) | (km) | |
| N1 | 1.1 | 13.20 | 1.977 | 10.75 | |||
| N2 | 1.1 | 12.18 | 1.73 | 9.71 | |||
| N3 | 1.1 | 11.31 | 1.46 | 8.91 |
| Maximum-mass | ||||||
|---|---|---|---|---|---|---|
| EOS | ||||||
| (g cm-3) | (g cm-3) | (g cm-3) | () | (g cm-3) | (km) | |
| NH1 | 1.975 | 11.41 | ||||
| NH2 | 1.740 | 9.089 |
EOSs N1, N2, and N3 are modifications of the phenomenological EOS proposed by Prakash et al. (1988). All of them allow the direct Urca process (Lattimer et al., 1991) to operate in a sufficiently dense neutron-star matter, . The threshold density is given in Table 2. We present also the parameters of the maximum-mass configurations (mass , central density , and radius ) and the parameters of low-mass neutron-star configurations (with as an example). EOS N1 implies model I of the symmetry energy and the compression modulus of saturated nuclear matter MeV. EOSs N2 and N3 imply, respectively, MeV and MeV, and the symmetry energy proposed by Page & Applegate (1992). EOS N1 is rather stiff: it yields . EOS N2 is softer, with smaller . The symmetry energy is overall smaller, which results in a lower proton fraction and higher direct Urca threshold. EOS N3 is an example of a quite different, soft EOS, with .
EOSs NH1 and NH2 in Table 3 refer to hyperon matter. The hyperons appear at sufficiently high densities; the density of the appearance of the first hyperon is denoted by . In the inner cores of massive hyperonic stars, a variety of direct Urca processes are open. They involve nucleons and hyperons, electrons and muons (Prakash et al., 1992) and give the major contribution to the neutrino luminosity of massive stars. In Table 3, means the threshold density for the first direct Urca process (hyperonic or nucleonic). However, if the density of hyperonic matter grows to essentially supranuclear values, the fraction of leptons (electrons and muons) becomes lower (they are replaced by and hyperons). Since the leptons are important participants of Urca processes, their reduced fraction may result in switching off these processes at high density. In Table 3, is the highest density of operation of the last direct Urca process.
EOS NH1 is given by the relativistic mean field model 3 of Glendenning (1985) and may be unrealistically stiff for hyperonic matter (). The first hyperon, , appears at , where nucleon direct Urca processes are already on (). The reduction of lepton fraction at high densities is not too strong. As a result, the direct Urca processes still operate at the center of the maximum-mass star.
EOS NH2 is EOS2 N of Balberg et al. (1999). It is softer: . The first hyperon, , appears at the density which is only slightly lower than . The first direct Urca process, which opens with increasing , involves hyperons. A very strong reduction of lepton fraction at high densities switches off all direct Urca processes at nearly the same density in central kernels of massive stars.
3.4 Limiting models
Realistic models of neutron stars should take into account possible superfluidity of baryons (nucleons and hyperons) in stellar interiors (e.g., Lombardo & Schulze, 2001; Balberg et al., 1999). Microscopic calculations give a large scatter of critical temperatures of baryon pairing, depending on a baryon-baryon interaction model and many-body theory employed. All these calculations indicate that superfluidity should disappear in essentially supranuclear matter (in the centers of massive neutron stars).
The theory predicts the existence of three types of transiently accreting neutron stars with different thermal structure (e.g., Yakovlev et al. 2003): low-mass, medium-mass, and high-mass stars. Low-mass stars have so low central densities that the direct Urca processes are not operative, being either strictly forbidden () or totally suppressed by a superfluidity (which may be strong at not too high densities). Accordingly, these stars have a low neutrino luminosity and are hottest, for a given mass accretion rate. The central densities of high-mass neutron stars are noticeably higher than and the density, where the superfluidity dies out and ceases to suppress the direct Urca process. These stars possess inner cores with fully open direct Urca processes and greatly enhanced neutrino luminosity. Hence, the massive stars are coldest, for a given accretion rate. Medium-mass stars are intermediate between the low-mass and high-mass ones.
Thus, the highest heating curves (Fig. 3) correspond to low-mass stars, and the lowest curves to high-mass stars. Increasing the stellar mass from the lowest to the highest values, one obtains a family of heating curves of medium-mass stars which fill in space between the highest and lowest curves. Any observational point between the lowest and highest heating curves can be explained by employed neutron-star models.
Since the problem involves many parameters, we restrict ourselves to the limiting cases. They give the highest or lowest heating curves and constrain thus theoretical values of . The limiting low-mass and high-mass neutron-star configurations seem to be more robust with respect to physics input (EOS and superfluid properties of stellar cores) than the medium-mass configurations. This has been proven for cooling isolated neutron stars (e.g., Kaminker et al. 2002) and has to be true for transiently accreting neutron stars with deep crustal heating because of the direct correspondence of cooling and heating problems (Yakovlev et al., 2003). Specifically, we employ limiting values of three parameters listed in Table 4.
| Limiting parameter | Limit 1 | Limit 2 |
|---|---|---|
| Mass | (low-mass star) | (high-mass star) |
| Accreted crust model | HZ90 | HZ03 |
| Mass of He layer, | 0 |
The first parameter is the stellar mass; the limiting values refer to low-mass and high-mass neutron stars. For representative low-mass models, we take the ones with and nucleon cores (Table 2). We assume further the strong proton superfluidity in the cores of low-mass stars, with the critical temperature of proton pairing equal to K. This superfluidity totally suppresses the modified Urca process, so that the neutrino luminosity of the star is determined by neutron-neutron bremsstrahlung process (just as for cooling neutron stars; e.g., Kaminker et al. 2002). Actually, our models of low-mass stars are fairly insensitive to a specific model of the proton superfluidity as long as the superfluidity is sufficiently strong to suppress the modified Urca process.
Recently the neutrino emission in neutron-neutron bremsstrahlung has been reconsidered by van Dalen et al. (2003). The authors use several realistic models of neutron-neutron interaction and conclude that the emissivity of the process is about four times lower than in the simplified one-pion exchange (OPE) model. Our code incorporates the results of Friman & Maxwell (1979) obtained using the OPE model with phenomenological correction factors. We have checked that the emissivity provided by the code agrees with the improved results of van Dalen et al. (2003), i.e., it is already reduced by a factor of with regard to the OPE model of van Dalen et al. (2003).
Furthermore, we assume a weak triplet-state neutron pairing in neutron-star cores, with maximum critical temperature K. This pairing has actually no effect on thermal states of neutron stars and can be ignored. A stronger neutron pairing would produce a powerful neutrino emission and fast cooling of isolated neutron stars (e.g., Kaminker et al., 2002; Yakovlev et al., 2003b), in sharp disagreement with observations of these objects. For simplicity, we neglect the effects associated with singlet-state neutron pairing in neutron-star crusts (e.g., Yakovlev et al. 2001; Potekhin et al. 2003). To represent the high-mass stars, we use the maximum-mass configurations (Tables 2 and 3). The effects of superfluidity are expected to be minor in such a star, and we neglect them in our calculations.
The second and third parameters in Table 4 test the composition of accreted envelopes. The second parameter specifies the composition of deep accreted crust; we consider two limiting cases, the HZ90 or HZ03 crusts (Sects. 1 and 2). The third parameter is the relative mass of the surface helium layer (Sect. 2). Our two limiting cases are: (no He layer) and (most massive He layer). We will see that the effect of the helium layer on saturates with increasing , owing to which the limit of most massive envelope is actually achieved at .
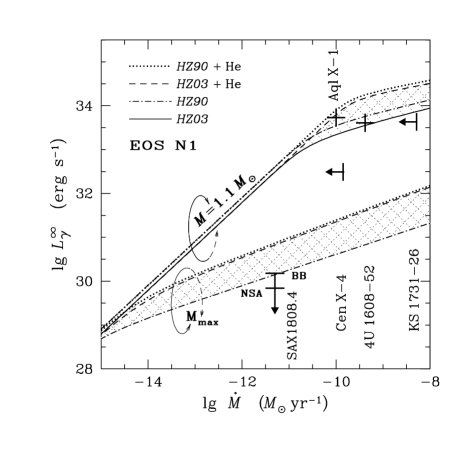
3.5 Overall results (EOS N1)
We start with the overall analysis, taking EOS N1 in the stellar cores as an example. The effects of different EOSs will be analyzed in Sects. 3.6 and 3.7. Theoretical models are compared with the observations (Sect. 3.1) in Fig. 3. Four upper heating curves refer to a low-mass neutron star, while three lower curves refer to a high-mass one. The solid and dashed curves are for the HZ03 crust, while the dash-and-dot and dotted curves are for the HZ90 crust. The solid and dashed-and-dot curves are calculated assuming no He on the surface, while the dashed and dotted curves are for the massive He layer. We do not present the solid curve (the HZ03 crust with the Pd composition extended to the surface) for the maximum-mass star. In this star, the effects of partial ionization of Pd plasma would be very important but they are neglected in our analysis. We expect, however, that this curve is not too different from the dash-and-dot one (see below).
Our calculations confirm the main results of the previous studies (e.g., Yakovlev et al. 2003): one can explain the data, assuming that neutron star cores are composed of nucleons; Aql X-1 and 4U 1806–52 may be treated as SXTs containing low-mass neutron stars; Cen X-4 and KS 1731–26 may be treated as SXTs containing medium-mass neutron stars; SAX J1808.4–3658 seems to be a source with a high-mass star; all these neutron stars cool mainly via neutrino emission from their cores (their photon thermal luminosity is much weaker than the neutrino one) except possibly Aql X-1, whose regime is intermediate between the neutrino and photon cooling. In the neutrino regime, Eq. (7) reduces to , which yields the internal temperature , while the surface thermal emission is adjusted to this (see Yakovlev et al. 2003 for details).
Our present results enable us to extend the consideration of Yakovlev et al. (2003). Since we are mainly interested in the neutrino cooling regime, the internal temperatures of neutron stars of a given mass and accretion rate are determined by neutrino emission and deep crustal heating model (HZ90 or HZ03) and do not depend on the presence of He on the surface. On the other hand, the relation is actually the same for the HZ90 and HZ03 scenarios, if massive layers of light elements are present. A small difference between the dashed and dotted curves is solely determined by different amount of heat released in the HZ90 and HZ03 crusts, see Eq. (6). The heat released in the HZ90 crust is slightly larger, so that the dotted curves are slightly higher than their dashed counterparts. A larger difference between the HZ90 and HZ03 crusts without a light-element layer is mainly determined by different thermal insulations of heat-blanketing envelopes (Sect. 2). The high- (HZ03) heat blanketing envelope is less heat transparent. Hence, the surface temperature is smaller and the solid curve is lower than its dot-and-dashed counterpart. Still larger difference occurs between the scenarios with and without helium layers. A massive helium layer is much more heat transparent than the layer of HZ90- or HZ03-matter. Accordingly, the dotted and dashed heating curves go noticeably higher than the associated dash-and-dot and solid curves.
As seen from Fig. 3, the presence of light elements on the surface of Aql X-1 simplifies theoretical treatment of Aql X-1 as an SXT containing a low-mass neutron star. The spectrum of the object is well described by hydrogen atmosphere models, which is in line with the assumption that the neutron star has the surface layer of light elements. The effects of different EOSs for the interpretation of this source are discussed in Sect. 3.6. The neutron star in 4U 1608–52 may be treated either as a low-mass neutron star without a massive light-element layer, or as a medium-mass neutron star with such a layer.
The interpretation of SAX J1808.4–3658 is of special interest. EOS N1 adopted in Fig. 3 is consistent only with the black-body thermal emission (with no massive He layer on the stellar surface) and disagrees with a neutron-star-atmosphere spectrum. Although the upper limits of inferred with the black-body and neutron star atmosphere models seem to be not very certain, our results indicate that the neutron star in SAX J1808.4–3658 is so cold that it is barely explained by the theory. In Sect. 3.7 we will show that the theoretical explanation is relaxed if the neutron star contains a hyperonic core. In any case, the star should have no massive layer of light elements on the surface.
The limiting cases of no He layer and massive He layer deserve special comments. The mass of the light-element layer may vary from one quiescent stage to another or even during one quiescent stage due to residual accretion. Therefore, the heating curves for a massive He layer and without it represent the upper and lower limits of the quiescent thermal luminosity of the same star (Brown et al., 2002).
Figure 4 shows the surface thermal luminosity of neutron stars with the HZ90 and HZ03 crusts versus the mass of the helium layer. The upper curves refer to the low-mass star with the mean accretion rate of Aql X-1. The lower curves correspond to the high-mass star with the mean accretion rate of SAX J1808.4–3658. The growth of with increasing saturates, so that the limit of very massive He layer is actually achieved at .

Since the neutron star in Aql X-1 is hot, the main temperature gradient occurs in deep layers of its heat-blanketing envelope. One needs at least of helium to affect the thermal structure, and of helium (extending to g cm-3) to achieve the limit of the most massive He layer. The increase of enhances the thermal luminosity by a factor of 2.5–3, in agreement with the results by Brown et al. (2002). It is instructive to note that the mass of the neutron-star atmosphere in Aql X-1 at the optical depth would be , while at it would be . Therefore, the spectrum of thermal radiation formed in the stellar atmosphere is affected by a much smaller amount of light elements than the thermal structure of the neutron star envelope. Note also that the plasma remains almost fully ionized in all surface layers of this hot neutron star.
The situation with SAX J1808.4–3658 is different. The neutron star is much colder, and the main temperature gradient shifts to the surface. Variations of with increasing reach one order of magnitude. Even of He (comparable with the mass of the atmosphere at , less than 1 cm under the surface) affects the surface thermal luminosity, while the limit of the most massive envelope is nearly achieved at . At these heavy elements are partially ionized. As explained in Sect. 2, we have taken into account the partial ionization of Fe but not Pd. Assuming artificially full ionization of Fe or Pd, we obtain the dotted curves in Fig. 4 (the dotted curve for the Pd/He crust at is plotted from direct calculation rather than from the fit expressions, Eqs. (5)). This approximation is seen to be rather inaccurate for the Fe/He envelope at , and is expected to be even more inaccurate at these for the Pd/He envelope. In this respect, cold neutron stars (particularly, SAX J1808.4–3658) can serve as laboratories for studying ionization equilibrium of dense matter, a complicated theoretical problem whose solution is model dependent.
3.6 Low-mass neutron stars: Aql X-1
The curves in Figs. 3 and 4 are calculated for one model EOS in a neutron star core. The calculations with all five EOSs listed in Tables 2 and 3 reveal that the heating curves of low-mass and high-mass neutron stars are not too sensitive to these EOSs. The heating curves of medium-mass stars do depend on the EOS (just as for isolated cooling neutron stars, e.g., Kaminker et al. 2002) which will be studied in the next publication. Here, we restrict ourselves to the limiting low-mass and high-mass models.
Let us start with the low-mass stars. Figure 5 shows the heating curves of neutron stars with the cores described by EOSs N1, N2, and N3 and the envelopes composed of either the HZ90 or HZ03 matter, without and with He layers. The left panel displays our traditional heating curves, , while the right panel gives for the same scenarios.
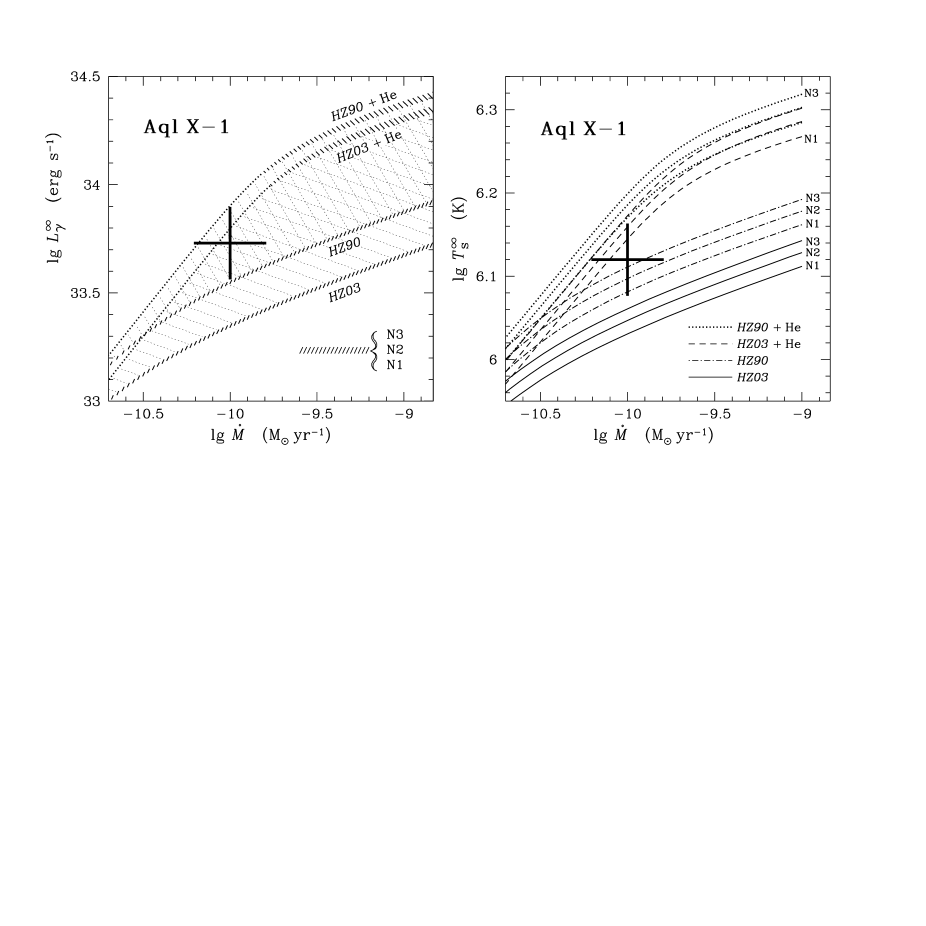
The left and right panels of Fig. 5 are seen to be different. If we fix a model of accreted crust and the value of , the heating curves are almost universal – insensitive to the EOS in the stellar core. We plot them by wide hatched lines in the left panel: the curves for different EOSs would be almost indistinguishable. In addition, we have calculated the heating curves for a neutron star with EOS N1 (not presented in Fig. 5) and check that they are also indistinguishable from corresponding curves. On the other hand, the heating curves noticeably depend on the EOS: the luminosity is the same, but stellar radii are different (Table 2), hence different . Notice that the theory of cooling isolated neutron stars predicts just the opposite property of the cooling curves ( or versus stellar age ): the cooling curves of low-mass neutron stars are almost universal (e.g., Kaminker et al. 2002), whereas the curves should noticeably depend on the EOS.
The upper heating curves in Fig. 5 correspond to the stars with massive light-element layers, while the lower curves are calculated assuming no such layers. The difference between the lower and upper curves is quite pronounced. As seen from Fig. 5, observations of Aql X-1 with simultaneous stringent determinations of and have potential to constrain the EOS in the core of low-mass neutron stars and to determine the composition of the surface layers. On the other hand, the neutron star is so hot that it is nearly at the edge of theoretical ability to explain hot stars. Were the quiescent thermal luminosity erg s-1 detected in future observations of Aql X-1, it could not be explained by deep crustal heating. This may be regarded as an additional test of the deep crustal heating mechanism.
3.7 The coldest massive neutron star: SAX J1808.4–3658
Let us turn to the high-mass neutron-star models. Figure 6 displays the heating curves of maximum-mass neutron stars with five EOSs in their cores, the HZ90 or HZ03 composition of the crust, with or without helium surface layers. If we fix the composition of the crust and the helium mass, then the difference between the thermal luminosities of neutron stars with four EOSs in the core (nucleon EOSs N1, N2, and N3, and hyperon EOS NH2) is small. Thus, just as for low-mass neutron stars (Sect. 3.6), the heating curves are nearly universal (while the curves would be much more different).
Employing the four EOSs (N1, N2, N3, and NH2), we come to the same conclusions as in Sect. 3.5: the theory is consistent with the upper limit of inferred using the blackbody model (without any light-element layer on the surface), and it is inconsistent with the limit of inferred with the neutron-star atmosphere model. The appearance of a helium layer can raise the quiescent thermal luminosity up to an order of magnitude.

Nevertheless, the stars with the hyperon EOS NH1 disobey the universality: they are noticeably colder. Their coldness is explained by very strong neutrino emission from from the hyperonic stellar core. As discussed in Sect. 3.3, the fraction of leptons in the central region of the maximum-mass neutron star with EOS NH1 is sufficient to keep all direct Urca processes open everywhere within the inner core, including the stellar center. The neutrino emission becomes exceptionally intense, and the star very cold. Such a cold high-mass hyperonic star without a massive helium surface layer is in much better agreement with the observations of SAX J1808.4–3658. As seen from Fig. 6, in this case the theory is not only consistent with the upper blackbody limit on , but becomes in reasonable agreement with the upper limit inferred using the atmosphere model (which is not the case for other EOSs). This opens a potential possibility to discriminate between the different nucleon/hyperon EOSs and gives a tentative indication that the neutron star in SAX J1808.4–3658 contains a hyperonic core with a not too low lepton fraction.
As discussed in Sect. 3.3, the lepton fraction for EOS NH2 decreases very rapidly with increasing density. This switches off all direct Urca processes at , in the central kernel of the maximum-mass neutron star, reducing thus the neutrino emission to the level of neutron stars with nucleon cores.
Thus, further observations of SAX J1808.4–3658 in quiescent are highly desirable. Future detections or constraints of the quiescent thermal luminosity would be most important, especially those which give lower values of than the present ones. For instance the value of erg s-1 would definitely imply a massive hyperon neutron star with not too small fraction of leptons in its center (to keep the direct Urca processes open) and without any massive surface layer of light elements. Lower values of could not be explained by the current model.
4 Conclusions
We have considered (Sect. 2) the growth of temperature within the heat-blanketing envelope of a transiently accreting neutron star in a quiescent state. We have analyzed two basic models HZ90 and HZ03 of the accreted crust, calculated by Haensel & Zdunik (1990, 2003). In all cases we consider the possible presence of a thin () layer of light elements (H or He) on the surface. We have calculated the relations between the internal and surface temperatures of neutron stars with the HZ90 or HZ03 crusts and fitted the results by simple expressions.
Using these results, we have modeled (Sect. 3) thermal states of transiently accreting neutron stars in SXTs, assuming that these states are regulated by deep crustal heating in accreted matter. We have considered five model EOSs of nucleon or nucleon-hyperon matter in neutron star cores, representative models of low-mass and high-mass neutron stars, HZ90 and HZ03 models of stellar crusts, without light elements on the stellar surfaces or with maximum amount of light elements. The results give the upper and lower limits of the quiescent thermal luminosity of SXTs, depending on the amount of light elements at the neutron-star surface in a particular quiescent period.
We have compared the theory with observations of five SXTs. The most important are two sources, Aql X-1 and SAX J1808.4–3658. Aql X-1 can be treated as a low-mass, warm neutron star. Its future observations may constrain the EOS in the nucleon core of a low-mass neutron star, elucidate the composition of accreted matter, and test the deep crustal heating hypothesis. The second source, SAX J1808.4–3658, can be treated as a very cold massive neutron star with nucleon or nucleon-hyperon core; a hyperonic core with not too low fraction of electrons is more preferable. Future observations of SAX J1808.4–3658 in quiescence may enable one to distinguish between the EOSs in massive nucleon/hyperon stellar cores and check the ionization models of heavy-element plasma in surface layers of neutron stars.
The assumption that the quiescent thermal emission of SXTs is produced by the deep crustal heating (Brown et al., 1998) remains still a hypothesis. However, the theory of deep crustal heating (Haensel & Zdunik, 1990, 2003) is solid: accreting neutron stars should be heated from inside and this effect cannot be avoided.
Acknowledgements.
We are grateful to R. V. E. Lovelace for careful reading the manuscript and useful remarks. This work was supported in part by the RFBR (grants No. 02-02-17668 and 03-07-90200).References
- Balberg et al. (1999) Balberg, S., Lichtenstadt, I., & Cook, G. B. 1999, ApJS, 121, 515
- Bildsten & Chakrabarty (2001) Bildsten, L., & Chakrabarty, D. 2001, ApJ, 557, 292
- Bisnovatyi-Kogan (2001) Bisnovatyi-Kogan, G. S. 2001, Stellar Physics, vol. 1 (Springer, Berlin)
- Brown et al. (1998) Brown, E. F., Bildsten, L., & Rutledge, R. 1998, ApJ, 504, L95
- Brown et al. (2002) Brown, E. F., Bildsten, L., & Chang, P. 2002, ApJ, 574, 920
- Campana & Stella (2003) Campana, S., & Stella, L. 2003, ApJ (in press) [astro-ph/0307218]
- Campana et al. (2002) Campana, S., Stella, L., Gastaldello, F., Mereghetti, S., Colpi, M., Israel, G. L., Burderi, L., Di Salvo, T., & Robba, R. N. 2002, ApJ, 575, L15
- Chabrier & Potekhin (1998) Chabrier, G., & Potekhin, A. Y. 1998, Phys. Rev. E, 58, 4941
- Chen et al. (1997) Chen, W., Shrader, C. R., & Livio, M. 1997, ApJ, 491, 312
- Colpi et al. (2001) Colpi, M., Geppert, U., Page, D., & Possenti, A. 2001, ApJ, 548, L175
- Chabrier et al. (1997) Chabrier, G., Potekhin, A. Y., & Yakovlev, D. G. 1997, ApJ, 477, L99
- Ergma (1986) Ergma E., 1986, Sov. Sci. Rev. E: Astrophys. Space Phys., 5, 181
- Friman & Maxwell (1979) Friman. B. L., & Maxwell, O. V. 1979, ApJ, 232, 541
- Glendenning (1985) Glendenning, N. K. 1985, ApJ, 293, 470
- Gnedin et al. (2001) Gnedin, O. Y., Yakovlev, D. G., & Potekhin, A. Y. 2001, MNRAS, 324, 725
- Haensel & Zdunik (1990) Haensel, P. & Zdunik, J. L. 1990, A&A, 229, 117
- Haensel & Zdunik (2003) Haensel, P. & Zdunik, J. L. 2003, A&A, 404, L33
- Iglesias & Rogers (1996) Iglesias, C. A., & Rogers, F. J. 1996, ApJ, 464, 943
- Kaminker et al. (2002) Kaminker, A. D., Yakovlev, D. G., & Gnedin, O. Y. 2002, A&A, 383, 1076
- Lattimer et al. (1991) Lattimer, J. M., Pethick, C. J., Prakash, M., & Haensel, P. 1991, Phys. Rev. Lett., 66, 2701
- Lombardo & Schulze (2001) Lombardo, U., & Schulze, H.-J. 2001, in Physics of Neutron Star Interiors, eds. D. Blaschke, N. Glendenning, & A. Sedrakian, Lecture Notes in Physics, 578, 30
- Müller & Langanke (1994) Müller, H.-M., & Langanke, K. 1994, Phys. Rev. C, 49, 524
- Page & Applegate (1992) Page, D., & Applegate, J. H. 1992, ApJ, 394, L17
- Potekhin et al. (1997) Potekhin, A. Y., Chabrier, G., & Yakovlev, D. G. 1997, A&A, 323, 415 (PCY)
- Potekhin et al. (1999) Potekhin, A. Y., Baiko, D. A., Haensel, P., & Yakovlev, D. G. 1999, A&A, 346, 345
- Potekhin et al. (2003) Potekhin, A. Y., Yakovlev, D. G., Chabrier, G., & Gnedin O.Y. 2003, ApJ, 594, 404
- Prakash et al. (1988) Prakash, M., Ainsworth, T. L., & Lattimer, J. M. 1988, Phys. Rev. Lett., 61, 2518
- Prakash et al. (1992) Prakash, M., Prakash, M., Lattimer, J. M., Pethick, C. J. 1992, ApJ, 390, L77
- Rutledge et al. (1999) Rutledge, R. E., Bildsten, L., Brown, E. F., Pavlov, G. G., & Zavlin, V. E. 1999, ApJ, 514, 945
- Rutledge et al. (2000) Rutledge, R. E., Bildsten, L., Brown, E. F., Pavlov, G. G., & Zavlin, V. E. 2000, ApJ, 529, 985
- Rutledge et al. (2001) Rutledge, R. E., Bildsten, L., Brown, E. F., Pavlov, G. G., & Zavlin, V. E. 2001, ApJ, 551, 921
- Rutledge et al. (2002a) Rutledge, R. E., Bildsten, L., Brown, E. F., Pavlov, G. G., & Zavlin, V. E. 2002a, ApJ, 577, 346
- Rutledge et al. (2002b) Rutledge, R. E., Bildsten, L., Brown, E. F., Pavlov, G. G., & Zavlin, V. E., Ushomirsky, G., 2002b, ApJ, 580, 413
- Saumon et al. (1995) Saumon, D., Chabrier, G., & Van Horn, H. M. 1995, ApJS, 99, 713
- Schatz et al. (2001) Schatz, H., Aprahamian, A., Barnard, V., Bildsten, L., Cumming, A., Quellette, M., Rauscher, T., Thielemann, F.-K., & Wiescher, M. 2001, Phys. Rev. Lett., 86, 3471
- Schatz et al. (2003) Schatz, H., Bildsten, L., & Cumming, A. 2003, ApJ, 583, 87
- Shibanov et al. (1998) Shibanov, Yu. A., Potekhin, A. Y., Yakovlev, D. G., & Zavlin, V. E. 1998, in The Many Faces of Neutron Stars, edited by R. Buccheri, J. van Paradijs, and M. A. Alpar (Kluwer, Dordrecht), 553
- Thorne (1977) Thorne K.S., 1977, ApJ 212, 825
- Ushomirsky & Rutledge (2001) Ushomirsky, G., & Rutledge, R. E. 2001, MNRAS, 325, 1157
- van Dalen et al. (2003) van Dalen, E. N. E., Dieperink, A. E. L., & Tjon, J. A., 2003, Phys. Rev. C, 67, 065807
- Ventura & Potekhin (2001) Ventura, J., & Potekhin, A. Y. 2001, in NATO Science Ser. C, 567, The Neutron Star – Black Hole Connection, ed. C. Kouveliotou, J. Ventura, & E. P. J. van den Heuvel (Dordrecht: Kluwer), 393
- Wijnands et al. (2002) Wijnands, R., Guainazzi, M., van der Klis, M., Méndez, M. 2002, ApJ, 573, L45
- Woosley et al. (2003) Woosley, S. E., Heger, A., Cumming, A., Hoffman, R. D., Pruet, J., Rauscher, T., Schatz, H., Brown, B. A., & Wiescher, M. 2003, ApJ (submitted) [astro-ph/0307425]
- Yakovlev et al. (2001) Yakovlev, D.G., Kaminker, A.D., & Gnedin O.Y. 2001 A&A, 379, L5
- Yakovlev et al. (2003) Yakovlev, D. G., Levenfish, K. P., & Haensel, P. 2003, A&A, 407, 265
- Yakovlev et al. (2003b) Yakovlev, D.G., Gnedin, O.Y., Kaminker, A.D., Levenfish, K.P., & Potekhin A.Y. 2003, Adv. Sp. Res. (in press) [astro-ph/0306143].