The eclipsing massive X-ray binary M33 X7: New X-ray observations and optical identification††thanks: This work is based on observations obtained with XMM-Newton, an ESA Science Mission with instruments and contributions directly funded by ESA Member States and the USA (NASA).
The eclipsing X-ray binary M33 X$-$7 was in the field of view during several observations of our XMM-Newton M33 survey and in the archival Chandra observation 1730 which cover a large part of the 3.45 d orbital period. We detect emission of M33 X$-$7 during eclipse and a soft X-ray spectrum of the source out of eclipse that can best be described by bremsstrahlung or disk blackbody models. No significant regular pulsations of the source in the range 0.25–1000 s were found. The average source luminosity out of eclipse is 5 erg s-1 (0.5–4.5 keV). In a special analysis of DIRECT observations we identify as optical counterpart a B0I to O7I star of 18.89 mag in V which shows the ellipsoidal heating light curve of a high mass X-ray binary with the M33 X$-$7 binary period. The location of the X-ray eclipse and the optical minima allow us to determine an improved binary period and ephemeris of mid-eclipse as HJD . The mass of the compact object derived from orbital parameters and the optical companion mass, the lack of pulsations, and the X-ray spectrum of M33 X$-$7 may indicate that the compact object in the system is a black hole. M33 X$-$7 would be the first detected eclipsing high mass black hole X-ray binary.
Key Words.:
Galaxies: individual: M33 - X-rays: individuals: M33 X$-$7 - X-rays: binaries - binaries: eclipsing1 Introduction
M33 X$-$7 (hereafter X7) was detected as a variable source with a luminosity brighter than erg s-1 in Einstein observations (Long et al. 1981; Markert & Rallis 1983; Trinchieri et al. 1988a, b). Peres et al. (1989) suggested that the X7 variability pattern can be explained by an eclipsing X-ray binary (XRB) with an orbital period of 1.7 d and an eclipse duration of d. This finding was the first identification of a close accreting binary system with an X-ray source in an external galaxy other than the Magellanic Clouds. It was confirmed combining Einstein observatory and first ROSAT data (Schulman et al. 1993, 1994). With the inclusion of more ROSAT and ASCA data (Larson & Schulman 1997; Dubus et al. 1999, hereafter D99) the orbital period turned out to be twice as long. The shape of the eclipse could be described by a slow ingress (), an eclipse duration of , and a fast eclipse egress () with an ephemeris for the mid-eclipse time of HJD 244 8631.50.1 + N(3.45350.0005). In addition, D99 discovered evidence for a 0.31 s pulse period. The orbital period, pulse period and observed X-ray luminosity are remarkably similar to those of the Small Magellanic Cloud neutron star XRB SMC X$-$1 (Liu et al. 2000). However, if the pulse period of X7 can not be confirmed, the source could also resemble high mass black hole XRBs (BHXB) like LMC X$-$1 or LMC X$-$3. It would be the first eclipsing object within this rare class of XRBs.
The position of X7 correlates with the dense O–B association HS13 (Humphreys & Sandage 1980) and therefore no individual counterpart could be identified based on position only. However, its location in HS13 is consistent with the expectation of a massive companion. As D99 point out, the optical counterpart is likely to show ellipsoidal and/or X-ray heating variations (Tjemkes et al. 1986) which can be used for the optical identification.
Variable optical sources within M33 were systematically searched for in the DIRECT project (see e.g. Mochejska et al. 2001b, hereafter M01b). Many eclipsing binaries, Cepheids, and other periodic, possibly long-period or nonperiodic variables were detected. X7 is located in DIRECT field M33B. The variability of the optical counterpart was not detected in the previous analysis due to the limitations of the variable search strategy for such small amplitude variables in crowded regions.
As a follow-up of our study of the X-ray source population of M33 based on all archival ROSAT observations (Haberl & Pietsch 2001, hereafter HP01), we planned a deep XMM-Newton raster survey of M33 based on 22 Telescope Scientist guaranteed time (proposal no 010264) and AO2 (proposal no 014198) observations, each with a duration of about 10 ks (for first results see Pietsch et al. 2003). X7 was covered in 13 of these observations at varying off-axis angles and covering different orbital phases.
In this paper we report on time and spectral variability of X7 within the XMM-Newton raster survey. We add results from an archival Chandra observation, which covered the source, and a dedicated timing analysis of the DIRECT data of the HS13 region.
2 X-ray observations and results
| Obs. id. | Obs. dates | Elapse time | Count rate∗∗ | HR | Offax | Binary phase | ||
|---|---|---|---|---|---|---|---|---|
| (ks) | (″) | (ct ks-1) | ( erg s-1) | (′) | ||||
| (1) | (2) | (3) | (4) | (5) | (6) | (7) | (8) | (9) |
| 0102641201 | 2000-08-02 | 13.1 | 30.0 | 8.7 | 10.4 | 0.54–0.58 | ||
| 0102640401 | 2000-08-02 | 13.1 | 40.0 | 8.5 | 10.4 | 0.61–0.66 | ||
| 0102640101 | 2000-08-04 | 13.3 | 22.5 | 0.2 | 8.3 | 0.11–0.16 | ||
| 0102640501 | 2001-07-05 | 11.8 | 45.0 | 8.3 | 7.1 | 0.33–0.36 | ||
| 0102640601 | 2001-07-05 | 35.0 | 6.0 | 15.7 | 0.23–0.26 | |||
| 0102640701 | 2001-07-05 | 11.7 | 35.0 | 7.8 | 9.3 | 0.28–0.31 | ||
| 0102541101 | 2001-07-08 | 12.5 | 30.0 | 0.3 | 11.1 | 0.01–0.05 | ||
| 0102642101 | 2002-01-25 | 35.0 | 8.5 | 13.1 | 0.25–0.29 | |||
| 0102642301 | 2002-01-27 | 12.3 | 35.0 | 7.0 | 0.9 | 0.81–0.85 | ||
| 0141980501 | 2003-01-22 | 8.1 | 35.0 | 9.0 | 8.3 | 0.18–0.21 | ||
| 0141980601 | 2003-01-23 | 13.6 | 37.5 | 7.3 | 10.4 | 0.46–0.50 | ||
| 0141980701 | 2003-01-24 | 13.7 | 35.0 | 7.3 | 10.4 | 0.52–0.56 | ||
| 0141980801 | 2003-02-12 | 10.2 | 35.0 | 8.6 | 8.3 | 0.20–0.23 | ||
| 1730 | 2000-12-07 | 52.0 | 15.0 | 6.3 | 8.6 | 0.49–0.65 |
Notes and references:
: M33 X$-$7 only in PN field of view.
: M33 X$-$7 only in MOS field of view, integrated MOS count rate, hardness
ratio and luminosity given.
: The on average higher HR during
observations 0102641201 and 0102640401 compared to the other observations
reflects the difference between
thick and medium filter and most likely not a change of the spectrum of M33 X$-$7.
∗∗: raw count rate and luminosity in the 0.5–4.5 keV band assuming the
best fitting thermal bremsstrahlung spectrum (see Table 3) corrected for a Galactic
foreground absorption of = 6.38 cm-2 (Dickey & Lockman 1990)
and a distance of M33 of
795 kpc (van den Bergh 1991), which we use throughout the paper.
For the detailed analysis of X7 we mostly used data from XMM-Newton EPIC. From the M33 observations in the Chandra archive only the observation with identification no 1730 covered the X7 field. Table 1 summarizes the observation identifications (Col. 1), observation dates (2), elapse time (3), extraction radius used for count rates, light curves, and spectra (4), X7 raw count rates in the 0.5–4.5 keV band (5), hardness ratios (6), and luminosities in the 0.5–4.5 keV band (7). For the XMM-Newton observations, values in columns 4 to 7 correspond to the EPIC PN detector if not indicated differently, since it gives about twice the number of photons than the EPIC MOS cameras. Off axis angle of X7 (8) and phase coverage within the binary orbit according to the ephemeris of D99 (9) are also given. As hardness ratio (HR) we use the ratio of the counts in the 1.2–3.0 keV band to the counts in the 0.5–1.2 keV band. Luminosities were determined from thermal bremsstrahlung spectra (see Sect. 2.3). During observations 0102640101 and 0102641101 X7 was in low state and source statistics did not allow us to derive hardness ratios. For these observations we assumed that the source spectrum was similar to the spectrum during observation 0102642301 and scaled the source luminosity from the vignetting corrected count rates.
In the XMM-Newton observations (Jansen et al. 2001) the EPIC PN and MOS instruments (Strüder et al. 2001; Turner et al. 2001) were mostly operated in the full frame mode resulting in a time resolution of 73.4 ms and 2.6 s, respectively. Only for the first two observations in Table 1, the PN detector was operated in the extended full frame mode (time resolution 200 ms) and during observation 0102640101 the MOS detectors were operated in the small window mode (0.3 s time resolution for the inner CCDs). The medium filter was in front of the EPIC cameras in all but the first two observations which were performed with the thick filter. We used all EPIC instruments for imaging, position determination and for the timing and spectral investigations of X7. In most of the observations the source is located at high off-axis angle (see Table 1), and could be outside of the field of view in some of the cameras. Also, the cameras normally cover different times. The XMM-Newton point spread function (PSF) required extraction radii larger than 225 to encircle of the source photons. Depending on the location of the source, counts could be missing due to CCD gaps. Many of the XMM-Newton observations suffer from times of high particle background. To be able to also use these times to cover as much as possible of the X7 binary orbit, we restricted the energy band for light curve and hardness ratio analysis to 0.5–3.0 keV where the source is brightest.
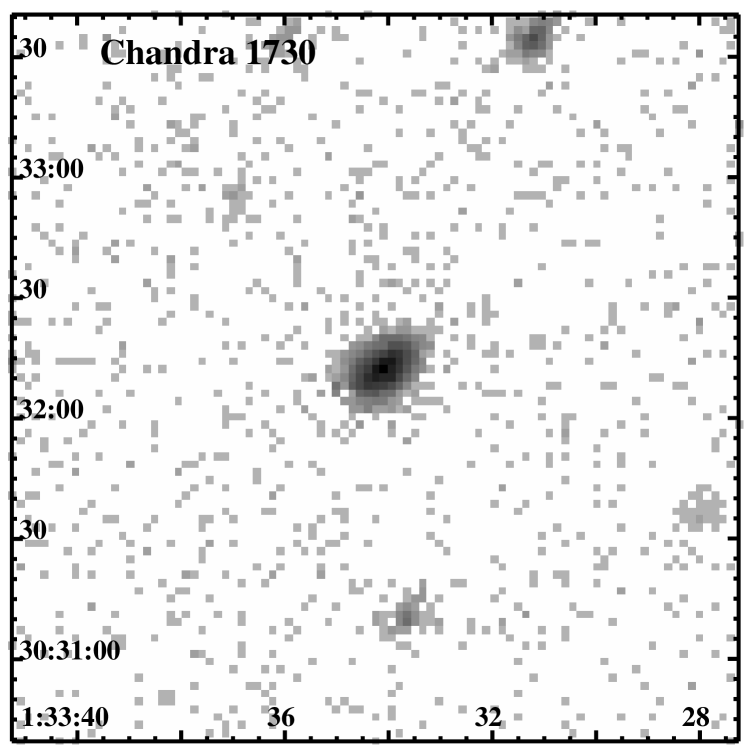
Four Chandra ACIS observations (Weisskopf et al. 2000) of M33 were obtained from the Chandra Data Archive (http://asc.harvard.edu/cgi-gen/cda). However, only the ACIS I observation 1730 (see Table 1) covered the X7 field. The instrument was operated in the full frame mode (3.2 s time resolution). X7 is positioned in the outer corner of the front-illuminated CCD chip I2 during the observation.
The deep space orbits of the satellites XMM-Newton and Chandra led to long continuous observation times of X7. The low earth orbits of the Einstein, ROSAT, ASCA and BeppoSAX observatories on the other hand, led to observations split in many short intervals of typically less than 1 500 s.
The data analysis was performed using tools in the SAS v5.4.0, CIAO v2.3, EXSAS/MIDAS 1.2/1.4, and FTOOLS v5.2 software packages, the imaging application DS9 v2.1b4 , the timing analysis package XRONOS v5.19 and spectral analysis software XSPEC v11.2.
For the time variability investigations all X7 event times were corrected to solar system barycenter arrival times.
2.1 Time variability


The X-ray light curve of X7 was sampled with a time resolution of 1000 s for EPIC PN and with 2000 s for MOS. While we give raw count rate in Table 1, the light curves in Fig. 1 and 4 are corrected for vignetting and EPIC MOS count rates for the difference in instrument efficiency compared to EPIC PN (i.e. increased by a factor of 2.5). The vignetting corrections for far off-axis positions is up to a factor of 3.5 and may include systematic errors of up to 20%. The source extraction radii chosen assure that more than 80% of the PSF are covered. EPIC PN as well as MOS show X7 at low intensity for XMM-Newton observations 0102640101 and 0102641101 which covered binary phase 0.01 to 0.16 according to the ephemeris of D99. During the other XMM-Newton observations (covering binary phase 0.18 to 0.85 according to the ephemeris of D99, see Fig. 1 and 4), the source was in high state. The high state intensity did not vary by more than between the observations. Within the observations the intensities changed by up to 30% on time scales as short as 1000 s (see Fig. 1). No significant variability in hardness ratio was detected between the observations. However, there seems to be variability on shorter time scales. Some of the observations suffer from strong particle background flares which show vignetting effects by the telescope mirrors. We did not exclude these times from the light curves but tried to correct by subtracting this variable background determined as close to X7 as allowed by CCD configuration and emission from other nearby sources. Our selection of the background regions should minimize spurious effects on source count rate and hardness ratio. Nevertheless, residual effects may explain the count rate increase in observation 0141980701 around binary phase 0.55 seen in Fig. 4.
The light curve for the Chandra observation 1730 shows the source out of eclipse. While the count rate in the 0.5–3.0 keV band decreased during the observation by about 20% and there is also variability down to the the sampling time scale of 2000 s, the hardness ratio did not change significantly (Fig. 2).
One has to keep in mind that the EPIC MOS count rates and HRs of X7 can not directly be compared to the PN one as they originate from a CCD with a different energy response function. The same is even more true if one wants to compare Chandra and XMM-Newton count rates and HRs.
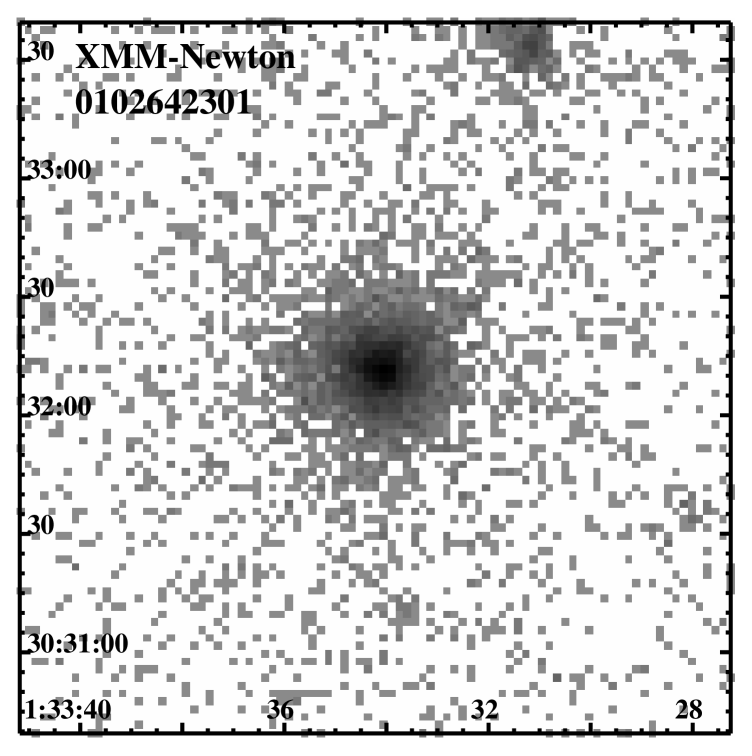
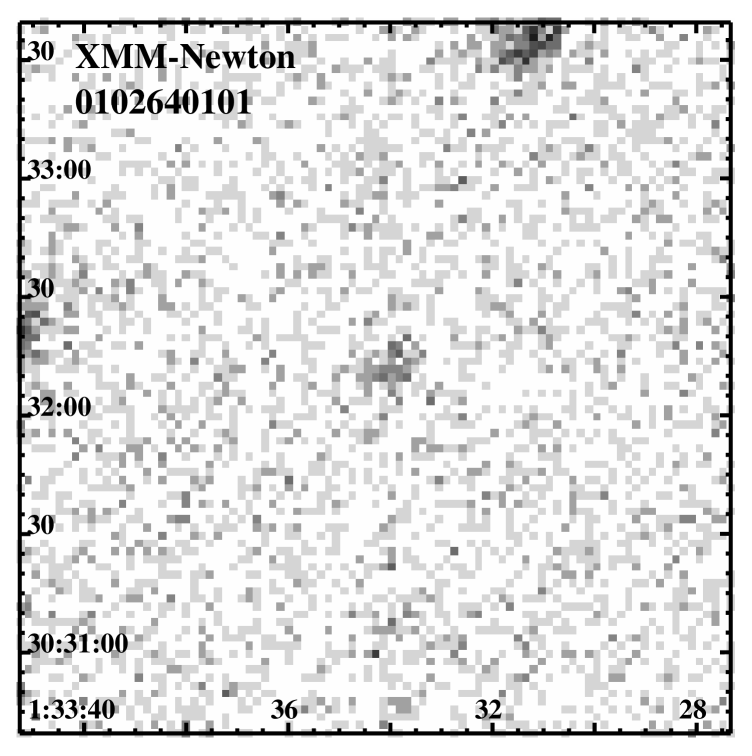
Figure 3 shows images (3′ to a side) of the X7 area in the 0.5–4.5 keV band during the high and low state ( XMM-Newton EPIC cameras are combined). X7 is clearly detected also during the low state ( of the average high state emission).
We searched for pulsations within the bright state XMM-Newton low background observations and the Chandra observation in the frequency range 10-3–4 Hz following the Rayleigh Z method (Buccheri et al. 1983) as described in Haberl & Zavlin (2002). No signal was found with more than 94% () confidence level. This includes the previously suggested period of 0.31 s (D99) although the time resolution of 0.073 s of the PN detector in the full frame mode may not be sufficient to clearly detect such a short period.
2.2 Improved position
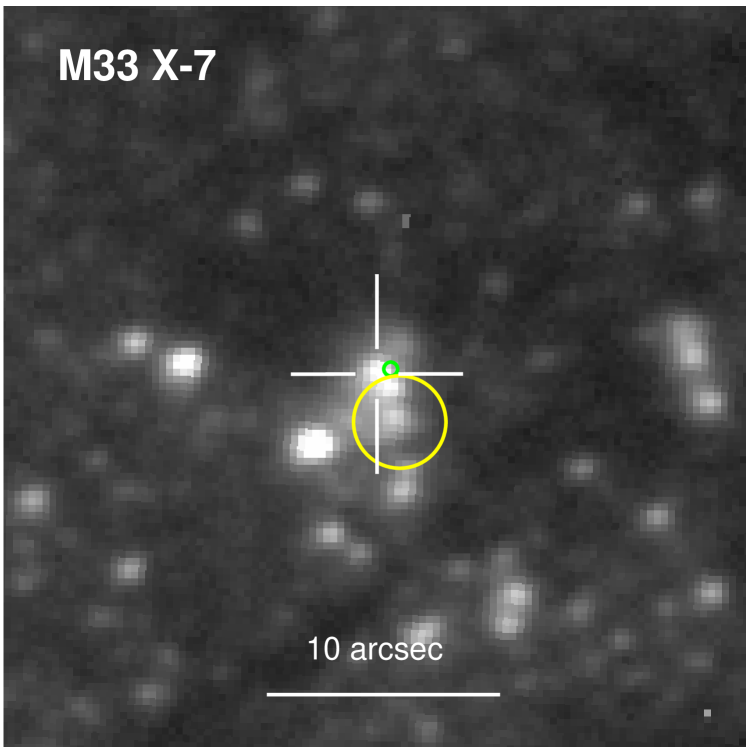
HP01 give the position of X7 with a 90% error radius of 20 which is fully determined by the assumed remaining systematic error of 20. The much higher number of photons detected with the Chandra ACIS I detectors and the good PSF even at an off-axis angle of 86 allow us to determine a significantly improved source position in observation 1730. Systematic errors can be reduced by adjusting the positions using the well determined radio position of a supernova remnant (SNR) close to X7 (source 57 in Gordon et al. 1999) which is also detected in X-rays (X67 in HP01, ), the X-ray source to the NNW of X7 in Fig. 3. We get a significantly improved position for X7: =01h33m3421, =30°32′117 (J2000), with a remaining error radius of 03 mainly determined from the statistical uncertainty of the X67 position.
Several XMM-Newton EPIC observations cover X7 and in addition X67. The integration times of the individual observations are much shorter than for the Chandra observation and the XMM-Newton PSF is worse. XMM-Newton determined positions of X7 have individual error radii of 10 or greater for the PN and MOS cameras and are within the errors consistent with the Chandra position. See Fig. 5 for an overlay of the improved position on a deep optical -band image.
2.3 Energy spectra

| Observation | Inst. | Raw count rate | Model∗ | k | ||||||
|---|---|---|---|---|---|---|---|---|---|---|
| (ks) | ( ct s-1) | ( cm-2) | (keV) | ( erg s-1) | ||||||
| XMM-Newton | PN | 9.0 | 32.00.6 | 119 | POWL | 0.95 | ||||
| EPIC | MOS1 | 12.1 | 10.50.3 | BREMS | 0.79 | |||||
| 0102642301 | MOS2 | 12.2 | 9.20.3 | THPL | 1.47 | |||||
| DISKBB | 0.87 | |||||||||
| Chandra | ACIS I | 49.4 | 10.20.2 | 101 | POWL | 1.23 | ||||
| 1730 | BREMS | 0.98 | ||||||||
| THPL | 7.1 | 4.7 | 6.3 | 2.1 | ||||||
| DISKBB | 0.97 |
∗ : THPL = thin thermal Plasma with solar abundance (XSPEC model MEKAL),
BREMS = thermal bremsstrahlung,
POWL = power law, DISKBB = disk blackbody
∗∗ : Absorption exceeding the fixed Galactic foreground
∗∗∗: In the 0.5–4.5 keV band, corrected for Galactic absorption, corrected for extraction radii and vignetting
| Observation | Thermal bremsstrahlung | Disk blackbody | |||||
| k | k | ||||||
| ( cm-2) | (keV) | ( cm-2) | (keV) | ||||
| 0102641201 | 53 | 0.79 | 0.96 | ||||
| 0102640401 | 68 | 1.05 | 1.20 | ||||
| 0102640501 | 53 | 1.00 | 0.99 | ||||
| 0102640601+ | 18 | 0.88 | 0.99 | ||||
| 0102640701 | 41 | 0.91 | 0.93 | ||||
| 0102642101∗ | 30 | 0.97 | 0.97 | ||||
| 0141980501 | 45 | 0.61 | 0.79 | ||||
| 0141980601 | 75 | 1.25 | 1.15 | ||||
| 0141980701 | 87 | 1.06 | 1.04 | ||||
| 0141980801 | 80 | 1.01 | 0.92 | ||||
| EPIC PN | 251 | 1.07 | 1.04 | ||||
Notes and references:
: M33 X$-$7 only in PN field of view.
: M33 X$-$7 only in MOS field of view.
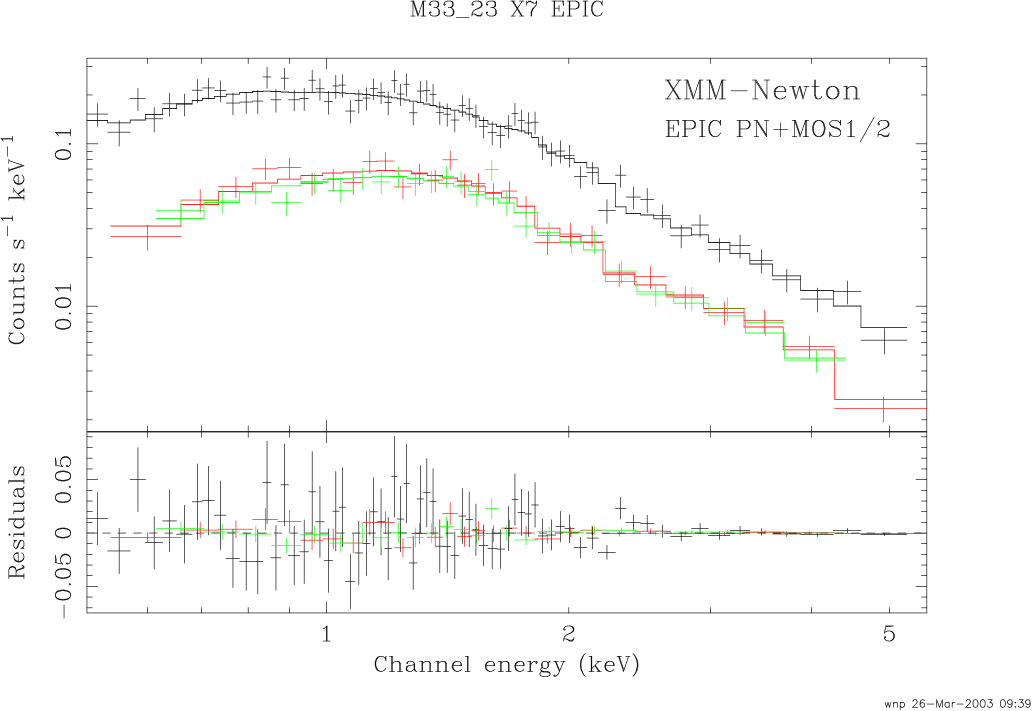
Spectra for the low background XMM-Newton EPIC observation 0102642301 and for the Chandra observation were approximated with simple spectral models (see Table 2). Individual EPIC PN and MOS spectra were simultaneously fitted with the same model parameters correcting for vignetting and the fraction of the PSF covered by the source extraction area. Energy independent normalization factors for each spectrum separately take into account possible differences in source coverage. Model components were the fixed Galactic foreground absorption plus additional absorption within M33 or in the immediate surrounding of the source using XSPEC model component WABS. A thin thermal (MEKAL) model could be rejected due to the high , and also a power law (POWL) model still shows large residuals. Bremsstrahlung (BREMS) and also variable temperature disk blackbody (DISKBB) models on the other hand yield acceptable values. We used the latter models to fit all high state observations of X7 (see Table 3). For all observations, absorbed BREMS or DISKBB models give acceptable fits. The BREMS model needs comparably high absorption outside the Galaxy. The model temperatures are the same within the errors. For the DISKBB model, on the other hand, the additional absorption is very low or absent and inner disk temperatures also don’t vary significantly.
3 Optical observations and results
3.1 Observations
The data were obtained as part of the DIRECT project111For information on the DIRECT project see http://cfa-www.harvard.edu/~kstanek/DIRECT/. (Mochejska et al. 2001a, c, M01b) at the Kitt Peak National Observatory222Kitt Peak National Observatory is a division of NOAO, which are operated by the Association of Universities for Research in Astronomy, Inc. under cooperative agreement with the National Science Foundation. 2.1m telescope during two separate runs, from September 29th to October 5th, 1999 and from November 1st to 7th, 1999. The telescope was equipped with a Tektronix CCD (T2KA camera) having a pixel scale . We collected s exposures in the filter and s in . The exposure times varied slightly to compensate for the changes of seeing conditions. The typical seeing was 15.
3.2 Data reduction and calibration
The preliminary processing of the CCD frames was performed with the standard routines in the IRAF ccdproc package.333IRAF is distributed by the National Optical Astronomy Observatories, which are operated by the Association of Universities for Research in Astronomy, Inc., under cooperative agreement with the NSF. The data were corrected for CCD non-linearity at this stage, as described by Mochejska et al. (2001a).
Photometry was extracted using the ISIS image subtraction package (Alard & Lupton 1998; Alard 2000). A brief outline of the method is presented here. For a more detailed description of the reduction procedure the reader is referred to Mochejska et al. (2001a).
The ISIS reduction procedure consists of the following steps: (1) transformation of all frames to a common coordinate grid; (2) construction of a reference image from several best exposures; (3) subtraction of each frame from the reference image and (4) extraction of profile photometry from the subtracted images.
All computations were performed with the frames internally subdivided into four sections (sub_x=sub_y=2). Differential brightness variations of the background were fit with a second degree polynomial (deg_bg=2). A convolution kernel varying quadratically with position was used (deg_spatial=2). The PSF width (psf_width) was set to 15 pixels. We used a photometric radius (radphot) of 3 pixels.
Due to residual non-linearity, our photometry could not be calibrated from observations of standard stars. The coefficients for the color terms of the transformation were derived from the comparison of our NGC 6791 photometry with the data from the KPNO 0.9m telescope (Kaluzny & Udalski 1992). The offsets were determined relative to 735 stars above mag from the DIRECT catalog of stellar objects in M33 (Macri et al. 2001). The calibration coefficients can be found in M01b.
The transformation from rectangular to equatorial coordinates was derived using 894 transformation stars with from the DIRECT catalog of stellar objects in M33 (Macri et al. 2001). The average difference between the catalog and the computed coordinates for the transformation stars was 006 in right ascension and 006 in declination.
3.3 Results
| F | HJD | Mag | F | HJD | Mag |
|---|---|---|---|---|---|
| 2451400 | 2451400 | ||||
| V | 52.721458 | 18.854(4) | B | 56.793912 | 18.887(4) |
| V | 52.730637 | 18.856(3) | V | 56.811296 | 18.884(4) |
| V | 52.780012 | 18.852(3) | B | 56.820741 | 18.873(4) |
| V | 52.788819 | 18.849(4) | V | 56.829560 | 18.876(5) |
| B | 52.798183 | 18.852(3) | B | 56.840301 | 18.865(4) |
| V | 52.846146 | 18.861(4) | V | 56.853021 | 18.871(4) |
| V | 52.854931 | 18.861(4) | V | 56.877454 | 18.872(5) |
| V | 52.907662 | 18.858(6) | V | 56.887141 | 18.892(3) |
| B | 52.916632 | 18.856(5) | V | 57.674028 | 18.867(7) |
| V | 52.967407 | 18.867(5) | B | 57.699340 | 18.829(8) |
| V | 52.976493 | 18.865(5) | V | 57.771528 | 18.848(5) |
| V | 53.005012 | 18.847(5) | V | 57.804664 | 18.851(5) |
| V | 53.919248 | 18.841(4) | B | 57.814074 | 18.838(4) |
| V | 54.676273 | 18.878(6) | V | 57.857789 | 18.830(4) |
| V | 54.686343 | 18.881(5) | V | 57.866620 | 18.829(4) |
| B | 54.696771 | 18.866(3) | B | 57.875891 | 18.831(4) |
| V | 54.705671 | 18.878(3) | V | 57.940764 | 18.814(5) |
| V | 54.720822 | 18.881(4) | B | 57.950278 | 18.842(4) |
| B | 54.729942 | 18.855(3) | B | 84.699097 | 18.873(3) |
| V | 54.738519 | 18.879(3) | V | 84.708727 | 18.884(3) |
| V | 54.777199 | 18.871(3) | V | 84.726852 | 18.890(4) |
| V | 54.791528 | 18.870(3) | V | 84.777234 | 18.866(4) |
| B | 54.800428 | 18.875(3) | B | 84.785775 | 18.865(4) |
| V | 54.809769 | 18.873(4) | V | 84.794618 | 18.865(4) |
| V | 54.819468 | 18.874(3) | V | 84.849259 | 18.861(3) |
| V | 54.860521 | 18.884(4) | V | 84.883831 | 18.846(4) |
| B | 54.869780 | 18.897(4) | B | 84.895440 | 18.844(3) |
| B | 54.878403 | 18.898(4) | V | 84.906539 | 18.855(4) |
| V | 54.906435 | 18.902(4) | V | 84.952697 | 18.850(7) |
| V | 54.915324 | 18.897(4) | B | 86.634097 | 18.853(3) |
| V | 54.971019 | 18.914(4) | V | 86.643438 | 18.855(4) |
| B | 54.987986 | 18.923(4) | V | 86.727384 | 18.844(4) |
| V | 54.997303 | 18.924(4) | B | 86.742824 | 18.837(4) |
| V | 55.753866 | 18.832(5) | V | 86.897975 | 18.821(6) |
| B | 55.762789 | 18.827(4) | V | 86.921400 | 18.814(6) |
| V | 55.861551 | 18.820(4) | V | 88.643009 | 18.841(4) |
| B | 55.870822 | 18.824(3) | B | 88.652106 | 18.843(3) |
| V | 55.958808 | 18.813(4) | V | 88.664965 | 18.835(4) |
| V | 56.672176 | 18.888(4) | V | 88.728738 | 18.839(3) |
| B | 56.680891 | 18.895(3) | V | 88.741968 | 18.826(4) |
| V | 56.690012 | 18.884(4) | V | 88.750914 | 18.816(4) |
| B | 56.701400 | 18.883(3) | B | 88.760104 | 18.845(2) |
| V | 56.715382 | 18.909(5) | B | 88.780637 | 18.824(3) |
| B | 56.724583 | 18.906(4) | V | 88.878808 | 18.826(6) |
| V | 56.739606 | 18.886(6) | V | 88.893958 | 18.830(7) |
| B | 56.748368 | 18.883(5) | V | 88.927685 | 18.813(7) |
| V | 56.757824 | 18.888(6) | V | 89.698310 | 18.912(4) |
| B | 56.766597 | 18.880(4) | V | 89.710938 | 18.912(3) |
| V | 56.775752 | 18.882(3) | V | 90.841655 | 18.838(5) |
| V | 56.786528 | 18.891(4) | V | 90.886076 | 18.835(6) |
We have searched within a radius of 36″ around the SIMBAD position of X7 for stars with a period of around 3.45 d. From the 715 stars examined only one was a binary with a period of about 3.46-3.48 days. It is a star at position =01h33m3420, =30°32′1108 (J2000), with an average V magnitude of 18.86, and an amplitude of variation in this band of about 0.11 mag. From the images it seems to be located in a small star cluster (see Fig. 5). Measured V and B magnitudes are given in Table 4.
The binary light curve in the V band using the ephemeris of D99 (Fig. 4) shows two maxima and minima of different depth as expected for an ellipsoidal and X-ray heating light curve for a high mass XRB (HMXB) together with a double-sinusoidal fit to the data (average V magnitude of , amplitude mag). The phase of the shallower minimum is shifted by with respect to the eclipse center of D99 in the same direction as also indicated by the X-ray light curve (see Sect. 2.1). The double-sinusoidal fit is only a crude approximation to the data and the model parameters certainly are affected by non-uniform sampling of the optical light curve. The data suggest a deeper secondary minimum (around phase 0.6) which according to Tjemkes et al. (1986) might point at the effect of an accretion disk in the system. V magnitude and B–V color at X-ray eclipse are 18.890 and -0.005.
4 Discussion
4.1 Improved ephemeris
D99 determined the eclipse parameters for X7 using in total 50 ks and 325 ks of archival ROSAT PSPC and HRI data, respectively, integrated over one satellite orbit (3 ks time bins). The XMM-Newton and Chandra low and high state observations of X7 can naturally be explained by finding the source within and out of eclipse. Unfortunately, neither of the observations covered eclipse ingress or egress. However, from the XMM-Newton light curves we can deduce that the eclipse egress lasts and the ingress in phase (well within the parameter range given by D99). These values are only poorly determined due to gaps in the phase sampling over the orbit. More observations are needed to further constrain the binary ephemeris.
Nevertheless, we can restrict the time of eclipse egress to HJD () assuming that it is constrained by the end of observation 0102640101 (when X7 is still in eclipse) and the beginning of observation 0141980501 (when, 261 binary orbits later, X7 is already out of eclipse). With the eclipse shape parameters of D99 we then derive a mid-eclipse epoch of HJD (). The new X-ray mid-eclipse time corresponds to binary phase 0.07 in Fig. 4. Combining this result with the mid-eclipse epoch of D99 we get an improved orbital period for X7 of () d well within the period errors given by D99.
4.2 The optical companion
The spectral classification of the optical companion can be deduced from the absolute optical magnitude and color during X-ray eclipse when we see the optical surface that is mostly undisturbed by gravitational effects, an expected accretion disk and heating by the X-ray source. To derive the absolute magnitude the measured brightness has to be corrected for the distance (-24.502 mag for the assumed distance of 795 kpc) and for interstellar extinction, the color has to be corrected for reddening. These corrections can be estimated from the Galactic in the direction of X7 as mag and (Predehl & Schmitt 1995). The column depth of the M33 disk in the direction of X7 is varying significantly on small scales. X7 is not located in one of the H i holes catalogued by Deul & den Hartog (1990). The absorbing column within M33 can be determined to 2.2 cm-2 from a arcsec half power beam width H i map (Newton 1980). The absorbing columns derived from the spectral fits to the X-ray spectra indicate half or less than this absorbing column depending on the spectral model. Assuming that we see X7 through half of this column and that the same conversion applies as used above, we get mag and . The companion star therefore should have an absolute V magnitude of -6.0 to -6.6 and (B-V)0 of -0.12 to -0.33, which would correspond to a star of spectral typ B0I to O7I and masses of 25 to 35 M☉ (see e.g. Aller et al. 1982). Optical companions of similar spectral type were proposed by D99 based on binary orbit and eclipse length, assuming a 1.4 M☉ neutron star as the compact object.
4.3 M33 X$-$7, an eclipsing black hole XRB?
We can use the mass of the optical companion as determined in the previous subsection and the mass ratios determined from binary orbit and eclipse length (see D99 and Paczyński 1971; Eggleton 1983) to determine the mass of the compact object. For a binary inclination of 90°, the mass ratio q() is 0.085 yielding of 2.1–3.0 M☉, significantly higher than expected masses of neutron stars. For an inclination of 70°, q is 0.036 and M☉ well in the range of typical neutron star masses. The inclination can not be constrained by our measurements and the mass estimates above do not exclude a neutron star for the compact object in the system.
Further information on the nature of the compact object may be infered from the X-ray spectrum. Before XMM-Newton and Chandra, the X-ray spectrum of X7 was investigated using ROSAT and BeppoSAX observations. HP01 found that the X7 spectrum in the ROSAT band can be described by an absorbed power law ( = (1.90.9) cm-2 and ). Thin thermal plasma models did not give acceptable fits. Parmar et al. (2001) reported that BeppoSAX detected X7 in the 2–8 keV band. The spectrum could be described equally well by a power law ( 9.8 cm-2 and photon index ) or a Bremsstrahlung model ( 11 cm-2 and k). If the absorption is fixed to 5.6 cm-2, the power law photon index is constrained to 1.70.6 and the Bremsstrahlung temperature to 3.7 keV. Keeping in mind the large uncertainties in the parameters, these results are consistent with the XMM-Newton and Chandra spectra reported for this persistent source in Sect. 2.3. In the following we therefore concentrate on these higher quality spectral results.
Thermal Bremsstrahlung and disk blackbody models yield acceptable fits to the XMM-Newton and Chandra spectra (see Sect. 2.3). For the first model an absorbing column comparable to half the H i values at the position of X7 within M33 (see above) is needed to fit the X7 spectra. The second model only allows us to determine upper limits for the M33 absorbing column in front of X7 which are smaller than half the M33 column depth at that position. The X7 X-ray spectra are steeper in the 2–10 keV band than typical for HMXB (flat power law shapes with photon indices of , White et al. 1983) and better resemble the spectra of persistent black hole XRBs like LMC X$-$1 and Cyg X$-$1 (see e.g. Cui et al. 2002).
Therefore, the spectral results, our unsuccessful search for X-ray pulsations and the high mass estimate of the compact object, infered from the identified optical companion indicate a black hole as the compact object. These findings make M33 X$-$7 a very interesting source for further investigation as it could be the first eclipsing HMXB with a black hole as the compact object.
5 Conclusions
XMM-Newton and Chandra observations of the persistent eclipsing HMXB M33 X$-$7 allowed us to improve on the orbital period and investigate the X-ray spectrum in unprecedented detail. No X-ray pulsations were detected. A special investigation of the optical variability of DIRECT data of the region revealed in the optical the orbital light curve of a high mass companion. X-ray and optical data point at a black hole as the compact object in the system. Optical spectroscopy and high sensitivity X-ray pulsation searches are needed to clarify the situation.
Acknowledgements.
The XMM-Newton project is supported by the Bundesministerium für Bildung und Forschung / Deutsches Zentrum für Luft- und Raumfahrt (BMBF/DLR), the Max-Planck Society and the Heidenhain-Stiftung.References
- Alard (2000) Alard, C. 2000, A&AS, 144, 363
- Alard & Lupton (1998) Alard, C. & Lupton, R. H. 1998, ApJ, 503, 325
- Aller et al. (1982) Aller, L. H., Appenzeller, I., Baschek, B., et al., eds. 1982, Landolt-Börnstein: Numerical Data and Functional Relationships in Science and Technology - New Series ” Gruppe/Group 6 Astronomy and Astrophysics ” Volume 2 Schaifers/Voigt: Astronomy and Astrophysics / Astronomie und Astrophysik ” Stars and Star Clusters / Sterne und Sternhaufen
- Buccheri et al. (1983) Buccheri, R., Bennett, K., Bignami, G. F., et al. 1983, A&A, 128, 245
- Cui et al. (2002) Cui, W., Feng, Y. X., Zhang, S. N., et al. 2002, ApJ, 576, 357
- Deul & den Hartog (1990) Deul, E. R. & den Hartog, R. H. 1990, A&A, 229, 362
- Dickey & Lockman (1990) Dickey, J. M. & Lockman, F. J. 1990, ARA&A, 28, 215
- Dubus et al. (1999) Dubus, G., Charles, P. A., Long, K. S., Hakala, P. J., & Kuulkers, E. 1999, MNRAS, 302, 731
- Eggleton (1983) Eggleton, P. P. 1983, ApJ, 268, 368
- Gordon et al. (1999) Gordon, S. M., Duric, N., Kirshner, R. P., Goss, W. M., & Viallefond, F. 1999, ApJS, 120, 247
- Haberl & Pietsch (2001) Haberl, F. & Pietsch, W. 2001, A&A, 373, 438
- Haberl & Zavlin (2002) Haberl, F. & Zavlin, V. E. 2002, A&A, 391, 571
- Humphreys & Sandage (1980) Humphreys, R. M. & Sandage, A. 1980, ApJS, 44, 319
- Jansen et al. (2001) Jansen, F., Lumb, D., Altieri, B., et al. 2001, A&A, 365, L1
- Kaluzny & Udalski (1992) Kaluzny, J. & Udalski, A. 1992, Acta Astronomica, 42, 29
- Larson & Schulman (1997) Larson, D. T. & Schulman, E. 1997, AJ, 113, 618
- Liu et al. (2000) Liu, Q. Z., van Paradijs, J., & van den Heuvel, E. P. J. 2000, A&AS, 147, 25
- Long et al. (1981) Long, K. S., Dodorico, S., Charles, P. A., & Dopita, M. A. 1981, ApJ, 246, L61
- Macri et al. (2001) Macri, L. M., Stanek, K. Z., Sasselov, D. D., Krockenberger, M., & Kaluzny, J. 2001, AJ, 121, 861
- Markert & Rallis (1983) Markert, T. H. & Rallis, A. D. 1983, ApJ, 275, 571
- Mochejska et al. (2001a) Mochejska, B. J., Kaluzny, J., Stanek, K. Z., Sasselov, D. D., & Szentgyorgyi, A. H. 2001a, AJ, 121, 2032
- Mochejska et al. (2001b) —. 2001b, AJ, 122, 2477
- Mochejska et al. (2001c) —. 2001c, AJ, 121, 3284
- Newton (1980) Newton, K. 1980, MNRAS, 191, 615
- Paczyński (1971) Paczyński, B. 1971, ARA&A, 9, 183
- Parmar et al. (2001) Parmar, A. N., Sidoli, L., Oosterbroek, T., et al. 2001, A&A, 368, 420
- Peres et al. (1989) Peres, G., Reale, F., Collura, A., & Fabbiano, G. 1989, ApJ, 336, 140
- Pietsch et al. (2003) Pietsch, W., Ehle, M., Haberl, F., Misanovic, Z., & Trinchieri, G. 2003, Astronomische Nachrichten, 324, 85
- Predehl & Schmitt (1995) Predehl, P. & Schmitt, J. H. M. M. 1995, A&A, 293, 889
- Schulman et al. (1993) Schulman, E., Bregman, J. N., Collura, A., Reale, F., & Peres, G. 1993, ApJ, 418, L67
- Schulman et al. (1994) —. 1994, ApJ, 426, L55
- Strüder et al. (2001) Strüder, L., Briel, U., Dennerl, K., et al. 2001, A&A, 365, L18
- Tjemkes et al. (1986) Tjemkes, S. A., van Paradijs, J., & Zuiderwijk, E. J. 1986, A&A, 154, 77
- Trinchieri et al. (1988a) Trinchieri, G., Fabbiano, G., & Peres, G. 1988a, ApJ, 325, 531
- Trinchieri et al. (1988b) —. 1988b, ApJ, 329, 1037
- Turner et al. (2001) Turner, M. J. L., Abbey, A., Arnaud, M., et al. 2001, A&A, 365, L27
- van den Bergh (1991) van den Bergh, S. 1991, PASP, 103, 609
- Weisskopf et al. (2000) Weisskopf, M. C., Tananbaum, H. D., Van Speybroeck, L. P., & O’Dell, S. L. 2000, in Proc. SPIE Vol. 4012, p. 2
- White et al. (1983) White, N. E., Swank, J. H., & Holt, S. S. 1983, ApJ, 270, 711