BeppoSAX observations of rotation-powered pulsars
Abstract
During its life, BeppoSAX observed several isolated pulsars, giving important contributions to the knowledge of the phenomenology and properties of the X-ray emission from this class of sources. In this paper I review the spectral and timing results obtained from BeppoSAX observations. In particular, results on three Crab-like (Crab, PSR B1509-58 and PSR B0540-69) and 3 millisecond pulsars (PSR J0218+42, PSR B1821-24 and PSR B1937+21) are reported.
1 INTRODUCTION
BeppoSAX satellite operated between April 1996 and April 2001. Its scientific payload included 4 Narrow Field Instruments (hereafter NFIs; for a detailed description of the scientific payload see Boella et al. 1997) covering nearly three orders of magnitude for energy from 0.1 up to 300 keV. During its lifetime BeppoSAX observed about 20 fields of isolated pulsars detecting the source in more than half of them.
In this review, the most relevant spectral and timing results for the three more intense Crab-like pulsars, Crab, PSR B1509-58 and PSR B0540-69, and three millisecond pulsars, PSR J0218+42, PSR B1937+21 and PSR B1821-24 are reported.
2 THE CRAB PULSAR
The Crab pulsar (PSR B0531+21) is the only rotation powered pulsar observed at almost every energy band of the electromagnetic spectrum. Its pulse profile is characterized by a double peak structure with a phase separation of 0.4, approximately aligned in absolute phase over all wavelengths. The relative intensity, height and width of the two peaks varies with energy: in particular, the first peak (P1), dominant al low energies, becomes smaller than the second one (P2) in the soft rays. The enhancement of the bridge between these peaks - hereafter named inter-peak (Ip) region - as function of energy is also well evident. The Crab pulsar was first detected in the X-ray band by Frits et al. (1969) and by Bradt et al. (1969). The HEAO-2 satellite produced the first high resolution ( 4”) image of the Crab nebula/pulsar in X-ray along with the phase profile (Harden and Seward 1984). Pravdo et al. (1997) reported detailed pulse-phase resolved spectral analysis of the pulsed emission obtained with the PCA (5 - 60 keV) and HEXTE (16 - 250 keV) instruments on board RossiXTE. They found systematic spectral changes in the photon power law index as a function of pulse phase. Recently, Kuiper et al. (2001) by using the high energy -ray data from the CGRO satellite together with data obtained at soft/hard X-ray energies from other observatory obtained an exhaustive high-energy picture of the Crab pulsar from 0.1 keV up to 10 GeV.
BeppoSAX observed the Crab Nebula and Pulsar several times because this source was used for periodical calibration of the NFIs. All these observations provide a high statistics data set ( 200 ks) that allowed to perform a very accurate timing and spectral analysis over an energy range wider than two orders of magnitude from about 0.1 up to 300 keV (see Massaro et al. 2000 for details). Timing analysis for this source was performed producing phase histograms for each NFI and each pointing. The values of P and were derived from the Jodrell Bank Crab Pulsar Monthly Ephemeris (http://www.jb.man.ac.uk). The good signal to noise ratio of the NFIs, together with the high statistics allowed to describe the pulse profiles over the entire band in very high detail as shown in the top panels of Fig. 1. The morphology change of the profile as function of the energy is striking, with the second peak increasing from the soft range of the LECS (0.1-10 keV) up to the harder range of the PDS (15-300 keV).

Phase resolved spectral analysis was performed with a minimum phase resolution of 0.00667 unless the count number was not high, as in the interpeak region and in some energy ranges, where wider phase intervals were taken to reduce the statistical uncertainty in estimating the spectral parameters. Modeling the spectra with a simple power law, photon indices were computed for each NFI. A column density =3.21021 cm-2 derived from the spectrum of the off-pulse interval (Massaro et al. 2000) was fixed for all following fit procedures. The bottom panels in Figure 1 show the phase evolution of the spectral index in the four NFIs. The photon index changes along with the phase with a similar phase dependence in each panel: The softer emission is in P1 and P2 region while the hardest is in the middle of Ip; the spectral index difference is of the order of 0.3-0.5. Moreover, comparing the panels from left to right, we can note that the photon index, relative to the same phase interval, significantly increases with the energy. In particular, photon index of P1 changes from 1.6 in the LECS range to 2.1 at higher energies, that of P2 from 1.8 to 2.0 and Ip from 1.2 to 1.8. The phase evolution of the spectral index is very similar to that found by Pravdo et al (1997), but the spectral softening towards higher energies is not so clear as in our results because of the worse S/N ratio of the RXTE data at energies greater than 100 keV.
To explain the phase evolution of the spectral index and the change of the pulse shape with the energy a two component model was proposed by Massaro et al. (2000). They considered that the observed pulsed emission is due to the superposition of two components having different phase and energy distributions. The first component was assumed to have the same pulse profile as observed at optical frequencies with P1 much more prominent than P2 and a very low intensity in the Ip region, the second one with a harder spectrum and a phase profile estimated from the BeppoSAX data, by means of a fitting procedure of several pulse profiles at different energies, in order to reproduce the observed pulse profile when it was summed to the first component. This second component was found to be much higher than the first one in the Ip region, while the two components have a comparable intensity in the P2 region.
As a consequence of the photon index behaviour with energy, shown in Figure 1, we found that a single power law was not able to give a satisfactory representation of the spectral distribution, for a fixed phase interval region, over the entire BeppoSAX range (0.1-300 keV). Better fits were obtained using a second order law in the double log representation:
where is taken equal to 1 keV, and therefore corresponds to the photon index at this energy, while measures the curvature of the spectral distribution. Applying this model to three wider phase intervals, the first peak (P1) region (0.99-0.01667), the Interpeak (Ip) region (0.01667-0.28) and the second peak (P2) (0.3833-0.4167) we obtained a value for the bending parameter of 0.15 over the three phase intervals, and for the parameter the values 1.630.08 (P1), 1.310.03 (Ip) and 1.550.09 (P2). The best fit parameters are summarized in Table 1.
3 PSR B1509-58
PSR B150958 is one of the youngest rotation powered pulsars, with a period of about 150 ms and a period derivative of 1.5 s s-1, the highest spin-down rate of any known pulsar. It was first discovered in the soft X-rays by Einstein (Seward & Harnden 1982) and soon afterwards detected in the radio band (Manchester, Tuohy & D’Amico 1982). Later on, its pulsed emission was also detected at hard X-ray and soft -ray energies by several satellite and balloon-borne experiments: EXOSAT (0.025–11 keV; Trussoni et al. 1990), Ginga (2–60 keV; Kawai et al. 1992), SIGMA (40–300 keV; Laurent et al. 1994), Welcome-1 (94–240 keV; Gunji et al. 1994), ROSAT (0.1–2.4 keV; Greiveldinger et al. 1995), ASCA (0.5-10 keV, Saito 1998), BATSE and OSSE aboard the Compton Gamma Ray Observatory (20-5000 keV; Wilson et al. 1993, Matz et al. 1994, Ulmer et al. 1993). A detailed study of the pulse shape and spectrum in the energy range 2–200 keV with the PCA and HEXTE aboard the Rossi X-Ray Timing Explorer has been presented by Marsden et al. (1997) and Rots et al. (1998). Kuiper et al. (1999) reported definitive detection of the pulsed signal in the COMPTEL band up to 10 MeV. Moreover, they found a source compatible with the position of PSR B150958 in the skymaps of COMPTEL and EGRET between 10 and 100 MeV.

Given its high X-ray flux, second in intensity among the isolated pulsars, the BeppoSAX observation allowed to perform timing and spectral analysis at similar statistical significance as for the Crab (Cusumano et al. 2001). The pulse profile extracted by folding the MECS data (1.6-10 keV) is shown in Figure 2. The well known single pulse shape is evident. It is markedly not symmetric with the leading wing much steeper than the trailing one. No significant variation of the profile morphology has been detected inside the BeppoSAX energy band (Cusumano et al. 2001). In the spectral analysis, the pulsed and unpulsed spectra were extracted for the phase intervals 0.17-0.53 and 0.77-1.07, respectively, adopting the phase definitions of Mardsen et al. (1997). A column density of (0.910.05) cm-2 was evaluated by analyzing the LECS and MECS spectra of the off-pulse region, assuming that the emission is mainly originating from the nebula, at the same distance as the pulsar. The X-ray and soft -ray pulsed spectra have usually been fitted with power laws, but the resulting photon indices were generally found to vary with the instrument energy windows. Trussoni et al. (1990) first measured a photon index of about 1.1 with an EXOSAT observation; the same value was found by Saito (1998) with ASCA. Ginga and RXTE observations gave a photon index of 1.35 (Kawai et al. 1993, Marsden et al. 1997), and an even steeper value of 1.68 was derived from BATSE and OSSE observations (Wilson et al. 1992, Matz et al. 1994), suggesting a softening towards the higher energies. However, no evidence for a spectral break was seen in the RXTE data up to keV (Mardsen et al. 1997). Figure 3 reports the photon index obtained by fitting the pulsed spectra for each of the BeppoSAX NFI with simple power laws. Notice that the photon index for the PDS is significantly larger than that for the MECS, while that derived for the LECS is smaller.

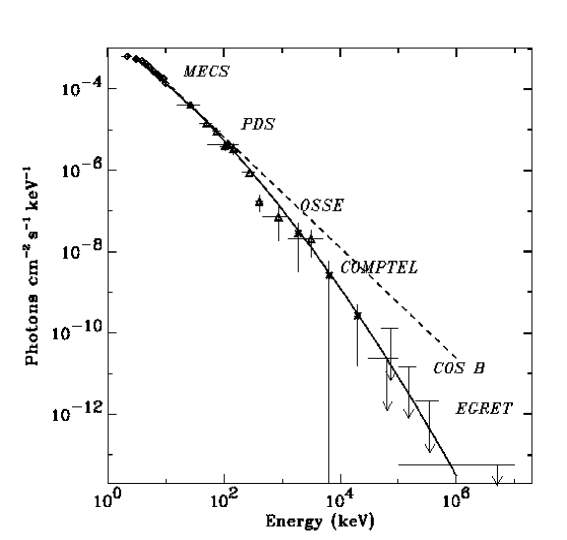
In analogy with the Crab Pulsar, a simultaneous fit of a single power law shape to the pulsed emission over the entire BeppoSAX range did not give a satisfactory result ( = 1.5 with 39 d.o.f.). Fitting the whole BeppoSAX spectrum of PSR B1509-52 with the continuously steepening law of Eq. (1) gives a better representation of the spectral distribution ( = 0.74 with 38 d.o.f.). The best fit values of the parameters were: 0.960.08 and 0.160.04 (see Table 1 for a comparison with the Crab results). The extrapolation of Eq. (1) to higher energies predicts fluxes in agreement with the values measured by OSSE, BATSE and COMPTEL (Wilson et al. 1993; Matz et al. 1993; Ulmer et al. 1993: Kuiper et al. 1999). This result is clearly shown in Figure 3. For comparison, the extrapolation of the simple power–law model is also shown.
| Crab pulsar | Crab pulsar | Crab pulsar | PSR B1509-58 | PSR B0540-69∗ | |
|---|---|---|---|---|---|
| (P1) | (Ip) | (P2) | |||
| 1.630.08 | 1.31 0.03 | 1.550.09 | 1.030.05 | 1.3600.005 | |
| 0.160.04 | 0.15 0.09 | 0.130.03 | 0.130.02 | 0.1430.003 | |
| ∗ de Plaa et al. (2003) |
4 PSR B0540-69
Another Crab-like pulsar whose pulsed emission was detected by BeppoSAX is PSR B0540-69. This pulsar, located in the Large Magellanic Cloud has a pulsed period of about 50 ms and a large period derivative of s s-1, comparable to that of the Crab pulsar. PSR B054069 was discovered in the soft X-rays by Seward et al. (1984) with the Einstein Observatory. Pulsations at optical frequencies were soon detected by Middleditch and Pennypacker (1985) with a mean pulsed magnitude of 22.5. In the radio band PSR B054069 is a quite faint source and pulsed signals were first observed only in 1989-90 (Manchester et al. 1993). BeppoSAX detected the pulsar only by the imaging LECS and MECS instruments (Mineo et al. 1999 and Cusumano et al. 2003). Several estimates of the braking index of this pulsar have been reported in the literature ranging from 2.01 0.02 (Manchester and Peterson 1989, Nagase et al. 1990) to 2.74 0.10 (Ögelman and Hasinger 1990). The BeppoSAX estimate of the pulsar period, combined with earlier ASCA period evaluations, allowed to measure a braking index of 2.10 0.1. This results has been recently confirmed by a combined timing analysis on an extended data set including ASCA, BeppoSAX and RXTE observations spanning a time interval of about 8 years (Cusumano et al. 2003).
Given the larger distance with respect to the previous two pulsars, BeppoSAX data had not enough statistics to detected pulsed emission at energies greater than 10 keV. The energy band was not wide enough to investigate the presence of bending in the spectral distribution like that found in the other two Crab-like pulsars. Recently, de Plaa et al. (2003), making use of a long set of RXTE observations derived the pulse profiles and spectral distribution up to 50 keV. By fitting RXTE data together with the ROSAT ones they found that pulsed emission can not be described by a single power law because of the presence of a bend towards higher energies. In analogy with the results shown just above, the spectral distribution of this pulsar is well described by Eq. (1) with a value of the bending parameter similar to that found for Crab and PSR B1509-58 (Table 1).
5 PSR J0218+4232
PSR J021842 is a 2.3 millisecond pulsar in a two day orbit around a white dwarf companion (Navarro et al. 1995). The pulsar has spin a down energy of =2.51035 erg s-1, a bipolar magnetic field component at the star surface of B=4.3108 G and spin down age 4.6108 yr. Soft X-ray emission and pulsation were first detected by ROSAT HRI (Verbunt et al. 1996; Kuiper et al. 1998) with a pulse profile characterized by a sharp main pulse and an indication of a second peak. Emission at -rays from this pulsar has been marginally detected with EGRET on board GRO with a double peak profile with 3.5 significance (Kuiper et al. 2000). Recently, Chandra X-ray Observatory (CXO) and Rossi X-ray Timing Explorer (RXTE) observations were able to aligned the X-ray pulse profile with 2 of the 3 pulses visible at radio-frequencies and with the two -ray pulses detected in EGRET, increasing the significance of the detection to a 4.9 (Kuiper et al. 2002).
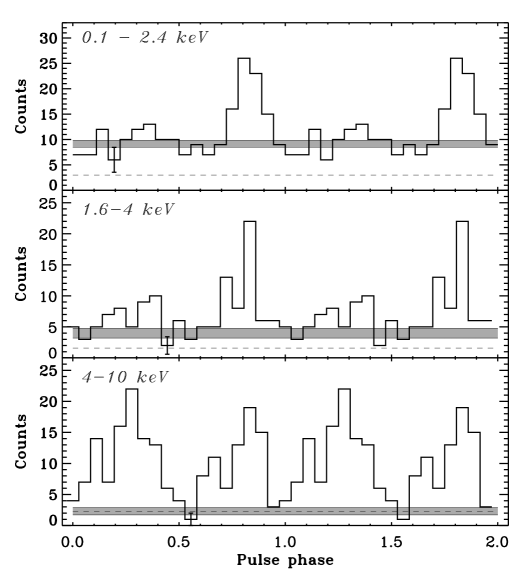
The BeppoSAX observation of the 2.3 millisecond pulsar PSR J0218+4232 provided for the first time detailed information on the pulsar’s temporal and spectral properties over the broad energy band 1.6–10 keV (Mineo et al. 2000). Pulsed emission was detected in the MECS energy band (1.6–10 keV) with a significance of 6.8 at the frequency extrapolated from radio ephemeris. Figure 4 shows the light curves in the energy bins 1.6-4 keV and 4-10 keV resulting from folding all MECS events with a phase resolution of 18 bins ( 0.13 ms). The pulse profiles in the MECS ranges are characterized by a double peak structure with a relative phase separation of 0.470.05. The MECS background level, determined from the spatial analysis is indicated with a dashed line.
In the same figure (top panel) the ROSAT (0.1–2.4 keV) profile (Kuiper et al. 1998) is shown, shifted in phase to obtain the highest peak coincident with the most significant one in the MECS softer light curve (middle panel).
These profiles clearly show a change of the relative peak intensities. The peak at phase 0.8 is stronger in the low energy histograms (top and middle panels), while that at phase 0.3, which is not prominent in the ROSAT low energy phase histogram, becomes the dominant feature above 5 keV (bottom panel). This behaviour reminds the P1/P2 ratio observed in the Crab light curve at higher energies. The unpulsed component determined by applying the bootstrap method (Swanepoel et al. 1996) is shown as shaded area in all three panels of Figure 4. Notice that, while in the ROSAT profile a DC component is apparent above the background level, the same does not hold for the 4–10 keV profile, where the background level is consistent with the intensity measured in the valleys of the light curve. In the intermediate energy profile there is evidence for a DC component but its intensity is not as high as in the ROSAT profile. Such effect can be interpreted as the presence of a quite soft unpulsed emission.
The pulsed emission is well modeled with a power–law, absorbed at low energy by the galactic column density with NH of 51020 cm-2 (see Verbunt et al. 1996). The measured photon index is 0.610.32 harder than for any other isolated pulsar. Spectra for the pulses P1 and P2 were also fitted with power-law models with spectral indices of and , respectively, in agreement with the trend seen in Figure 5. The unabsorbed (2–10 keV) pulsed flux is 4.110-13 erg cm-2 s-1 implying a luminosity of erg s-1, where is the solid angle spanned by the emission beam.
6 PSR B1937+21
PSR B193721, the fastest known millisecond pulsar (P=1.558 ms),
is located at a distance of 3.6 kpc as based on dispersion
measure (Taylor & Cordes 1993). Its spin down energy is
=1.11036 erg s-1 and the dipolar
magnetic field component at the star surface is
B=4.1108 G.
It was discovered in radio by Backer et al. (1982).
X–ray emission from this pulsar
was first detected by ASCA (Takahashi et al. 2001) above 2 keV,
with a pulse profile characterized by a single sharply peak and a
pulsed fraction of 44%. ASCA data allowed to aligned the X-ray
peak to the radio interpeak.
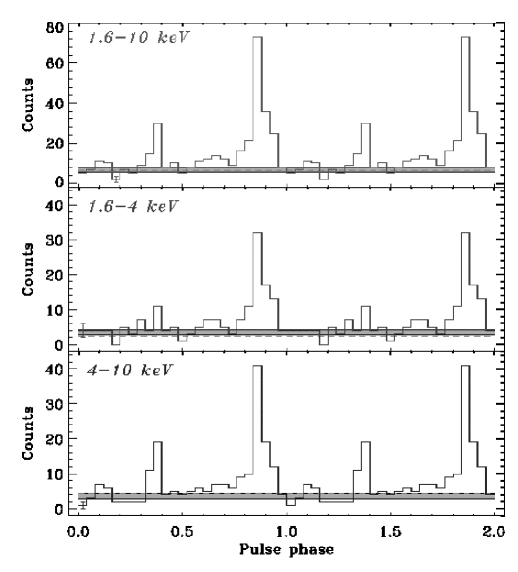
BeppoSAX detected pulsed emission from PSR B1937+21 (Nicastro et al. 2002), the fastest known millisecond pulsar (1.55 ms). Pulsed emission was detected in the MECS energy (1.6–10 keV) with a significance of 11 at a frequency deviating from that extrapolated from the radio ephemeris by Hz. This discrepancy is consistent with a systematic frequency error characteric for the timing precision of the BeppoSAX clock for observation later than 2000 (Mineo et al. 2003). Figure 5 shows the X-ray pulse profiles for the whole MECS range (top panel) and for two energy sub-intervals 1.6–4 (middle panel) and 4–10 keV (bottom panel). The pulse profile is characterized by a double peak with a phase separation of . The significance of the second peak, first detected by BeppoSAX, is about 5 . The comparison of the middle and bottom panels in Figure 5, indicates a hint for variations in the ratio of the two peaks. The unpulsed level determined by applying the bootstrap method and the background level derived from a spatial analysis are also shown in Figure 6. The DC level is compatible with the background level implying that the source is consistent with being 100% pulsed.
The pulsed emission was modeled by an absorbed power law with a photon index of 1.660.07 and of cm-2. The absorbed flux (2–10 keV) is erg cm-2 s-1 implying a luminosity of ( kpc)2 erg s-1 and an X-ray efficiency of .
7 PSR B1821-24
PSR B182124 is an isolated millisecond radio pulsar discovered in the core of the globular cluster M28 (Lyne et al. 1987) with high spin-down luminosity (=2.21036 erg s-1). It has a spin down period of P=3.05 ms and the dipolar magnetic field component at the star surface is B=2.2109 G. A marginal detection of X-ray pulsation was first reported by Danner, Kulkarni and Thorsett (1994) from a ROSAT (PSPC) observation. A more significant detection was performed by ASCA (Saito et al. 1997). The pulse profile is characterized by a double peak with a phase separation of about 0.44. RXTE and Chandra observations allowed to aligned the narrower X-ray peak to one of the radio peak (Rots et al. 1998; Rutledge et al. 2003). Moreover, Chandra data provided detailed spectral results on the pulsed emission (Becker et al. 2002).
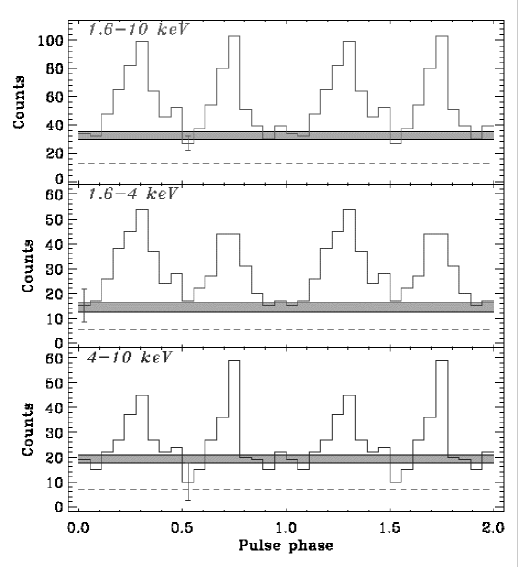
BeppoSAX observation of PSR B1821-24 has provided more accurate information on the timing and spectral properties of the pulsar. The pulsation in the MECS range (1.6 – 10 keV) was detected at high significance level (15 ) at a frequency in agreement with the radio ephemeris within the systematic deviation of the onboard clock (Mineo et al. 2003). Figure 6 shows the X-ray pulse profile in the total MECS range (top panel) and in two energy sub-intervals 1.6–4 (middle panel) and 4–10 keV (bottom panel). The shaded areas indicate the DC level (), while the dashed lines indicate the background level. Note that the DC level shown in the figure includes the contribution of the M28 globular cluster in which the pulsar is located. Also for this millisecond the pulse profile is characterized by a double peak structure with phase separation of 0.450.03. A hint for variation in the ratio of the two peaks with energy can be inferred comparing the middle panel with the bottom panel of Figure 6.
The pulsed emission is well modeled with a power–law, absorbed at low energy by the galactic column density with NH of 2.81020 cm-2 and spectral index of 1.450.21. The unabsorbed (2–10 keV) pulsed X-ray flux is 3.910-13 erg cm-2 s-1 implying a luminosity of erg s-1.
8 CONCLUSION
On the basis of high quality BeppoSAX data, covering nearly three orders of magnitude in energy (0.1-300 keV) we have showed that the energy spectra of the most intense Crab-like pulsars can not be described by a single power lawn shape, but they show a significant steepening towards higher energies. In fact, modeling the spectra of Crab, finely selected in phase, with a simple power law we obtained photon indices significantly increasing with the energy window of the NFIs. A similar result was also obtained for PSR B1509-58. Broad band spectra of three phase intervals of the Crab light curve (P1,P2 and IP) and of the pulsed emission of PSR B1509-58 can be well modeled by a curved power law, Eq. (1), characterized by a continuously bending of the spectral energy distribution. Recently, De Plaa et al. (2003) found, analyzing a set of RXTE observations, that PSR B0540-69 shows a similar spectral behaviour. The parameter, representing the curvature of the spectral distribution, has been found to be similar, equal 0.15 for all spectra. We stress that this new result has been obtained just thanks to the broad band capability of BeppoSAX and the excellent inter-calibration among the 4 Instruments.
Such curved spectra suggest the existence of a possible characteristic energy, for instance the peak of the Spectral Energy Distribution (SED). In the scenario of the outer gap model (Cheng et al. 1986a, 1986b) the energy of the maximum of the SED could be easily related, at least for this three Crab-like pulsars, by a simple scaling law to some observable pulsar parameters as the period and its first derivative (Cusumano et al. 2001):
where the index C refers to the Crab values. The maximum of the SED has been calculated for the Crab to be 14 keV and 200 keV for the P1 and Ip region, respectively, for PSRB1509-58 a higher value around 5 MeV (Cusumano et al 2001), and for PSR B0540-69 the maximum is located around 170 keV.
The above scaling relation of the energy of the maximum of the SED of PSR B1509-58 and PSR B0540-69 with respect the maximum for the Crab matches quite well when the spectrum of the Crab interpeak region is considered, while it is about one order of magnitude lower for that of the first peak of Crab. This suggests a similar mechanism of energy production for the X-ray emission of the PSR B1509-58, PSR B0540-69 and for the Crab interpeak component that correspond to the second component of the light curve in the model proposed by Massaro et al. (2000).
Pulsed emission has been detected in the range 1.6-10 keV for the 3 millisecond pulsars. All detected light curves have double peak profiles with high pulsed fraction and with a phase separation of about 0.5. PSR J0218+4232 shows spectral variation with phase: the relative intensity of the two peaks varies with energy with a behaviour that strongly recalls the Crab pulsar. Similar behaviour seems also present in the other two milliseconds (PSR B1937+21 and PSR B1821-24), although it needs to be confirmed with future more significant data set. The pulsed emission of these milliseconds is modeled by a flat power law indicating a likely non-thermal emission. The X-ray profile morphology and the hard non-thermal spectra suggest a similar magnetospheric origin of the high-energy emission of these millisecond pulsars and the Crab. The comparison with Crab is additionally enforced by the similar values of the magnetic field at the light cylinder as already pointed out by Kuiper et al. (1998) and Kawai and Saito (1999): the magnetic field strength of PSR J0218+4232, PSR B1821-243 and PSR B1937+21 is in the range of 3 and 10 105 Gauss, and that of the Crab is 9 105 Gauss. On the other hand, the magnetic field strength at the neutron star surface of the millisecond pulsars is more than 4 order of magnitude weaker than the Crab one.
The similar value of seen in these millisecond pulsars and in the Crab suggest that the magnetic field strength near the light cylinder is a key parameter to explain their high energy emission, indicating as likely model for the high energy emission the outer gap model. However, the polar cap scenario can also account for high-energy emission from these milliseconds pulsars (Luo, Shibata and Melrose 2000; Dyks and Rudak 2002).
ACKNOWLEDGEMENTS
I am grateful to T. Mineo, E. Massaro and L. Nicastro for their useful comments and their help for preparing this paper. The author is very grateful to the referee, W. Hermsen, for the comments and suggestions that improved the paper.
REFERENCES
- (1)
- (2) Backer D.C., et al., A millisecond pulsar, Nature, 300, 615-618, 1982.
- (3) Becker, W., Swart, D.A., Pavlov, G.G., et al., astro-ph/0211468, 2002.
- (4) Boella, G., Butler, R. C., Perola, G. C., et al., BeppoSAX: the wide band mission for X-ray astronomy, Astron. Astrophys. , 122, 299-307, 1997.
- (5) Bradt, H., Rappaport, S., Mayer, W., et al., Nature,222, 728, 1969.
- (6) Cheng K.S., Ho C., Ruderman M., Energetic radiation from rapidly spinning pulsars. I - Outer magnetosphere gaps. II - VELA and Crab, Astrophys. J., 300, 500-539, 1986a.
- (7) Cheng, K. S., Ho, C., Ruderman, M., Energetic Radiation from Rapidly Spinning Pulsars. II. VELA and Crab, Astrophys. J., 300, 522-545, 1986b.
- (8) Cusumano, G., Mineo, T., Massaro, E., et al., The curved X-ray spectrum of PSR B1509-58 observed with BeppoSAX, Astron. Astrophys., 375, 397-404, 2001.
- (9) Cusumano, G., Massaro, E.,Mineo, T., Astron. Astrophys., in press, 2003.
- (10) Danner R., Kulkarni S.R., Thorsett S.E. ., ROSAT observations of six millisecond pulsars, Astrophys. J. Letters, 436, L153-L156, 1994.
- (11) Deeter, J. E., Nagase, F., Boyton, P. E., Further GINGA Observations of PSR B0540-69, Astrophys. J., 512, 300-312, 1998.
- (12) Dyks, J., Rudak B., Astro-ph, 0205222, 2002.
- (13) Fritz, G., Henry, R.C., Meekins, J.F., et al., Sci, 164, 709, 1969.
- (14) Greiveldinger, G., Caucino, S., Massaglia, S., Ogelman, H., Trussoni, E., PSR 1509-58 and Its Plerionic Environment, Astrophys. J., 454, 855-861, 1995.
- (15) Gunji, S., Hirayama, M., Kamae, T. et al., Observation of pulsed hard X-rays/gamma-rays from PSR 1509-58, Astrophys. J., 428,284-291, 1994.
- (16) Harnden, F.R., Jr., Seward, F.D., Einstein observations of the Crab nebula pulsar, Astrophys. J., 283,279-285, 1984.
- (17) Kawai, N., Okayasu, R., Sekimoto, Y., in AIP Conf Proc. 280, Proc. Workshop Compton Observatory, ed. M. Friedlander, N. Gehrels, & D.J. Macomb (New York), 353, 1992.
- (18) Kawai, N., Saito Y., Non-Thermal X-Ray Emission of Pulsars, Astrophys. Lett. Comm., 38, 1, 1999.
- (19) Kuiper, L., Hermsen W., Verbunt F., et al., Detection of pulsed X-ray emission from the binary millisecond pulsar PSR J0218+4232, Astron. Astrophys., 336, 545-552, 1998.
- (20) Kuiper, L., Hermsen, W., Krijger, J. M., et al., COMPTEL detection of pulsed gamma -ray emission from PSR B1509-58 up to at least 10 MeV, Astron. Astrophys., 351 , 119-132, 1999.
- (21) Kuiper L., Hermsen, W., Verbunt, F., et al., The likely detection of pulsed high-energy gamma -ray emission from millisecond pulsar PSR J0218+4232, Astron. Astrophys., 359 615-626, 2000.
- (22) Kuiper, L., Hermsen, W., Cusumano, G., The Crab pulsar in the 0.75-30 MeV range as seen by CGRO COMPTEL. A coherent high-energy picture from soft X-rays up to high-energy gamma-rays, Astron. Astrophys., 378, 918-935, 2001.
- (23) Kuiper L., Hermsen, W., Verbunt, F., et al., High-Resolution Spatial and Timing Observations of Millisecond Pulsar PSR J0218+4232 with Chandra, Astrophys. J., 577, 917-202, 2002.
- (24) Laurent, P., Paul, J., Claret, A. et al., Astron. Astrophys., 286, 838-840, 1994.
- (25) Lyne A.G., Brinklow, A., Middleditch, J., Kulkarni, S. R., Backer, D. C., et al., The discovery of a millisecond pulsar in the globular cluster M28, Nature, 328, 399-401, 1987.
- (26) Luo, Q., Shibata, S., Melrose, D. B., High-energy emission from millisecond pulsars: polar cap models, Monthly Notices of the Royal Astron. Soc., 318, 943-951, 2000.
- (27) Manchester, R.W., Tuohy, I.R., D’Amico, N., Discovery of radio pulsations from the X-ray pulsar in the supernova remnant G320.4-1.2, Astrophys. J. Letters, 262, L31-L33, 1982.
- (28) Manchester, R. N., Peterson, B. A., A braking index for PSR 0540-69, Astrophys. J. Letters, 342, L23-L25, 1989.
- (29) Manchester, R.N., Mar, D.P., Lyne, A.G., Kaspi, V.M., Johnston, S., Radio detection of PSR B0540-69, Astrophys. J. Letters, 403, L29-L31 , 1993.
- (30) Marsden, D., Blanco, P. R., Gruber, D. E., et al., The X-Ray Spectrum of the Plerionic System PSR B150958/MSH 1552, Astrophys. J. Letters, 491, L39-41, 1997.
- (31) Massaro, E., Cusumano, G. and Mineo, T., Fine phase resolved spectroscopy of the X-ray emission of the Crab pulsar (PSR B0531+21) observed with BeppoSAX, Astron. Astrophys., 361 , 695-703, 2000.
- (32) Matz, S. M. Ulmer, M. P., Grabelsky, D. A., et al., The pulsed hard X-ray spectrum of PSR B1509-58, Astrophys. J., 434, 288-291, 1994.
- (33) Middleditch, J., Pennypacker, C.R, Optical pulsations in the large Magellanic Cloud remnant 0540-69.3, Nature, 313, 659-661, 1985.
- (34) Mineo, T., Cusumano G.,Massaro, E., Nicastro, L., Parmar, A. N., Sacco, B., Timing and spectral properties of PSR B0540-69 observed with BeppoSAX, Astron. Astrophys., 348, 519-523, 1999.
- (35) Mineo, T., Cusumano G., Kuiper L., et al., The pulse shape and spectrum of the millisecond pulsar PSR J0218+4232 in the energy band 1-10 keV observed with BeppoSAX, Astron. Astrophys., 355, 1053-1059, 2000.
- (36) Mineo, T., Cusumano, G., Massaro, E., private communication, 2003.
- (37) Nagase, F., Deeter, J., Lewis, W., Donati, T., Makino, K., Mitsuda, K., GINGA observations of the 50 millisecond pulsar PSR 0540 - 69, Astrophys. J. Letters, 351, L13-L13, 1990.
- (38) Navarro J., de Bruyn A.G., Frail D.A., Kulkarni S.R., Lyne A.G., A Very Luminous Binary Millisecond Pulsar, Astrophys. J. Letters, 455, L55-L58, 1995.
- (39) Nicastro, L., Cusumano, G., Kuiper, L., et al., The 2-10 keV emission properties of PSR B1937+21, Proceedings of the Seminar on Neutron Stars, Pulsars and Supernova Remnants, Jan. 21-25, 2002, Physikzentrum Bad Honnef, eds W. Becker, H. Lesch & J. Truemper, 2002.
- (40) Ögelman, H., Hasinger, G., Period measurements of the 50 millisecond pulsar PSR 0540 - 69 with the EXOSAT satellite, Astrophys. J. Letters, 353, L21-L23, 1990.
- (41) de Plaa, J., Kuiper, L., Hermsen, W., Astron. Astrophys., in press, 2003.
- (42) Pravdo, S. H.. Angelini, L., Harding, A. K., X-Ray Spectral Evolution of the Crab Pulse, Astrophys. J., 491, 808-816, 1997.
- (43) Rots, A.H., Jahoda, K., Macom,b D.J. et al., Rossi X-Ray Timing Explorer Absolute Timing Results for the Pulsars B1821-24 and B1509-58, Astrophys. J., 501, 749-760, 1998.
- (44) Rutledge, R. E., Fox, D.W., Kulkarni, S.R., et al., astro-ph/0301453, 2003. Saito, Y., PhD Thesis, 1998.
- (45) Saito Y., Kawai N., Kamae T., Shibata S., Dotani T., Kulkarni S.R., Detection of Magnetospheric X-Ray Pulsation from Millisecond Pulsar PSR B1821-24, Astrophys. J. Letters, 477, L37-L41, 1997.
- (46) Saito, Y., Search for X-ray Pulsation from Millisecond and Gamma-ray Pulsar with ASCA, PhD Thesis, 1998.
- (47) Seward, F.D., Harnden, F.R., A new, fast X-ray pulsar in the supernova remnant MSH 15-52, Astrophys. J. Letters, 256, L45-L47, 1982.
- (48) Seward, F.D, Harnden, F.R., Helfand, D.J., Discovery of a 50 millisecond pulsar in the Large Magellanic Cloud, Astrophys. J. Letters, 287,L19-L22, 1984.
- (49) Swanepoel, J. W. H., de Beer, C. F., Loots, H., Estimation of the Strength of a Periodic Signal from Photon Arrival Times, Astrophys. J., 467, 261, 1996.
- (50) Takahashi M., Shibata, S., Torii, K., et al., Pulsed X-Ray Emission from the Fastest Millisecond Pulsar: PSR B1937+21 with ASCA, Astrophys. J., 554, 316-321, 2001.
- (51) Taylor J.H., Cordes J.M., Pulsar distances and the galactic distribution of free electrons, Astrophys. J., 411, 674-684, 1993.
- (52) Trussoni, E., Brinkmann, W., Ögelman, H. et al., EXOSAT observation of the supernova remnant MSH 15-52, Astron. Astrophys. , 234, 403-409, 1990.
- (53) Ulmer, M. P., Matz, S. M., Wilson, R. B., et al., Gamma-Ray and Radio Observations of PSR B1509-58, Astrophys. J., 417, 738-745, 1993.
- (54) Verbunt, F., Kuiper, L., Belloni, T., et al., High-energy observations of the millisecond pulsar PSR J0218+4232, Astron. Astrophys., 311, 9-12, 1996.
- (55) Wilson, R. B., Finger, M. H., Pendlenton, G. N., et al., Isolated Pulsar, ed. K. A. Van Riper, R. Epstein, C. Ho (Cambridge University), 257, 1993.
- (56)
E-mail adress of G. Cusumano cusumano@pa.iasf.cnr.it