11email: areiners, jschmitt@hs.uni-hamburg.de
Differential rotation in rapidly rotating F-stars ††thanks: Table A1 is only available at the CDS via anonymous ftp to cdsarc.u-strasbg.fr (130.79.125.5) or via http://cdsweb.u-strasbg.fr/Abstract.html ,††thanks: Based on observations collected at the European Southern Observatory, La Silla, 69.D-0015(B)
We obtained high quality spectra of 135 stars of spectral types F and later and derived “overall” broadening functions in selected wavelength regions utilizing a Least Squares Deconvolution (LSD) procedure. Precision values of the projected rotational velocity were derived from the first zero of the Fourier transformed profiles and the shapes of the profiles were analyzed for effects of differential rotation. The broadening profiles of 70 stars rotating faster than km s-1 show no indications of multiplicity nor of spottedness. In those profiles we used the ratio of the first two zeros of the Fourier transform to search for deviations from rigid rotation. In the vast majority the profiles were found to be consistent with rigid rotation. Five stars were found to have flat profiles probably due to cool polar caps, in three stars cuspy profiles were found. Two out of those three cases may be due to extremely rapid rotation seen pole on, only in one case ( km s-1) solar-like differential rotation is the most plausible explanation for the observed profile. These results indicate that the strength of differential rotation diminishes in stars rotating as rapidly as km s-1.
Key Words.:
Stars: rotation – Stars: late-type – Stars: activity – Methods: Data analysis – Line: profiles1 Introduction
A magnetic dynamo is thought to lie at the root of all the activity phenomena observed on the Sun and the stars. Dynamo action requires turbulent velocity fields and – at least for the variety of -dynamos – differential rotation. On the Sun surface differential rotation is readily observed from the relative motion of Sun spots and can be conveniently expressed in the form
| (1) |
where denotes heliographic latitude and the angular rotation speed at the equator. Differential rotation is described by the dimensionless parameter , which can be thought of the difference of the equatorial and polar rotation velocities relative to the equatorial velocity.
The measurement of rather subtle effects of differential rotation for stars is quite difficult. In principle three methods exist to determine differential rotation in stars, first, by identifying individual features on Doppler maps and following their surface migration with time, by studying the rotation law with time, and by studying line profiles obtained from high resolution data with very good signal-to-noise ratio. Using the latter approach, Reiners & Schmitt, (2003) were able to demonstrate the existence of essentially a solar-like differential rotation law in 10 stars out of a sample with 142 objects which were all rotating at intermediate velocities. Note that only 32 stars had symmetric profiles amenable for a sensitive search for differential rotation, and further, in slow rotators the line profile changes caused by differential rotation cannot be disentangled form other line broadening mechanisms, so that the true percentage of differential rotators may in fact be higher.
The -parameter determined by Reiners & Schmitt, (2003) for the 10 stars in their sample indicates solar-like differential rotation. These results were surprising in that they seem to contradict the differential rotation found through star spot migrations in some fast rotators like, e.g., AB Dor (Donati & Collier Cameron, 1997). In those stars the effective is very small and consequently the deviations from rigid rotation are very small. On the other hand, none of the stars investigated by Reiners & Schmitt, (2003) had -values and presumably rotation periods coming close to AB Dor. The line profile analysis performed by Reiners & Schmitt, (2003) can be applied to more rapid rotators and in principle the effects of differential rotation can be detected more easily since they are spread out over the line profile. Yet in practice very rapid rotators pose extreme difficulties since, first, their profiles are very shallow necessitating spectra with very good signal, and second, line blending becomes severe. In solar-like stars rotating with km s-1 or more, no isolated spectral lines can be found and a suitable broadened line profile can only be constructed with a robust deblending algorithm. Such an algorithm has been developed by us and it is the purpose of this paper to apply this algorithm to very rapid rotators, determine their line broadening profiles, search for differential rotation and compare the rotational properties of these rapid rotators to those of the more slowly rotating stars studied by us previously. In Sect. 2 we present our new observations, in Sect. 3 we describe our deconvolution algorithm, and in Sect. 4 we discuss the obtained distorted profiles. New -values are presented in Sect. 5, and our measurements of , the ratios of the zeros of second and first side lobe of the side lobes of the Fourier transformed line profiles, in Sect. 6. The stars with low are individually discussed, a summary of our paper is given in Sect. 7.
2 Observations
| Date | # Objects | Spectrograph | Resolution |
|---|---|---|---|
| 24.02.–05.03.2002 | 69 | Foces | 40 000 |
| 04.04.–05.04.2002 | 70 | Feros | 48 000 |
In our study of rapidly rotating stars we used two spectrographs covering the full optical wavelength region. For the southern hemisphere objects we used Feros at ESO (La Silla, Chile), for the northern hemisphere we used Foces at the DSAZ (Calar Alto, Spain). The resolving power of both spectrographs is and , respectively. Our sample consists of 135 stars of spectral types F and later. Details of the observing runs are listed in Table 1; 69 stars were observed with Foces, 70 stars with Feros, and four objects were observed during both campaigns. We focused on moderately fast rotators with literature values of km s-1 since the resolution of both instruments is sufficient to study such profiles. Nine stars without any published measurements of were observed in addition. To guarantee high quality spectra we observed only stars brighter than mag; all spectra have signal-to-noise ratios in excess of 300.
3 The deconvolution process
Spectral lines of fast rotating F-type stars are severely blended, the optical spectrum of an F-type star with 40 km s-1 contains hardly a single isolated absorption line. Thus we did not use single absorption lines, but rather derived an “overall” broadening function in a Least Squares Deconvolution process. Our data cover the wavelength region between 3800 and 8200 Å. Substantial parts of the observed spectral region are not useful for deriving information about stellar rotation since light-ion lines of hydrogen or helium are pressure dominated, and further, large spectral regions and the strong lines of Ca or Na are contaminated or even dominated by telluric features. Thus we searched for spectral regions with a significant number of rotationally dominated adequately spaced lines.
| # | Wavelength region | coverage | approx. # of lines |
|---|---|---|---|
| 1 | 5440 – 5880 Å | 440 Å | 300 |
| 2 | 6040 – 6270 Å | 230 Å | 150 |
| 3 | 6330 – 6450 Å | 120 Å | 50 |
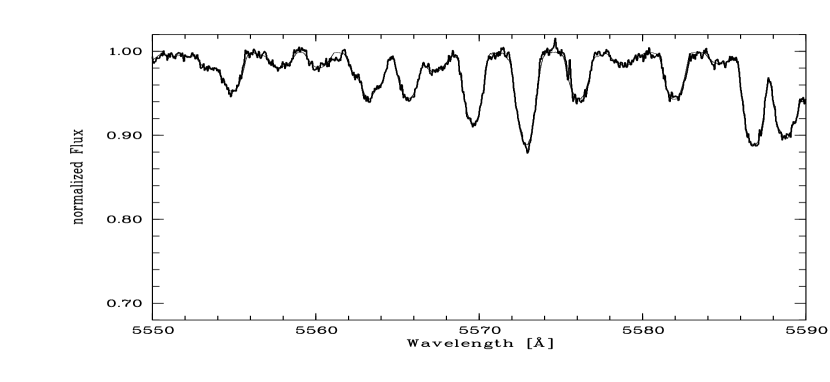
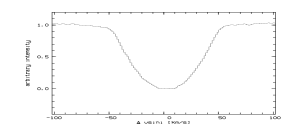
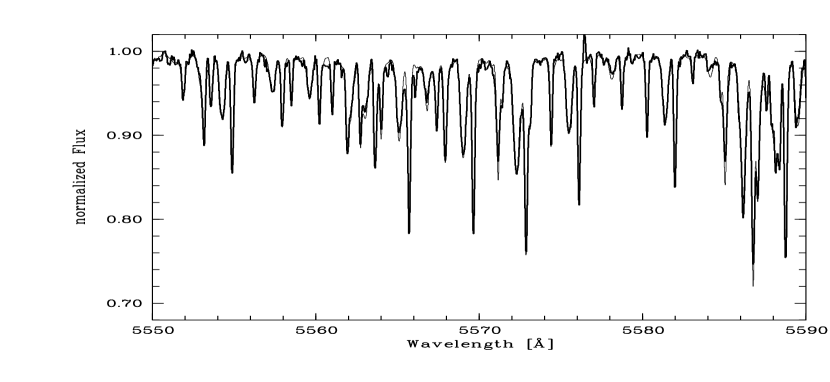
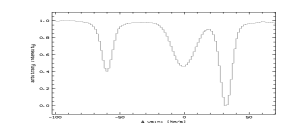
We identified three such wavelength regions given in Table 2 and derived broadening profiles in each region independently. Since the theoretical line depths match the observational ones only poorly, the equivalent widths of the incorporated lines were optimized as well. The iterative procedure was started by constructing a delta-template according to stellar temperature and atomic data taken from the Vienna Atomic Line Database (Kupka et al., 1999). A first-guess broadening profile with each pixel as a free parameter was deconvolved from the spectrum leaving the template at first fixed. In a second step the equivalent widths of the template were optimized without changing the broadening profile. For the construction of the broadening profile a flat continuum normalization of the spectrum obtained by eye was used. After the first iteration of the line broadening profile and template a continuum correction was determined by allowing the continuum to vary as a smooth spline and yield best agreement between the preliminary fit and observed spectrum. These continuum corrections are typically very small (). With the improved continuum estimate the broadening profile and the equivalent widths were further optimized iteratively. No addtional continuum corrections were found to be necessary. Using this technique the spectral lines are effectively deblended, the information contained in all spectral lines is used and the signal-to-noise ratio is significantly enhanced. The consistency of the final fit is checked by comparing theoretical line depths to the derived ones. To demonstrate the quality of our fits we show in Figs. 2 and 2 our model spectrum (thin lines) in comparison to the data (thick lines) in a small wavelength region for two examples (HD 70 958, HD 118 261). The derived profiles are shown in the insets. HD 70 958 (Figs 2) is a typical fast rotator in our sample, the crowded spectrum of HD 118 261 (Fig. 2) turns out to be produced by a spectroscopic triple.
| Feros spectra | Foces spectra | |||
|---|---|---|---|---|
| HD | ||||
| 103 313 | ||||
| 124 425 | ||||
| 125 451 | ||||
| 147 449 | ||||
For the sake of homogeneity we used the broadening profiles deconvolved from region 1 in Table 2 for our analysis. This region contains more lines than all others and the deconvolution process turned out to be more robust than in the regions containing fewer lines. We did compare the profiles derived from regions 2 and 3 to those derived from region 1 and found them to be fully consistent whenever profiles could be derived from regions 2 and 3. This of course implies that the zeros of the Fourier transforms used in the following are consistent, too. Note, however, that in a few cases of very rapid rotators no convergent solutions could be derived from regions 2 and 3.
Four target stars were observed during both observing campaigns and broadening profiles were independently derived for them. Consistent profiles could be found for all data sets. Independently derived results discussed in the following sections are given in Table 3.
4 Distorted profiles
The high quality of the derived line profiles allows us to directly identify the mechanisms influencing the shape of absorption lines. Binaries and even triples (cf., Fig. 2) can be found as long as the spectral types do not differ too much. The broadening profile of a (differentially) rotating single star is expected to be symmetric; asymmetric velocity fields such as turbulent flows are at least an order of magnitude smaller than the rotational effects studied in this work. Therefore significantly asymmetric profiles must be due to other mechanisms such as multiplicity or spottedness.
Among our sample of 135 stars we found two profiles with three clearly isolated components – one of them is shown in Fig. 2. Three spectroscopic binaries with separated components were found. 16 profiles are likely due to double or triple systems with blended profiles of the different components. All multiple stars are listed in Table 4 with the values of of their components derived as described in Sect. 5.
| HD | |||
| [km s-1] | [km s-1] | [km s-1] | |
| triples with separated components | |||
| 58728 | |||
| 118261 | |||
| doubles with separated components | |||
| 99453 | |||
| 114371 | |||
| 177171 | |||
| doubles or triples with blended components | |||
| 12230 | |||
| 27176 | |||
| 28052 | |||
| 50635 | |||
| 51733 | |||
| 65925 | |||
| 80671 | |||
| 82434 | |||
| 87500 | |||
| 89025 | |||
| 109585 | |||
| 113139 | |||
| 114435 | |||
| 125442 | |||
| 144415 | |||
| 153580 | |||
Unlike the multiple stars listed in Table 4, 23 clearly asymmetric profiles were found which are obviously not due to multiple components. These profile asymmetries might be caused by star spots or pulsations. In Fig. 7 these stars are plotted with crosses in an HR-diagram, and we will discuss this diagram in Sect. 7. A shape flag is given to the profiles in the last column of Table 6.
5 New values of v sini
The projected rotational velocity was measured from the first zero of the Fourier transform. The error of directly depends on the quality of the deconvolved profile and on the precision of a determination of . In most cases this intrinsic precision is of the order of 1 km s-1. The reliability of the deconvolved profiles was tested with synthetic data. Our tests showed that the systematic errors of the determined values of induced by the deconvolution process are always less than . In Table 6 we list our the results; as effective error we adopted the maximum of the error of determining and of deconvolving the profile (5 %).
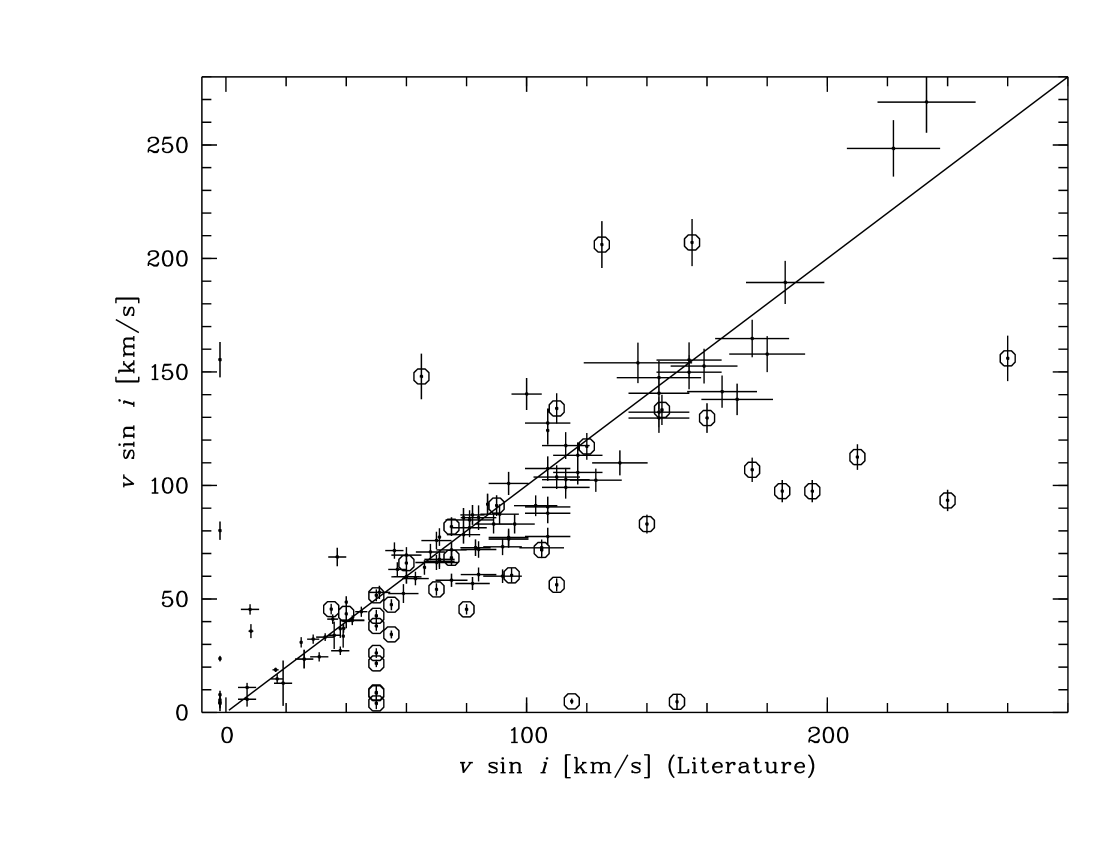
A comparison of our results with data from the literature is presented in Fig. 3. Literature values are taken from the comprehensive catalog of Głȩbocki et al., (2000) and from Royer et al., (2002). Values only found in the catalog of Uesugi & Fukuda, (1982) – which is contained in Głȩbocki et al., (2000) – are indicated with open circles. For nine of our 135 objects no measurements of are reported in Głȩbocki et al., (2000) nor are contained in Royer et al., (2002). These values are plotted at km s-1 in Fig. 3. While the consistency of our results with measurements made by other authors is quite good, the values taken from Uesugi & Fukuda, (1982) show very large discrepancies and cannot be considered reliable. The projected rotational velocities of 37 stars are only reported in Uesugi & Fukuda, (1982) and we suggest to use our redetermined values.
6 The profile’s shape and the value of
| No. | HD | Type | |||||||
| (Fig. 4) | [K] | [mag] | [km s-1] | [km s-1] | |||||
| 1 | 67483 | F3V | 6209 | 2.07 | (580) | (5°) | |||
| 2 | 182640 | F1IV-V | 7016 | 2.46 | 380 | 13° | |||
| 3 | 82554 | F3IV | 6272 | 1.32 | 435 | 17° | |||
| 4 | 55892 | F0IV | 6802 | 2.37 | variable star | ||||
| 5 | 90589 | F2IV | 6794 | 2.95 | variable star | ||||
| 6 | 106022 | F5V | 6651 | 2.28 | star in double system | ||||
| 7 | 138917 | F0IV | 7442 | 1.53 | star in double system | ||||
| 8 | 175813 | F2V | 6659 | 1.99 | W UMa type star | ||||
The shape of a rotationally broadened line profile can conveniently be described in Fourier space. The zeros of a Fourier transformed line profile contain information on the projected rotational velocity , and differential rotation. Specifically, Reiners & Schmitt, (2002) show that the ratio of the second and the first zeros is a reliable observable of solar-like differential rotation. Regardless of the value of the limb darkening coefficient , the ratio always stays between 1.72 and 1.83 in a rigidly rotating star with a linear limb darkening law, and one finds for a limb darkening coefficient of . Solar-like differential rotation with the equator rotating faster than the pole diminishes the ratio , and values of are found in stars with solar-like differential rotation stronger than 10 % (i.e., in Eq. 1).
In order to measure the ratio the data quality must allow to follow the Fourier transformed broadening profile to at least the second sidelobe to obtain a reliable measurement of the second zero . For our data this is the case for all symmetric profiles of stars rotating faster than km s-1. In 21 cases our new determinations of yielded values lower than this threshold; note that ten of these stars were supposed to rotate faster according to Uesugi & Fukuda, (1982).
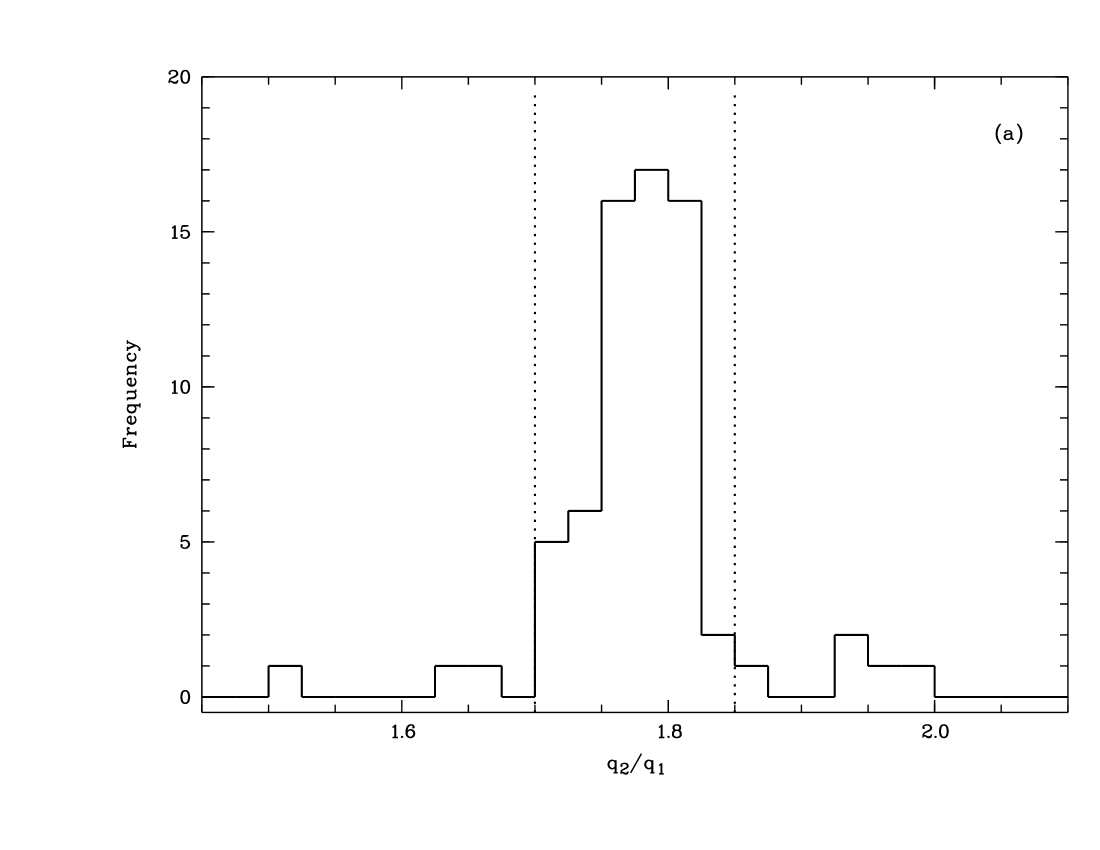
Disregarding the 44 distorted profiles and 21 profiles of stars rotating too slowly, we were able to measure the ratio for 70 of our sample stars. A histogram of the distribution of among these 70 targets is shown in Fig. 4a. For 62 stars (89 %) the values of are consistent with solid body rotation, five stars (7 %) have values of and for three cases (4 %) was found; in one of these three cases (HD 82 554) the measured -ratio is consistent with solid body rotation to within the 1- errors.
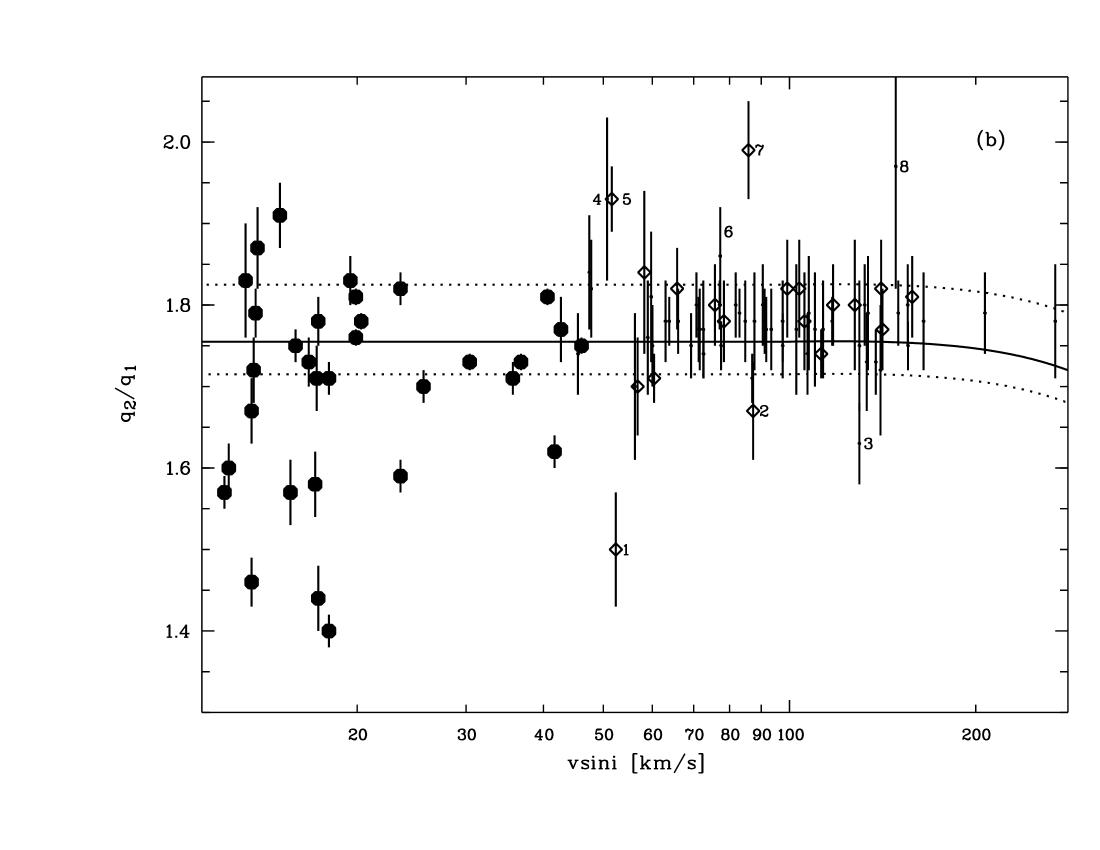
In Fig. 4b we plot the values of vs. together with results from Reiners & Schmitt, (2003). The solid line indicates the value expected for rigid rotators with a linear limb darkening parameter , dashed lines mark the region calculated for extreme limb darkening and . Since the limb darkening law is only poorly known over the whole spectral region, values between the dashed lines are considered consistent with solid body rotation. Note that according to Reiners, (2003) values of are expected for very fast rotators; this is the cause for the bending of the solid and dashed lines for high -values (Fig. 4), which will be further discussed in Sect. 6.2. The stars with values of outside the region marked by the dashed lines and significantly different from 1.76 are indicated with numbers in Fig. 4b and are given in Table 5, they are discussed in the following.
6.1 Stars with large values of
Stars with a value of have trough-like profiles flattened in the center. Slowly rotating surface elements are apparently emitting less flux than expected. This could be either due to surface elements with small projected velocities emitting less flux or very few surface elements rotating that slowly. According to Reiners & Schmitt, (2002, 2003) this is possible in cases of cool polar spots or anti solar-like differential rotation with the pole rotating faster than the equator. Since no evidence exists for the latter, cool polar caps are considered the most probable explanation for the five stars with . Each of these stars is either a member of a double system or classified as variable in the literature as given in Table 5. We suspect that additional mechanisms influence the surface structure of these stars, but a more detailed discussion goes beyond the scope of this paper.
6.2 Stars with small values of
Three of the 70 stars of our sample have values significantly smaller than . Solar-like differential rotation is the only mechanism known that sufficiently reduces the value of in slow rotators. The strength of differential rotation in terms of in Eq. 1 can be calculated from the ratio , and Reiners & Schmitt, (2003) derived differential rotation in ten F-type stars with values of km s-1.
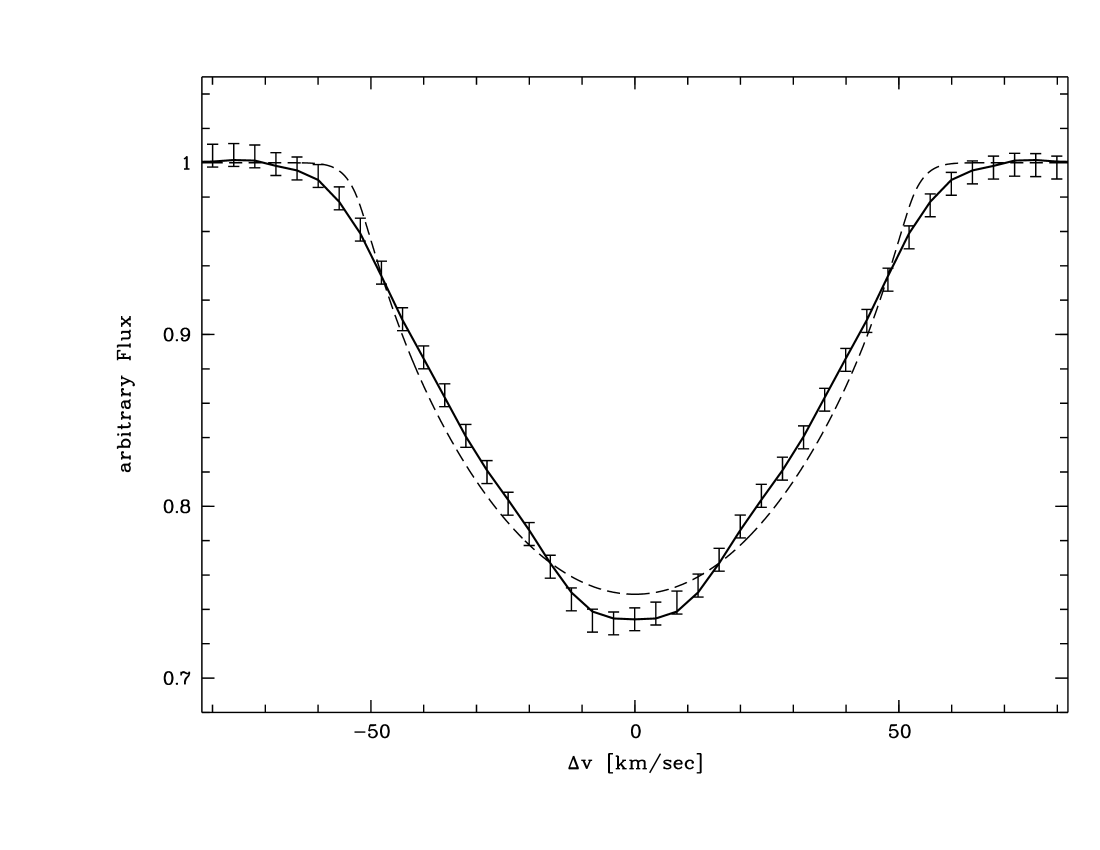
Reiners, (2003) shows that gravitational darkening can also diminish the value of in very rapidly rotating stars. In that case the reduction in depends on the equatorial velocity , rather than the projected velocity . Thus for extremely rapid rotators (perhaps viewed under small inclination angles), values of are possible even for rigid rotation. Assuming that the derived broadening profile is not dominated by the intrinsic variations of the local profiles due to temperature and gravity, it is possible to calculate from the value of (cf Reiners, 2003). The required values of differential rotation and, following the idea of very rapid solid body rotation, equatorial velocity and inclination angle are calculated for the three candidates. The results are given in Table 5. The small ratios of HD 82 554 and HD 182 640 may thus be due to very rapid solid body rotation, but the equatorial velocity calculated for the profile of HD 67 483 is larger than break up velocity. Therefore differential rotation is the most probable explanation for the peculiar shape of the line profiles of HD 67 483. In Fig. 5 the profile of HD 67 483 is shown.
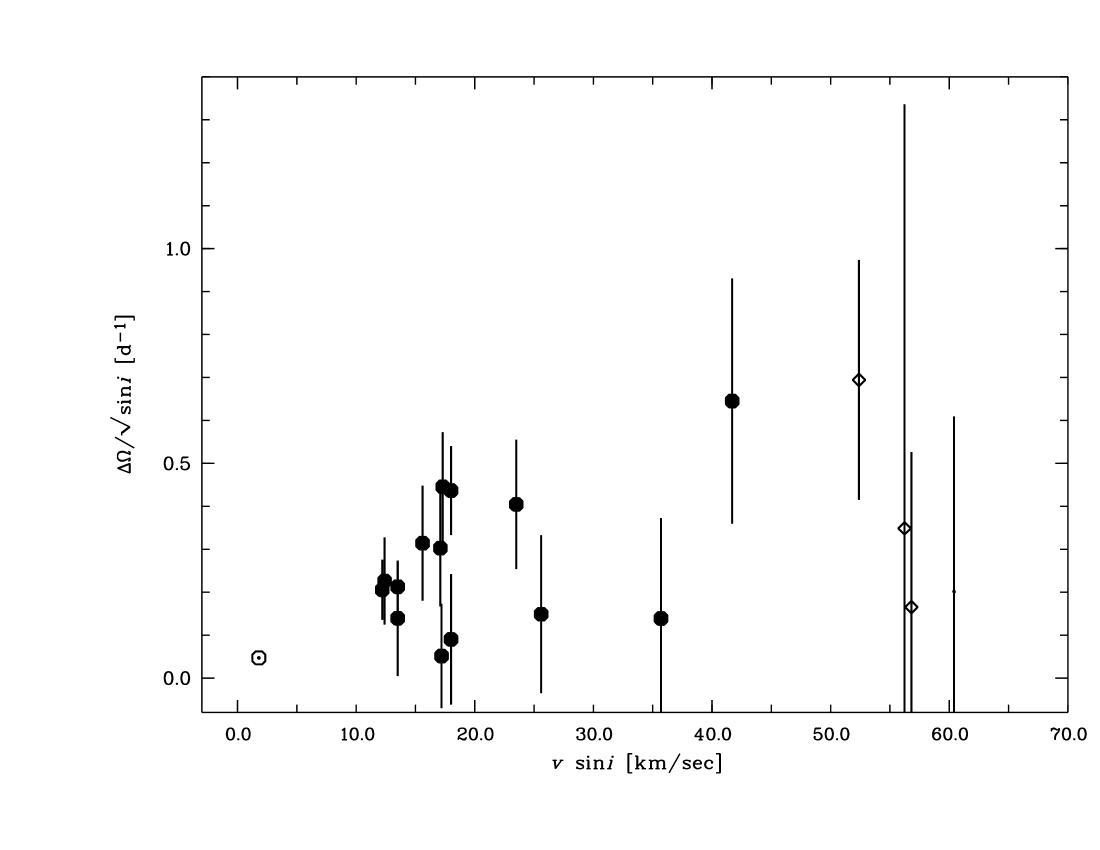
In Fig. 6 we show the beat frequency between equator and pole vs. for those stars with detected signatures of differential rotation; we also included more slowly rotating stars discussed by Reiners & Schmitt, (2003), the value of solar differential rotation has also been included. Fig. 6 suggests an increase in beat frequency up to rotational velocities of about 40 km s-1 followed by a sharp decrease in for higher velocities. Note that this latter interpretation depends on the interpretation of the two stars HD 82 554 and HD 182 640 as solid body vs. differential rotators. If the derived values of are due to differential rotation rather gravitational darkening, similar beat frequencies of about would be found for these two extremely rapid rotators.
6.3 Location in the HR-diagram
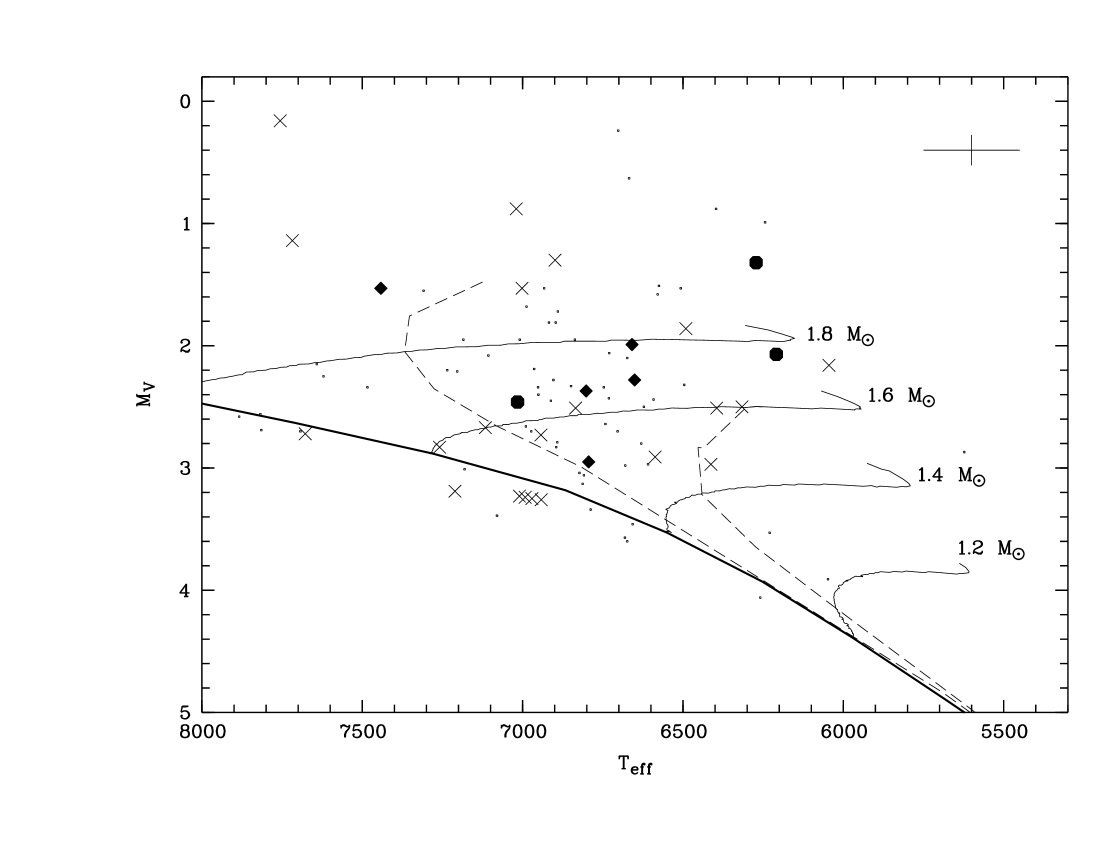
In Fig. 7 all suspected single stars in our sample are plotted in an HR-diagram with different symbols depicting their profile shapes’ as explained in the caption. Values and are calculated from photometry using the program UVBYBETA published by Moon, (1985); data are taken from Hauck & Mermilliod, (1998). For a new calibration by Napiwotzki et al., (1993) based on the grids of Moon & Dworetsky, (1985) was used, the statistical error of the temperature determination is about K, typical error bars are plotted in Fig. 7. The zero-age main sequence and evolutionary tracks according to Siess et al., (2000) are also shown. Fig. 7 shows that no significant difference exists between the distribution of the stars with different profile shapes. “Regular” broadening profiles, peculiar profiles and extremely flat or cuspy shaped profiles do not show concentrations in any area of the HR-diagram.
7 Summary
We performed high-resolution spectroscopy for a sample of 135 stars of spectral types F and later, focusing on fast rotators with values of km s-1. Using a Least Squares Deconvolution method “overall” broadening profiles were derived in a dedicated spectral region containing typically about 300 absorption lines. Broadening profiles were derived in two wavelength regions for comparison, good consistency was found. We determined the values of from the first zeros of the Fourier transformed broadening profiles. For nine stars no previous measurements were reported in the literature, for 37 stars our measurements are far more reliable than the previously reported measurements listed in catalog of Uesugi & Fukuda, (1982).
The shape of the broadening profiles were scrutinized in wavelength space. We found three profiles with separated spectroscopic binaries, two spectra with separated spectroscopic triples and 21 profiles that are likely a sum of two (or possibly three) profiles indicating a binary (or triple) system. For 23 stars peculiar and strongly asymmetric profiles were found, probably caused by spots or pulsations.
21 stars were found to have projected rotational velocities of km s-1; for those stars the spectral resolution was insufficient to follow their Fourier transforms to the second zero . For the remaining 70 stars the first two zeros of the Fourier transforms could be measured and the ratio was used as a reliable tracer of the profile shapes’. The vast majority of these stars (89 %) were found to have profiles consistent with the assumption of a rigidly rotating unspotted surface. Five stars (7 %) have flattened profiles likely due to polar spots (or even anti solar-like differential rotation), all of them are cited as multiples or variables in the literature.
Three stars show cuspy broadening profiles inconsistent with solid body rotation ( indicating solar-like differential rotation. Alternatively, in the cases of HD 82 554 and HD 182 640 very rapid rotation viewed under small inclination angles may be the mechanism causing the peculiar shape. Thus the comparably small deviation from the classical shape does not necessarily require differential rotation. However, for the case of HD 67 483 the measured -value of the profile () would require a rotational velocity much larger than break-up velocity to be consistent with solid body rotation. Therefore, differential rotation with a value of is the most probable explanation for the observed line profile.
Considering HD 82 554 and HD 182 640 as rigid rotators (note that for them differential rotation with is possible but not necessary), only one star with unambiguous indications for solar-like differential rotation stronger than was found in the sample. Reiners & Schmitt, (2003) found ten stars with indications of significant solar-like differential rotation in their sample of 32 “slow” rotators ( km s-1). Thus regardless of whether HD 82 554 and HD 182 640 are treated as solid of differential rotators we conclude that solar-like differential rotation in terms of diminishes in rapidly rotating stars. With a rotational period of d as derived from and with , the equator laps the pole once every 5.7 d in HD 67 483 (in the Sun this is the case about every 130 d). The results derived from our sample show this is to be one of the most extreme cases of stellar differential rotation possible (if HD 82 554 and HD 182 640 are differential rotators their lap time is larger than nine days).
We conclude that in F-type stars strong differential rotation with seems to be a common phenomenon in slow rotators ( km s-1) but untypical in the more rapid ones. In that sense our results are consistent with those from Doppler Imaging studies claiming values less for some very rapid rotators (e.g., Donati & Collier Cameron, 1997).
Acknowledgements.
A.R. acknowledges financial support from Deutsche Forschungsgemeinschaft DFG-SCHM 1032/10-1. This work has made extensive use of the SIMBAD database at CDS.We thank our anonymous referee for a very helpful report taking less than a typical rotation period of our rapidly rotating stars.
References
- Donati & Collier Cameron, (1997) Donati J.-F., Collier Cameron A., 1997, MNRAS 291, 1
- Głȩbocki et al., (2000) Głȩbocki R., & Stawikowski A. 2000, Acta Astron., 50, 509
- Hauck & Mermilliod, (1998) Hauck B., & Mermilliod M., 1998, A&AS, 129, 431
- Hoffleit & Warren, (1991) Hoffleit E.D., & Warren Jr. W.H., 1991, The Bright Star Catalogue, 5th Revised Ed.
- Kupka et al., (1999) Kupka, F., Piskunov, N.E., Ryabchikova, T.A., Stempels, H.C., & Weiss, W.W., 1999, A&AS, 138, 119
- Moon, (1985) Moon T.T., 1985, Comm. Univ. London Obs. 78
- Moon & Dworetsky, (1985) Moon T.T., & Dworetsky M.M., 1985, MNRAS, 217, 305
- Napiwotzki et al., (1993) Napiwotzki R., Schönberger D., & Wenske V., 1993, A&A, 268, 653
- Reiners & Schmitt, (2002) Reiners, A., & Schmitt, J.H.M.M., 2002, A&A, 384, 555
- Reiners & Schmitt, (2003) Reiners, A., & Schmitt, J.H.M.M., 2003, A&A, 398, 647
- Reiners, (2003) Reiners, A., 2003, accepted by A&A
- Royer et al., (2002) Royer F., Grenier S., Baylac M.-O., Gomez A.E., & Zorec J., 2002, A&A 393, 897
- Siess et al., (2000) Siess L., Dufour E., & Forestini M., 2000, A&A, 358, 593
- Uesugi & Fukuda, (1982) Uesugi A., & Fukuda I., 1982, Revised Catalogue of Rotational Velocities, Department of Astronomy, Kyito Univ., Japan
Appendix A Table of projected rotational velocities.
Shape flags:
b
–
blended multiple (suspected)
s
–
spotted star (suspected)
a
–
asymmetric profile (reason unidentified)
m2
–
multiple with 2 separated components
m3
–
multiple with 3 separated components
c
–
symmetric profile, but candidate for spottedness
| HD | HR | Name | Shape | |||||
|---|---|---|---|---|---|---|---|---|
| [km s-1] | [km s-1] | Flag | ||||||
| 12230 | 581 | 47 Cas | 0.34 | 206.0 | 10.3 | b | ||
| 13480 | 642 | 6 Tri | 0.77 | 35.8 | 3.1 | s | ||
| 15524 | 728 | 0.41 | 59.7 | 3.0 | 1.81 | 0.08 | ||
| 17904 | 855 | 20 Per | 0.42 | 54.2 | 2.7 | a | ||
| 24357 | 1201 | 0.35 | 65.8 | 3.3 | 1.82 | 0.05 | c | |
| 25202 | 1238 | 0.31 | 164.7 | 8.2 | 1.78 | 0.06 | ||
| 25570 | 1254 | 0.37 | 34.3 | 1.7 | ||||
| 25867 | 1269 | 42 | 0.35 | 45.4 | 2.3 | a | ||
| 27176 | 1331 | 51 | 0.27 | 100.8 | 5.0 | b | ||
| 27459 | 1356 | 58 | 0.22 | 78.3 | 3.9 | 1.78 | 0.05 | c |
| 28052 | 1394 | 71 | 0.26 | 248.4 | 12.4 | b | ||
| 28271 | 1406 | 0.54 | 33.2 | 1.7 | a | |||
| 29391 | 1474 | 51 Eri | 0.28 | 71.8 | 3.6 | s | ||
| 29875 | 1502 | Cae | 0.34 | 47.8 | 2.4 | 1.82 | 0.06 | |
| 29992 | 1503 | Cae | 0.39 | 97.5 | 4.9 | 1.75 | 0.04 | |
| 30034 | 1507 | 0.25 | 103.6 | 5.2 | 1.82 | 0.06 | c | |
| 30912 | 1554 | 0.36 | 207.0 | 10.4 | 1.79 | 0.05 | ||
| 32743 | 1649 | 1 c | 0.42 | 21.6 | 1.6 | |||
| 33262 | 1674 | Dor | 0.52 | 14.8 | 2.1 | |||
| 33276 | 1676 | 15 Ori | 0.31 | 59.8 | 3.0 | a | ||
| 37147 | 1905 | 122 | 0.23 | 109.9 | 5.5 | 1.77 | 0.07 | |
| 37495 | 1935 | 2Col | 0.48 | 27.2 | 1.9 | a | ||
| 37788 | 1955 | 0.31 | 32.3 | 2.0 | ||||
| 40292 | 2094 | 0.29 | 38.1 | 2.1 | ||||
| 41074 | 2132 | 39 Aur | 0.35 | 87.7 | 4.4 | 1.78 | 0.06 | |
| 46273 | 2384 | 0.37 | 106.9 | 5.3 | 1.74 | 0.05 | ||
| 48737 | 2484 | 31 Gem | 0.44 | 66.0 | 3.3 | 1.78 | 0.04 | |
| 49434 | 2514 | 0.29 | 85.7 | 4.3 | a | |||
| 50277 | 2551 | 0.27 | 268.8 | 13.4 | 1.78 | 0.07 | ||
| 50635 | 2564 | 38 Gem | 0.32 | 152.5 | 7.6 | b | ||
| 51199 | 2590 | 19 CMa | 0.37 | 91.7 | 4.6 | 1.77 | 0.04 | |
| 51733 | 2607 | 0.39 | 102.3 | 5.1 | b | |||
| 55052 | 2706 | 48 Gem | 0.39 | 81.8 | 4.1 | 1.80 | 0.04 | |
| 55892 | 2740 | 0.32 | 50.7 | 2.5 | 1.93 | 0.10 | ||
| 56986 | 2777 | 55 Gem | 0.37 | 129.7 | 6.5 | 1.75 | 0.08 | |
| 57749 | 2811 | 0.35 | 43.4 | 6.3 | ||||
| 58728 | 2846 | 63 Gem | 0.45 | 30.9 | 2.2 | m3 | ||
| 58946 | 2852 | 62 Gem | 0.32 | 58.9 | 2.9 | 1.76 | 0.07 | |
| 60111 | 2887 | 8 2CMi | 0.32 | 117.5 | 5.9 | 1.80 | 0.05 | c |
| 61110 | 2930 | 71 Gem | 0.41 | 91.1 | 4.6 | 1.78 | 0.04 | |
| 62952 | 3015 | 4 Pup | 0.34 | 127.5 | 6.4 | 1.80 | 0.08 | c |
| 64379 | 3079 | 0.47 | 42.6 | 2.6 | 1.56 | 0.05 | c | |
| 65925 | 3140 | 0.40 | 71.6 | 3.6 | b | |||
| 67483 | 3184 | 12 Cnc | 0.48 | 52.3 | 4.1 | 1.50 | 0.07 | c |
| 70958 | 3297 | 1 Hya | 0.47 | 45.5 | 2.3 | 1.74 | 0.05 | |
| 72943 | 3394 | 0.33 | 56.8 | 2.8 | 1.70 | 0.06 | c | |
| 76143 | 3537 | 0.42 | 83.0 | 4.2 | 1.79 | 0.03 | ||
| 76582 | 3565 | 632Cnc | 0.20 | 90.5 | 4.5 | 1.80 | 0.05 | |
| 77370 | 3598 | 0.41 | 60.4 | 3.0 | 1.71 | 0.03 | c | |
| 79940 | 3684 | 0.47 | 117.2 | 5.9 | 1.78 | 0.03 | ||
| 80671 | 3712 | 0.41 | 26.2 | 2.1 | b | |||
| 81937 | 3757 | 23 UMa | 0.36 | 155.2 | 7.8 | 1.80 | 0.05 | |
| 82434 | 3786 | Vel | 0.37 | 156.0 | 10.0 | b | ||
| 82554 | 3795 | Cha | 0.45 | 129.7 | 6.5 | 1.63 | 0.05 | |
| 83287 | 3829 | 42 Lyn | 0.22 | 102.5 | 5.1 | 1.77 | 0.08 | |
| 83962 | 3859 | 0.41 | 140.3 | 7.0 | 1.72 | 0.08 | ||
| 84999 | 3888 | 29 UMa | 0.29 | 124.2 | 6.2 | s | ||
| 87500 | 3969 | 0.38 | 189.4 | 9.5 | b | |||
| 88215 | 3991 | 0.36 | 97.4 | 4.9 | 1.78 | 0.05 | ||
| 89025 | 4031 | 36 Leo | 0.30 | 81.3 | 4.1 | b |
| HD | HR | Name | Shape | |||||
|---|---|---|---|---|---|---|---|---|
| [km s-1] | [km s-1] | Flag | ||||||
| 89571 | 4062 | 0.24 | 133.9 | 6.7 | 1.79 | 0.07 | ||
| 90089 | 4084 | 0.39 | 56.2 | 2.8 | 1.70 | 0.09 | ||
| 90589 | 4102 | 0.36 | 51.6 | 2.6 | 1.93 | 0.04 | c | |
| 91480 | 4141 | 37 UMa | 0.34 | 36.9 | 4.0 | a | ||
| 92787 | 4191 | 0.32 | 58.2 | 2.9 | 1.84 | 0.10 | c | |
| 96202 | 4314 | 1Hya | 0.36 | 93.4 | 4.7 | 1.77 | 0.05 | |
| 99329 | 4410 | 80 Leo | 0.34 | 137.9 | 6.9 | 1.73 | 0.04 | |
| 99453 | 4413 | 0.49 | 4.9 | 1.2 | m2 | |||
| 100623 | 4458 | 0.81 | 4.0 | 2.2 | a | |||
| 103313 | 4555 | 0.20 | 66.6 | 3.3 | s | |||
| 104731 | 4600 | 0.41 | 11.0 | 2.0 | ||||
| 106022 | 4642 | 0.42 | 77.2 | 3.9 | 1.86 | 0.06 | ||
| 107192 | 4686 | 0.34 | 68.1 | 3.4 | a | |||
| 107326 | 4694 | 0.30 | 132.2 | 6.6 | 1.80 | 0.05 | ||
| 109085 | 4775 | 8 Crv | 0.38 | 60.0 | 3.0 | 1.75 | 0.05 | |
| 109585 | 4797 | 0.34 | 91.1 | 4.6 | b | |||
| 109799 | 4803 | 0.33 | 34.0 | 6.0 | a | |||
| 110834 | 4843 | 0.46 | 133.3 | 6.7 | 1.73 | 0.06 | ||
| 111812 | 4883 | 31 Com | 0.68 | 63.0 | 3.2 | 1.78 | 0.05 | |
| 113139 | 4931 | 78 UMa | 0.36 | 91.7 | 4.6 | b | ||
| 114371 | 4966 | 0.41 | 4.6 | 4.0 | m2 | |||
| 114435 | 4970 | 0.52 | 80.1 | 4.0 | b | |||
| 114837 | 4989 | 0.48 | 8.8 | 3.0 | ||||
| 115810 | 5025 | 0.27 | 99.1 | 5.0 | 1.82 | 0.06 | c | |
| 116568 | 5050 | 66 Vir | 0.41 | 37.0 | 1.9 | |||
| 117360 | 5082 | 0.45 | 4.0 | 2.5 | ||||
| 118261 | 5113 | 0.49 | 4.7 | 3.6 | m3 | |||
| 118889 | 5138 | 0.34 | 140.6 | 7.0 | 1.82 | 0.06 | c | |
| 119756 | 5168 | 1 Cen | 0.39 | 63.9 | 3.2 | 1.78 | 0.03 | |
| 120987 | 5222 | 0.44 | 8.5 | 2.5 | a | |||
| 121932 | 5253 | 0.35 | 155.4 | 7.8 | 1.75 | 0.03 | ||
| 122066 | 5257 | 48 Hya | 0.48 | 41.1 | 2.1 | 1.84 | 0.03 | |
| 122797 | 5275 | 0.40 | 33.6 | 5.0 | a | |||
| 123255 | 5290 | 95 Vir | 0.34 | 157.8 | 7.9 | 1.81 | 0.05 | c |
| 124425 | 5317 | 0.48 | 23.5 | 4.0 | ||||
| 124780 | 5337 | 0.29 | 70.7 | 3.5 | 1.80 | 0.04 | ||
| 125442 | 5364 | 0.31 | 148.0 | 10.0 | b | |||
| 125451 | 5365 | 18 Boo | 0.38 | 40.5 | 2.0 | |||
| 127486 | 5426 | 0.48 | 24.5 | 2.0 | a | |||
| 129153 | 5473 | 0.23 | 105.7 | 5.3 | 1.78 | 0.06 | c | |
| 129926 | 5497 | 54 Hya | 0.31 | 112.5 | 5.6 | 1.74 | 0.03 | c |
| 132052 | 5570 | 16 Lib | 0.31 | 113.2 | 5.7 | 1.77 | 0.06 | |
| 134083 | 5634 | 45 Boo | 0.42 | 44.4 | 2.2 | 1.67 | 0.06 | |
| 137391 | 5733 | 51 1Boo | 0.30 | 83.0 | 4.2 | a | ||
| 138917 | 5788 | 13 Ser | 0.26 | 85.8 | 5.4 | 1.99 | 0.06 | c |
| 139664 | 5825 | 0.41 | 71.6 | 3.6 | 1.77 | 0.05 | ||
| 141544 | 5882 | 1.15 | 4.1 | 2.2 | ||||
| 142908 | 5936 | 12 CrB | 0.35 | 75.7 | 3.8 | 1.80 | 0.05 | c |
| 143466 | 5960 | 0.26 | 141.3 | 7.1 | 1.77 | 0.05 | c | |
| 143790 | 5970 | 0.47 | 5.5 | 3.0 | ||||
| 143928 | 5975 | 0.40 | 23.7 | 1.2 | ||||
| 144415 | 5991 | 0.29 | 7.8 | 1.7 | b | |||
| 146836 | 6077 | 0.46 | 18.8 | 0.9 | ||||
| 147365 | 6091 | 0.41 | 72.5 | 3.6 | 1.77 | 0.06 | ||
| 147449 | 6093 | 50 Ser | 0.33 | 77.1 | 3.9 | 1.80 | 0.03 | |
| 147787 | 6109 | TrA | 0.38 | 12.9 | 10.0 | a | ||
| 148048 | 6116 | 21 UMi | 0.39 | 84.8 | 4.2 | 1.78 | 0.05 | |
| 151613 | 6237 | 0.37 | 47.4 | 2.4 | 1.84 | 0.07 | ||
| 152598 | 6279 | 53 Her | 0.31 | 60.7 | 3.0 | s | ||
| 153221 | 6300 | 0.88 | 4.4 | 2.2 |
| HD | HR | Name | Shape | |||||
|---|---|---|---|---|---|---|---|---|
| [km s-1] | [km s-1] | Flag | ||||||
| 153580 | 6314 | 2Ara | 0.49 | 45.4 | 2.3 | b | ||
| 156098 | 6409 | 0.51 | 5.8 | 3.2 | ||||
| 156295 | 6421 | 0.21 | 107.4 | 5.4 | 1.79 | 0.07 | ||
| 157728 | 6480 | 73 Her | 0.22 | 73.0 | 3.7 | s | ||
| 158741 | 6522 | 0.36 | 147.5 | 7.4 | s | |||
| 164259 | 6710 | 57 Ser | 0.39 | 69.3 | 3.5 | 1.75 | 0.04 | |
| 171834 | 6987 | 0.38 | 71.3 | 3.6 | 1.77 | 0.04 | ||
| 175813 | 7152 | CrA | 0.39 | 148.5 | 8.0 | 1.97 | 0.15 | |
| 177171 | 7213 | Tel | 0.53 | 68.5 | 4.0 | m2 | ||
| 180868 | 7315 | 25 1Aql | 0.19 | 83.0 | 4.2 | s | ||
| 182640 | 7377 | 30 Aql | 0.31 | 87.3 | 4.4 | 1.67 | 0.06 | c |
| 185124 | 7460 | 42 Aql | 0.42 | 87.0 | 4.4 | 1.71 | 0.03 | |
| 186005 | 7489 | 55 Sgr | 0.31 | 149.9 | 7.5 | 1.79 | 0.04 | |
| 187532 | 7553 | 51 Aql | 0.40 | 77.5 | 3.9 | 1.75 | 0.03 | |
| 189245 | 7631 | 0.49 | 72.6 | 3.6 | 1.74 | 0.03 |
-
a
Hoffleit & Warren, (1991)