The Radio Afterglows of Gamma-Ray Bursts
1 Introduction
Our understanding of the gamma-ray bursts (GRBs) has advanced rapidly since the discovery of long-lived “afterglow” emission from these events. Radio afterglow studies have become an integral part of this field, providing complementary and sometimes unique diagnostics on GRB explosions, their progenitors, and their environments. The reason for this is that the radio part of the spectrum is phenomenologically rich. This can be illustrated simply by calculating the brightness temperature () for a 1 mJy centimeter wavelength source at cosmological distances ( cm), expanding with one week after the burst. Since the derived K is well in excess of the K limit imposed by inverse Compton cooling, it follows, independent of any specific afterglow model, that the radio emission must originate from a compact, synchrotron-emitting source that is expanding superluminally (i.e. , ). Likewise, since the brightness temperature cannot exceed the mean kinetic energy of the electrons, the emission is expected to be self-absorbed at longer wavelengths kp97 . Finally, strong modulation of the centimeter signal is expected on timescales of hours and days because the angular size of this superluminal source is comparable to the Fresnel angle of the turbulent ionized gas in our Galaxy goo97 . Synchrotron self-absorption, interstellar scintillation, forward shocks, reverse shocks, jet-breaks, non-relativistic transitions and obscured star formation are among the phenomena routinely observed.
This short review is divided into two parts. The first section (§2) is a summary of the current search strategies and the main observational properties of radio afterglows. In the second section (§3) we highlight the key scientific contributions made by radio observations, either alone or as part of panchromatic studies. By necessity we will restrict this brief review to long-duration GRBs, although radio afterglows have also been detected toward the newly classified X-ray flashes, and searches have been carried out toward short bursts hbc+02 .
2 Detection Statistics and Observational Properties
The search for a radio afterglow is initiated either by a satellite localization of the burst, or by the detection of the X-ray or optical afterglow. The current search strategy has been to use the Very Large Array (VLA)111The NRAO is a facility of the National Science Foundation operated under cooperative agreement by Associated Universities, Inc. or the Australia Telescope Compact Array (ATCA; for declinations, )222The Australia Telescope is funded by the Commonwealth of Australia for operation as a National Facility managed by CSIRO. at 5 GHz or 8.5 GHz. These frequencies were chosen as a compromise between the need to image the typical error box size of 30-100 arcmin2, while having the requisite sensitivity to detect afterglows at sub-milliJansky levels. At lower frequencies the afterglow is attenuated by synchrotron self-absorption (), while at higher frequencies the field-of-view is proportionally smaller (FOV). For typical integration times (10 min at the VLA, and 240 min at the ATCA) the (receiver) noise is 30-50 Jy. Follow-up observations of detected afterglows were carried out by a network of radio facilities at centimeter, millimeter and submillimeter wavelengths fkw+00 .


In the five year period beginning in 1997 and ending in 2001 approximately 1500 radio flux density measurements (or upper limits) were made toward 75 bursts fkbw03 . From these 75 GRBs, there are a total of 32/36 successful X-ray searches, 27/70 successful optical searches, and 25/75 successful searches. These afterglow search statistics illustrate a well-known result, namely that the detection probability for X-ray afterglows is near unity, while for optical afterglows and radio afterglows it is 40% and 33%, respectively. The origin of these optically “dark bursts” could either be due to intrinsic effects (i.e. inadequate search due to rapid evolution of the afterglow and/or an under-energetic GRB) fjg+01 ; bkb+02 , or an extrinsic effect (i.e. extinction of the optical flux caused by circumburst dust or by the intergalactic medium) pfg+02 ; dfk+01 .
To accurately derive the fraction of “radio quiet” bursts it is necessary to incorporate both detections and upper limits in a statistically sound manner. This has been done in Fig. 1 where flux density distribution at 8.5 GHz is shown for a sample of 44 GRBs, toward which measurements or upper limits have been made between 5 and 10 days after a burst. The time since the burst is an important variable since radio light curves do not exhibit the simple power-law decays seen in X-ray and optical afterglows, but rise to a peak on average about one week after the burst and decay on timescales of a month. The mean of the 19 detections in Fig. 1 is 31582 Jy. Adding in the non-detections, and using the Kaplan-Meier estimator fn85 shifts this to 18640 Jy. Approximately 50% of all bursts have radio afterglows at 8.5 GHz above 110 Jy, while fewer than 10% exceed 500 Jy. The relatively small range of peak flux densities in Fig. 1 suggests that the fraction of “radio quiet” bursts is largely determined by instrumental sensitivities. With the arcsecond localizations provided by the Swift satellite (launch in 2004) it will be possible to routinely detect all afterglows with centimeter radio emission above 100 Jy. Increasing the fraction of detected radio afterglows significantly above 50% will require the sensitivity improvements provided by the Expanded Very Large Array333http://www.aoc.nrao.edu/evla/ (complete in 2010).
From this sample of peak flux densities we also derive the peak spectral radio luminosity in Fig. 1 given by , where and and has been assumed, corresponding to an optically thin, rising light curve. The GRB redshifts lie in the range between 0.36 to =4.5. The peak of the distribution is centered on 1031 erg s-1 Hz-1 and is similar to low-luminosity FRI radio galaxies like M87. More interestingly, a comparison between this GRB sample and a sample of Type Ib/c supernovae bkfs03 shows that the later is four orders of magnitude less luminous. Since radio emission is sensitive to the relativistic energy content of the shock, independent of the initial geometry of the explosion, this has been used to argue that the majority (97%) of nearby Type Ib/c supernovae do not produce a GRB-like event, such as that seen toward SN 1998bw kfw+98 .
3 Phenomenology and Interpretation
In this section we will follow the evolution a GRB and its radio afterglow depicted schematically in Fig. 2. The observations span four orders of magnitude in time (0.1-1000 days) and three orders of magnitude in frequency (0.8-660 GHz), so it should be no surprise that radio light curves exhibit a rich phenomenology. To interpret these observations we will rely on the highly successful “standard fireball model” mes02 . In this model there is an impulsive release of kinetic energy (1051 erg) from the GRB event which drives an ultra-relativistic outflow into the surrounding medium whose hydrodynamical evolution is governed by the kinetic energy released, the density structure of the circumburst medium and the geometry of the outflow. Synchrotron emission is produced by this relativistic shock which accelerates electrons to a power-law distribution. It is through the study of temporal (and spectral) evolution of afterglow light curves that we can gain insight into the physical conditions of the shock and the central engine that produced it.
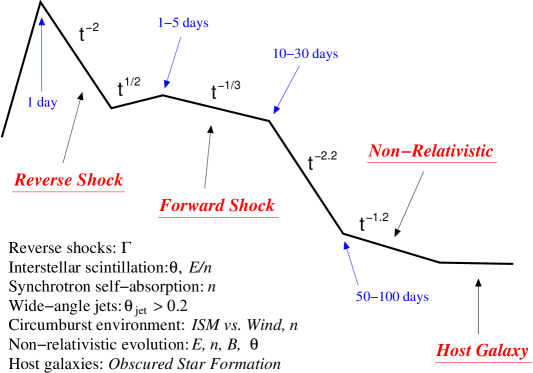
Despite response times as short as 2 hrs, centimeter searches (§2) are rarely successful until a day or more after a burst. Broadband afterglow spectra show that centimeter emission is attenuated as a result of synchrotron self-absorption gbb+00 . Typical observed values for the self-absorption frequency are 5-10 GHz. It is interesting to note that the flux density below has the form F, not the 5/2 spectral slope usually seen toward most radio sources. This is because the relativistic shock accelerates electrons to a power-law distribution (with energy index given by N() above a minimum energy , which initially radiate their energy most of their energy at . The flux below depends only the angular size of the source and the fraction of the shock energy that goes into accelerating electrons kp97 , and thus it is a useful diagnostic of the ratio of the energy of the shock and the density of the circumburst medium ().
As this optically thick radio source expands, a monotonic rise in the flux would be expected. It was therefore a considerable surprise when early observations of GRB 970508 showed erratic, short term ( hrs) and narrow band (GHz) fluctuations in the centimeter emission fkn+97 . The origin of these variations goo97 was traced to the scattering of the radio emission, owing to the small angular size of the fireball, as it propagates through the turbulent ionized gas of our Galaxy. This is a large and complex subject rick90 ; gfs+03 , but for the purpose of this review it is sufficient to note that for typical lines of sight the modulation of the flux densities is near a maximum at frequencies near 5-10 GHz. Coincidently, this is the same frequency range where typically lies and where the majority of radio observations are being made. While interstellar scintillation adds a certain degree of complexity to interpreting afterglow light curves, it also allows us to use the Galaxy as a large lens to effectively resolve the fireball. The observed “quenching” of diffractive scintillation from GRB 970708 four weeks after the burst wkf98 ; fwk00 lead to estimate of the angular size, demonstrating superluminal expansion and providing an early confirmation of the fireball model.
In many instances kfs+99 ; fbg+00 ; hys+01 ; yfh+02 ; bsfk03 bright, short-lived radio “flares” are detected at early times ( d). The emission is much brighter than expected from a backward extrapolation of the light curve, and the level of fluctuation is too great to be accounted for by interstellar scintillation. One of the best-known examples is the radio flare of GRB 990123 kfs+99 , which was accompanied by a 9th magnitude optical flash abb+99 . This prompt optical and radio emission is thought to be produced in a strong reverse shock which adiabatically cools as it expands back through the relativistic ejecta sp99b . The strength and lifetime of this reverse shock emission is sensitive to the initial Lorentz factor, , of the shock and the density structure of the circumburst medium sr02 ; bsfk03 . To properly constrain these values requires that the peak of the emission be measured. This is difficult to do with optical observations, which require a response time on the order of the burst duration, while radio observations require a response time of only 12-48 hrs.
On a timescale of days to weeks after the burst, the subsequent evolution of the radio afterglow (Fig. 2) can be described by a slow rise to maximum, followed by a power-law decay. The radio peak is often accompanied by a sharp break in the optical (or X-ray) light curves hbf+99 ; bsf+00 . The most commonly accepted (but not universal) explanation for these achromatic breaks is that GRB outflows are collimated. The change in spectral slope, , where , occurs when the of the shock drops below , the inverse opening angle of the jet rho99 ; sph99 . Since the radio emission at initially lies below the synchrotron peak frequency the jet break signature is distinctly different than that at optical and X-ray wavelengths. Prior to the passage of the jet break is expected to give rise to a shallow decay or plateau , in the optical thin () or thick () regimes, respectively. Another recognizable radio signature of a jet-like geometry is the “peak flux cascade”, in which successively smaller frequencies reach lower peak fluxes (i.e. ). Taken together, these observational signatures can be used to infer the opening angles of wide angle jets. Such jets are hard to detect at optical wavelengths because the break is masked by the host galaxy, which typically dominates the light curve between a week and a month after the burst bdf+01 ; fyb+03 . Once the real geometry of the outflow is known fks+01 ; bfk03 the energy released in the GRB phase and the afterglow phase can be determined.
As noted above, the radio band is fortuitously located close to and as such it is a sensitive probe of the density structure of the circumburst medium. Extensive broadband modeling pk02 has yielded densities in the range 0.1 cmn 100 cm-3, with a canonical value of order n10 cm-3. Such densities are found in the diffuse interstellar clouds of our Galaxy, commonly associated with star-forming regions. A density of order 5-30 cm-3 is also characteristic of the interclump medium of molecular clouds, as inferred from observations of supernova remnants in our Galaxy (e.g., Chevalier 1999 and references therein). Based on X-ray and optical observations alone, there have been claims of high n cm-3 dl00 ; iz+01 or low n cm-3 pk01 circumburst densities. However, in several of these cases when the radio data has been added to the broadband modeling (i.e. constraining ), there is no longer any support for either extreme of density hys+01 ; fyb+03 .
One unsolved problem on the structure of the circumburst environment is the absence of an unambiguous signature of mass loss from the presumed massive progenitor star in afterglow light curves cl00 . Although there are some notable exceptions (e.g., Price et al. 2002), most GRB light curves are best fit by a jet expanding into a constant density medium instead of a radial density gradient, pk02 . Part of the solution may lie in reduced mass loss rates due to metalicity effects, or the motion of the star through a dense molecular cloud wijers01 , both of which act to shrink the radius that the pre-burst wind is freely expanding. It is equally likely that our failure to distinguish between different models of the circumburst medium is due to the lack of early afterglow flux measurements, especially at millimeter and submillimeter wavelengths where the largest differences arise pk00 ; yost03 . The resolution of this conflict is important as it goes to the heart of the GRB progenitor question.
At sufficiently late times, when the rest mass energy swept up by the expanding shock becomes comparable to the initial kinetic energy of the ejecta (100 days), the expanding shock may slow to non-relativistic speeds wrm97 . A change in the temporal slope is expected at this time (Fig. 2) with for a constant density medium, independent of geometry. This dynamical transition provides a simple and power method to derive the kinetic energy of the outflow which has expanded to be quasi-spherical at this time. In contrast, most energy estimates made at early times require knowledge of the geometry of the outflow pk01 ; bkf03 ; bfk03 . Using the late-time radio light curves and the robust Taylor-Sedov formulation for the dynamics we can infer quantities such as the kinetic energy, ambient density, magnetic field strength, and the size of the fireball. The radius can be checked for consistency with the equipartition radius and the interstellar scintillation radius. This method has been used for GRB 970508 fwk00 and for GRB 980703 (Berger, priv. comm.), yielding energies of order erg, in agreement with other estimates.
Finally, the radio light curves at late times may flatten due to the presence of an underlying host galaxy. Most GRBs studied to date have optical/NIR hosts but only about 20% have been seen at centimeter and submillimeter wavelengths bkf01 ; fbm+02 ; bck+03 . This radio emission, if produced by star formation, implies star formation rates SRF M⊙ yr-1 and L L⊙, clearly identifies these GRB hosts as ultraluminous starburst galaxies which are all but obscured by dust at optical wavelengths. This is an emerging area with great potential for studying cosmic star formation with a sample of galaxies selected quite differently than other methods. Preliminary studies have already shown that GRB-selected galaxies are significantly bluer than other radio-selected samples bck+03 .
Acknowledgements. DAF would like to thank his many collaborators in the radio afterglow network, especially Shri Kulkarni and Edo Berger.
References
- (1) Katz, J. L. and Piran, T. ApJ, 490, 772, (1997).
- (2) Goodman, J. New Astr., 2(5), 449–460, (1997).
- (3) Hurley, K., et al. ApJ, 567, 447–453, (2002).
- (4) Frail, D. A., et al. in AIP Conf. Proc. 526: Gamma-ray Bursts, 5th Huntsville Symposium, 298–302, (2000).
- (5) Frail, D. A., et al. AJ, 125, 2299–2306, (2003).
- (6) Fynbo, J. U., et al. A&A, 369, 373–379, (2001).
- (7) Berger, E., et al. ApJ, 581, 981–987, (2002).
- (8) Piro, L., et al. ApJ, 577, 680–690, (2002).
- (9) Djorgovski, S. G., et al. ApJ, 562, 654–663, (2001).
- (10) Feigelson, E. D. and Nelson, P. I. ApJ, 293, 192–206, (1985).
- (11) Berger, E. et al. A Radio Survey of Type Ib and Ic Supernovae: Searching for Engine Driven Supernovae. ApJ, in press; astro-ph/0307228, (2003).
- (12) Kulkarni, S. R., et al. Nature, 395, 663–669, (1998).
- (13) Mészáros, P. Ann. Rev. Astr. Ap., 40, 137–169, (2002).
- (14) Galama, T. J., et al. ApJ, 541, L45–L49, (2000).
- (15) Frail, D. A., et al. Nature, 389, 261–263, (1997).
- (16) Rickett, B. J. Ann. Rev. Astr. Ap., 28, 561–605, (1990).
- (17) Galama, T. J., et al. ApJ, 585, 899–907, (2003).
- (18) Waxman, E., Kulkarni, S. R., and Frail, D. A. ApJ, 497, 288–293, (1998).
- (19) Frail, D. A., Waxman, E., and Kulkarni, S. R. ApJ, 537, 191–204, (2000).
- (20) Kulkarni, S. R., et al. ApJ, 522, L97–L100, (1999).
- (21) Frail, D. A., et al. ApJ, 538, L129–L132, (2000).
- (22) Harrison, F. A., et al. ApJ, 559, 123–130, (2001).
- (23) Yost, S. A., et al. ApJ, 577, 155–163, (2002).
- (24) Berger, E., et al. ApJ, 587, L5–L8, (2003).
- (25) Akerlof, C., et al. Nature, 398, 400–402, (1999).
- (26) Sari, R. and Piran, T. ApJ, 517, L109–L112, (1999).
- (27) Soderberg and Ramirez-Ruiz. Flaring up: Radio Diagnostics of the Kinematic, Hydrodynamic and Environmental Properties of GRBs. MNRAS, in press; astro-ph/astro-ph/0210524, (2002).
- (28) Harrison, F. A., et al. ApJ, 523, L121–L124, (1999).
- (29) Berger, E., et al. ApJ, 545, 56–62, (2000).
- (30) Rhoads, J. E. ApJ, 525, 737–749, (1999).
- (31) Sari, R., Piran, T., and Halpern, J. P. ApJ, 519, L17–L20, (1999).
- (32) Berger, E., et al. ApJ, 556, 556–561, (2001).
- (33) Frail, D. A., et al. ApJ, 590, 992–998, (2003).
- (34) Frail, D. A., et al. ApJ, 562, L55–L58, (2001).
- (35) Bloom, J. S., Frail, D. A., and Kulkarni, S. R. GRB Energetics and the GRB Hubble Diagram: Promises and Limitations. ApJ in press, astro-ph/0302210, (2003).
- (36) Panaitescu, A. and Kumar, P. ApJ, 571, 779–789, (2002).
- (37) Chevalier, R. A. ApJ, 511, 798–811, (1999).
- (38) Dai, Z. G. and Lu, T. ApJ, 537, 803–809, (2000).
- (39) in’ t Zand, J., et al. ApJ, 559, 710–715, (2001).
- (40) Panaitescu, A. and Kumar, P. ApJ, 554, 667–677, (2001).
- (41) Chevalier, R. A. and Li, Z. ApJ, 536, 195–212, (2000).
- (42) Price, P. A., et al. ApJ, 572, L51–L55, (2002).
- (43) Wijers, R. A. M. J. in Gamma-ray Bursts in the Afterglow Era, 306–311, (2001).
- (44) Panaitescu, A. and Kumar, P. ApJ, 543, 66–76, (2000).
- (45) Yost, S. et al. A Study of the Afterglows of Four GRBs: Constraining the Explosion and Fireball Model. ApJ, in press; astro-ph/0307056, (2003).
- (46) Wijers, R. A. M. J., Rees, M. J., and Mészáros, P. MNRAS, 288, L51–L56, (1997).
- (47) Berger, E., Kulkarni, S. R., and Frail, D. A. ApJ, 590, 379–385, (2003).
- (48) Berger, E., Kulkarni, S., and Frail, D. A. ApJ, 560, 652–658, (2001).
- (49) Frail, D. A., et al. ApJ, 565, 829–835, (2002).
- (50) Berger, E., et al. ApJ, 588, 99–112, (2003).