JEM-X background models††thanks: Based on observations with INTEGRAL, an ESA project with instruments and science data centre funded by ESA member states (especially the PI countries: Denmark, France, Germany, Italy, Switzerland, Spain), Czech Republic and Poland, and with the participation of Russia and the USA.
Background and determination of its components for the JEM-X X-ray telescope on INTEGRAL are discussed. A part of the first background observations by JEM-X are analysed and results are compared to predictions. The observations are based on extensive imaging of background near the Crab Nebula on revolution 41 of INTEGRAL. Total observing time used for the analysis was 216502 s, with the average of 25 cps of background for each of the two JEM-X telescopes. JEM-X1 showed slightly higher average background intensity than JEM-X2. The detectors were stable during the long exposures, and weak orbital phase dependence in the background outside radiation belts was observed. The analysis yielded an average of 5 cps for the diffuse background, and 20 cps for the instrument background. The instrument background was found highly dependent on position, both for spectral shape and intensity. Diffuse background was enhanced in the central area of a detector, and it decreased radially towards the edge, with a clear vignetting effect for both JEM-X units. The instrument background was weakest in the central area of a detector and showed a steep increase at the very edges of both JEM-X detectors, with significant difference in spatial signatures between JEM-X units. According to our modelling, instrument background dominates over diffuse background in all positions and for all energies of JEM-X.
Key Words.:
X-ray background – X-ray data analysis – INTEGRAL satelliteemail: Juhani.Huovelin@Helsinki.Fi
1 Introduction
Background of X-ray and -ray detectors for astronomy can generally be divided in two components, diffuse sky background and instrument background.
JEM-X consists of two mechanically identical telescope units (JEM-X 1 and 2), with a position sensitive xenon-filled Microstrip Gas Chamber, a collimator, and a coded mask as an optical element in each unit (see Lund et al. 2003 for more details). There are four internal radioactive sources for spectral calibration in the collimator of each unit.
The sky image is thus a result of mathematical processing of the mask shadow pattern on the position sensitive detectors (e.g. in’t Zand 1992; in’t Zand, Heise & Jager 1994).
Diffuse sky background enters the detectors via the aperture and is affected by the mask and the collimator, similarly to the distinguishable sources in the sky. Instrument background includes detector signal due to interactions between cosmic radiation and materials of the satellite and the detector itself. MeV-range or higher energy -ray detectors may also be sensitive to direct -rays from e.g. solar flares that penetrate the detector through the spacecraft and detector panels (e.g. Ferguson et al., 2003). Instrument background thus carries essentially no coding from the mask. It introduces additional noise and may bring up artificial sources, if not properly determined in the shadowgrams, and then accounted for in image reconstruction. Useful examples of early treatment and analysis of instrument background for coded aperture telescopes can be found from Covault et al. (1991) and Willmore et al. (1992).
Due to the expected difficulty of background determination, the JEM-X instrument specific software (ISSW) has been designed to permit accounting for various effects and dependencies of background, and background modelling is made using external background libraries (see Westergaard et al., 2003). Detailed description of the software can be found in the Architectural Design Document (ADD) of JEM-X (Oxborrow et al., 2002).
In this paper, we present results and analysis of a part of the first extensive background observations with INTEGRAL JEM-X.
| (2000.0) | (2000.0) | staring time |
|---|---|---|
| (h m s) | (∘ ′ ′′) | (s) |
| 4 53 24.0 | 21 08 50.1 | 70000 |
| 5 36 45.0 | 12 24 15.1 | 40825 |
| 5 36 45.2 | 12 25 46.4 | 42775 |
| 5 36 45.3 | 12 25 43.5 | 64468 |
2 Observations
Observations included in our analysis were made during cycle 41 of INTEGRAL, between February 13, 01:05:57 UTC, and February 16, 00:51:18 UTC, 2003. The pointings for these background observations were selected from the vicinity of the Crab Nebula, with pointing centres about away from the position of Taurus XR-1 (see Table 1). The total observing time of JEM-X was 218068 s, of which 216502.12 s was included in our analysis. The background observing programme near Crab Nebula started already during cycle 40. The first observations were not included in our analysis, since we aimed at studying the background and the variations within one full orbit. JEM-X observations were made in full imaging mode. We used JEM-X events preprocessed with standard JEM-X ISSW, which is publically distributed by the ISDC. The spatial gain corrections and other preprocessing parameters date to May 20, 2003.
3 Analysis
The analysis included fitting of a two component background model to JEM-X spectra for 8 radial ranges of equal area beginning from the centre of each of the two detectors. The radial ranges were further divided in 6 azimuthal sectors each covering an angle of (Fig. 3). The modelling was made using the publically available XSPEC X-ray spectrum fitting software (Arnaud 1996). The energy range used for the spectral fits was 4-33 keV.
The following assumptions were made for the fitting procedure: First, we assumed the following analytical formula for the diffuse sky background,
| (1) |
where is photon energy and C is a normalization constant. This is close to a thermal bremsstrahlung model well fitted for diffuse X-ray background from 3 to 45 keV (e.g. Marshall et al.1980). Second assumption was that, excluding the known line emission from the detector and surrounding material, instrument background should be flat (i.e. constant in energy). The lines were modeled as narrow (maximum width determined by instrumental energy resolution) Gaussian lines with fixed line centroid positions. Eleven lines were detected in the background spectra. Thus, the background spectral model has 24 free parameters, including widths and strengths of the eleven lines and normalization of the two continuum components.
The modelling was made in two steps. First, we fitted the spectra extracted from each subregion of both detectors with the full model described above to get an initial estimate for the diffuse background level. After this, the estimated diffuse background component was subtracted from each spectrum, and the residual spectrum was taken as the instrument background.
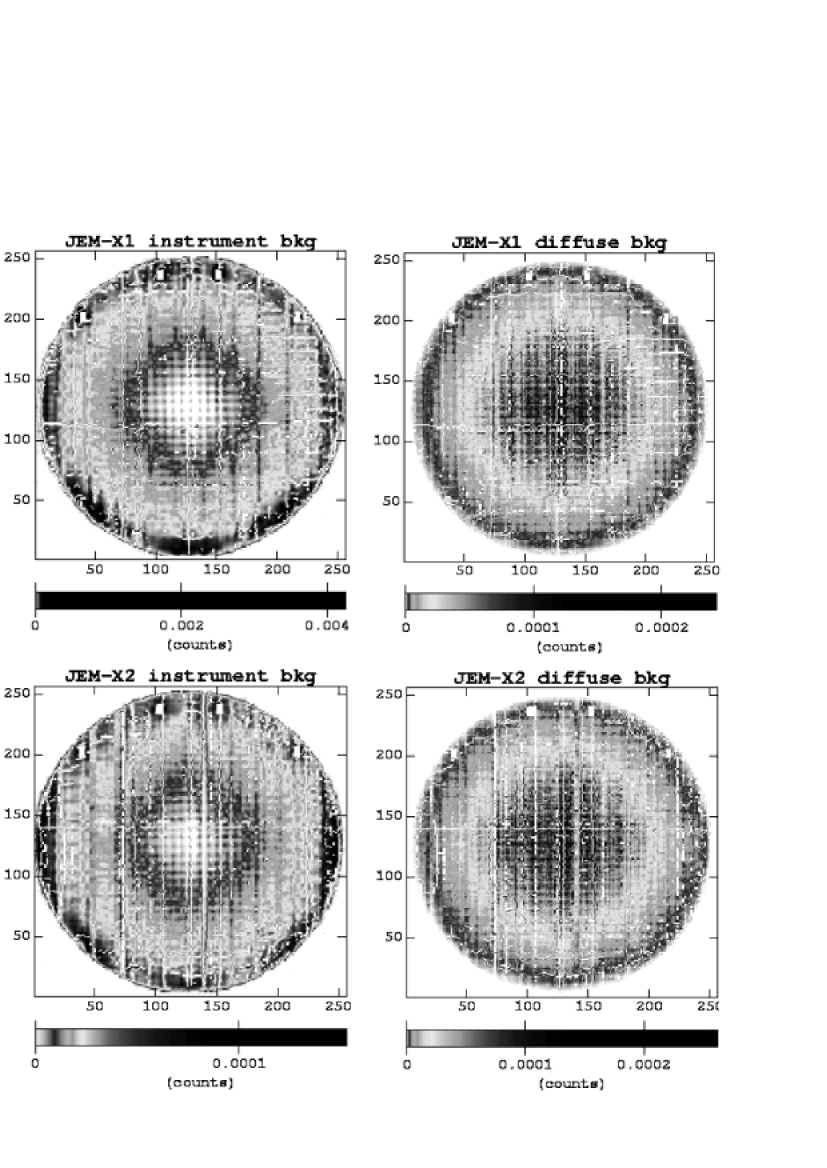
The resulting background images and sample spectra of a few subregions are shown in Figs. 1 and 2. For a summary of the results, see Tables 2 and 3. All parameters for the background components in Tables 2 and 3 are directly from the XSPEC spectral fitting, which applies instrument response and effective area similarly to all model components. The fitting procedure thus yields physically consistent values only for the diffuse background component, which is modified by the coded mask and collimator. As for the instrument background, however, full mask coding and effect of the collimator are not relevant assumptions. Thus, the flux values for the instrument background in Table 2 are not physically valid, but still usable for the modelling purpose. This should be kept in mind when using the values from Tables 2 and 3.
The diffuse background decreases towards the edges of the detector, as expected. The instrument background is stronger than expected, dominating the spectrum at all radii. The ten expected K-shell lines (from the 109Cd and 55Fe calibration sources, collimator (Mo), and detector gas (Xe)) were detected close to their nominal positions. This implies that the energy scale is correctly determined. The previously unknown weak line near 13 keV turned out to be the uranium L-shell line. It most likely originates in the detector beryllium window. Near the edges of the detector, the background is highly nonuniform. Additional nonuniformity in the outer parts was introduced by photon leak from calibration sources, which could not be completely eliminated.
| JEM-X1 | JEM-X2 | ||||
|---|---|---|---|---|---|
| pix | pix | Diffuse | Flat | Diffuse | Flat |
| 0 | 47.6 | ||||
| 47.6 | 64.8 | ||||
| 64.8 | 78.4 | ||||
| 78.4 | 90 | ||||
| 90 | 100 | ||||
| 100 | 109 | ||||
| 109 | 118 | ||||
| 118 | 126 | ||||
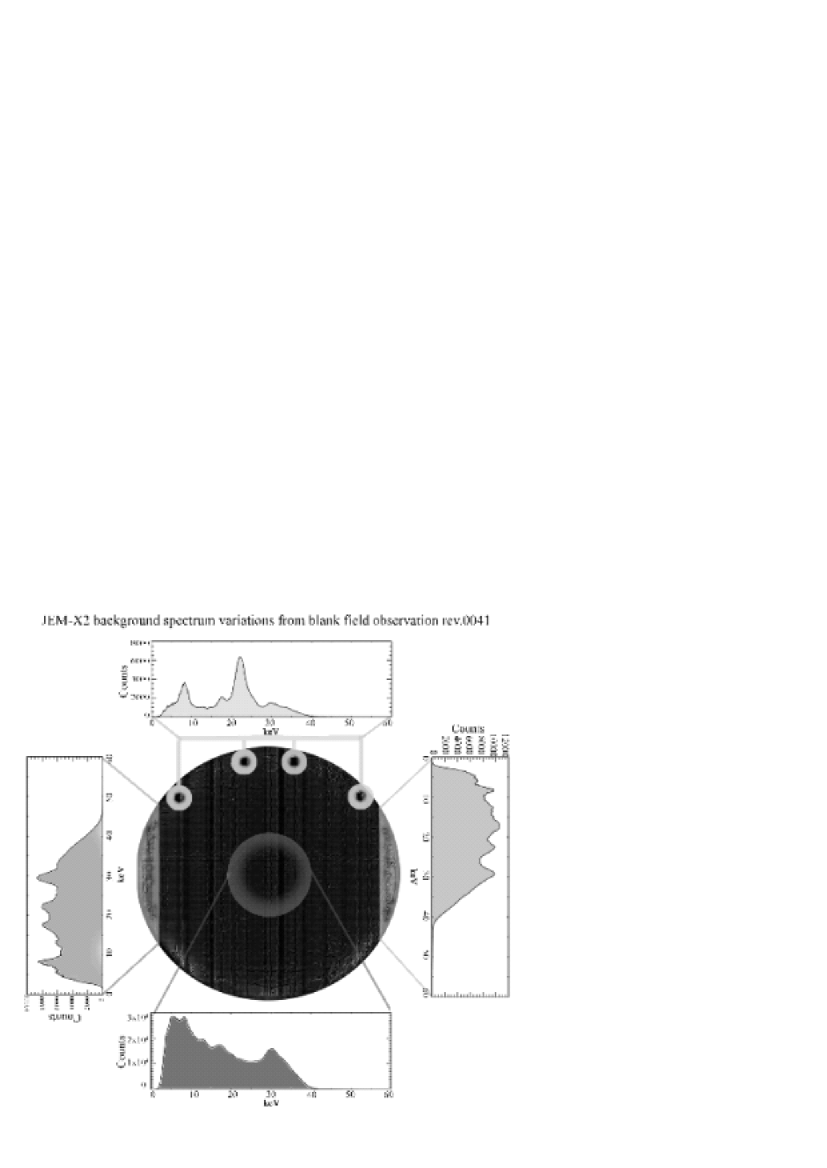

| Line | Origin | |||||
|---|---|---|---|---|---|---|
| Mn K | 5.90 | 9.0 | 8.1 (2) | 4.5 | 2.5 (34) | 55Fe |
| Mn/Fe | 6.45 | 15.4 | 15.4 (1) | 2.4 | 1.8 (3) | 55Fe |
| Ni K | 7.47 | - | - | 3.4 | 2.2 (6) | 109Cd |
| Ni K | 8.27 | 12.4 | 9.6 (38) | 30.5 | 15.5 (48) | 109Cd |
| U L | 13.5 | 22.2 | 8.6 (27) | 58.6 | 11.5 (42) | Be win |
| Mo K | 17.4 | 41.9 | 9.2 (43) | 69.8 | 14.0 (47) | Collim. |
| Ag K | 22.1 | 19.7 | 11.2 (7) | 51.1 | 15.2 (19) | 109Cd |
| Cd K | 23.0 | 12.3 | 10.9 (2) | 15.0 | 3.6 (4) | 109Cd |
| Ag K | 24.9 | 16.5 | 11.5 (5) | 13.6 | 7.7 (13) | 109Cd |
| Xe K | 29.6 | 46.1 | 14.7 (40) | 64.0 | 19.2 (48) | Gas |
| Xe K | 33.6 | 31.0 | 14.0 (24) | 25.9 | 11.6 (31) | Gas |
We also searched for possible dependence of background on the orbital phase of the observations. The spectrum varied with a range of approximately 5% between three separate orbital sections well outside radiation belts. The variation is statistically significant but small. Also dependence on solar aspect angle and particle radiation level can be utilised in the JEM-X ISSW background modelling. Significant variations were not found. The variation in the solar aspect due to different pointings was , which is probably not sufficiently large for studies of an effect on instrument background. Also, there was no proper indicator of particle radiation level on INTEGRAL available during our observations to search for a correlation.
4 Conclusions
We have analyzed a part of the first INTEGRAL background observations with JEM-X. Estimates of the spatial and spectral distributions are obtained for diffuse sky background and instrument background.
The total background observed for JEM-X1 was 28 cps, for JEM-X2 23 cps, and 25 cps on the average. A part () of the excessively large background may be due to residual Crab Nebula emission in JEM-X data.
According to XSPEC fitting, the diffuse background was at maximum in the centre of the detector and it decreased radially towards the edge, which is due to vignetting. There is also slight asymmmetry in the spatial distribution of the diffuse background, which is caused by a small angular misalignment of the detector plane. The count rate for diffuse background was approximately 20 % of the total background.
The instrument background intensity and spectrum are highly position dependent, with a steep increase near the edges at all radial directions. Leakage of the radiative calibration sources causes residual line emission in the neighbourhood of the source positions. The count rate for the instrument background was approximately 80 % of the total background.
The total background level varied with a range of approximately 5 % between different orbital sections. the variation is significant, but small. Also, it is impossible to say, what fraction of this, if any, is caused by the simultaneous variation of the solar aspect angle of the satellite, and the unknown variations of particle radiation level. We plan to separate these effects by the support of future background observations.
Although our modelling is simple, and does not provide accurate absolute estimates of physical background fluxes, it yields information which can be applied to the JEM-X analysis software to properly account for background contribution in spatially resolved spectral data. A thorough analysis of JEM-X background will be presented in a future paper.
Acknowledgements.
Authors from the Observatory, University of Helsinki acknowledge the Academy of Finland, TEKES, and the Finnish space research programme ANTARES for financial support in this research. J. Schultz is grateful for the financial support of the Wihuri Foundation. The Danish Space Research Institute acknowledges support given to the development of the JEM-X instrument from the PRODEX programme.References
- (1) Arnaud, K.A., 1996, Astronomical Data Analysis Software and Systems V, eds. Jacoby G. and Barnes J., ASP Conf. Series Vol. 101.
- (2) Covault, C.E., Grindlay, J.E., Manandhar, R.P., and Braga, J., 1991, IEEE Transact. Nucl. Sci., Vol. 38, No. 2.
- (3) Ferguson, C., Barlow, E.J., Bird, A.J., et al., 2003 A & A, this volume
- (4) in’t Zand, J., 1992, Ph. D. thesis, SRON.
- (5) in’t Zand, J., Heise, J., Jager, R., 1994, A & A 288, 665.
- (6) Lund,. N., Brandt, S., Budtz-Joergensen, C., et al., 2003, A & A, this volume
- (7) Marshall, F.E., Boldt, E.A., Holt, S.S., et al., 1980, ApJ 235, 4
- (8) Oxborrow C.A., Kretschmar, P., Maisala, S., Westergaard, N.J., Larsson, S., 2002, Instrument Specific Software for JEM-X: Architectural Design Document, DSRI homepage: www.dsri.dk
- (9) Thompson, A.C., Attwood, D.T., Gullikson, E.M., et al., 2001, “The X-ray data booklet”, 2nd ed., Lawrence Berkley National Laboratory, Univ. of California, available at http://xdb.lbl.gov/
- (10) Westergaard, N.J., Kretschmar, P., Oxborrow, C.A., et al., 2003, A & A, this volume
- (11) Willmore, A.P., Bertram, D., Watt, M.P., et al., 1992, MNRAS 258, 621