56Ni mass in type IIP SNe: Light curves and H luminosities diagnostics
Abstract
We analyse late-time observations, available photometry and spectra, of a sample of type II plateau supernovae (SNe IIP). The possibility of using H luminosity at the nebular epoch as a tracer of 56Ni mass in this class of objects is investigated, yielding a consistency with the photometry-based estimates within 20%. Interesting correlations are found and their impacts on our present understanding of the physics of core collapse SNe are discussed.
1 Results and discussion
The study of SNe IIP (i.e. optical properties, asymmetry, clumping, nucleosynthesis and yields) provides constraints on the explosion models and pre-supernova parameters. In particular, the 56Ni mass is one of the crucial parameters since it presumably depends on the presupernova structure and the explosion model Auf91 .
We select a sample of type IIP SNe on the basis of available photometry and spectra, especially at latter epochs. In Fig. 1(left) we display the absolute light curves of the SNe sample together with that of SN 1987A. We adopt unique distance determination methodology, namely using the recession velocity of the host galaxy corrected for Local Group infall onto the Virgo Cluster and assuming a Hubble constant =70 km s-1Mpc-1. Galactic extinction is removed using the map of galactic dust extinction by Schlegel et al (1998)Sch98 , while the host galaxy reddening is estimated from the “” and “” colour excess compared to the intrinsic colour curves of SN 1987A. This is based on the fact that at the late photospheric phase, through the end of the recombination phase, SNe IIP seem to follow colour evolution similar to SN 1987A Schm92 .
The computed late time decline slopes, in the d time range, are consistent with the radioactive decay of 56Co and consequent trapping of the gamma-rays. Indeed a mean value of about for the sample SNe is measured.
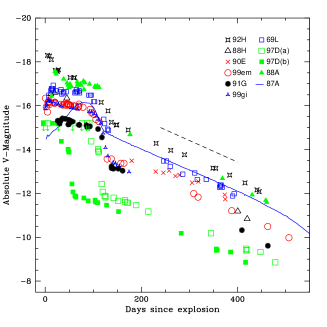
Once we fix the points related to the extinction and distance, which are crucial when dealing with a SN-sample study, we proceed with computing the amounts of ejected 56Ni using the absolute light curve of SN 1987A as template (in the 120400 days time range). We found a range from lower values for SN 1999eu and SN 1997D to a higher one for SN 1992H (), with an average of about 0.05 . These results combined with the emergence of the extremely faint and bright events (see also Pastorello et al.; Hamuy., these Proceedings) tend to change the general belief about the 56Ni production in type II SNe (i.e. all eject ). The above facts are extremely important for modeling the chemical evolution of galaxies since they impose constraints on the iron production.
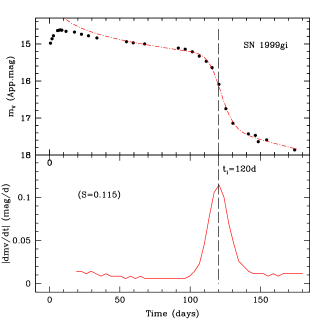
Analysing the absolute light curves of the sample events, we introduce a new parameter, called “” and defined as , which describes the shape of the light curves and provides a way to measure the decay rate at the inflection point. The light curves in the transition period from plateau to radioactive tail are approximated by a sum of plateau and radioactive terms:
| (1) |
where , , , and are parameters derived by the minimization technique in the sensitive interval days. Fig. 1(right) demonstrates the behaviour of and determination of the inflection time for the case of SN 1999gi.
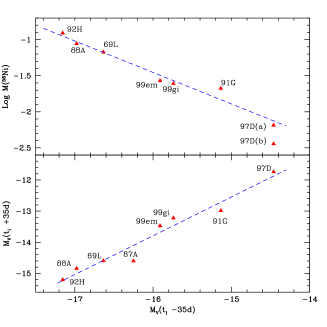
The correlation between the 56Ni mass and plateau MV found by Hamuy Ham03 is confirmed (Fig. 2, left), and the linear fit is described by the equation:
| (2) |
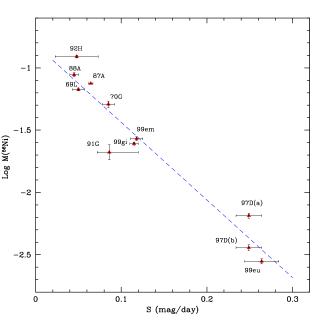
Furthermore an interesting by-product of the sample photometry analysis is the correlation found between 56Ni mass and the steepness parameter . The correlation is quantified on the basis of the available data (Fig. 2, right), and the best linear fit reads:
| (3) |
The correlation is such that the steeper the decline at the inflection point the lower is the mass of 56Ni. Although the interpretation of this correlation requires hydrodynamical modeling with different amounts of 56Ni and degrees of mixing, it may well be that somehow the increase of the 56Ni mass in SNe IIP ejecta favours the larger radiative diffusion times at the end of the plateau and, therefore, a less steep transition from plateau to the radioactive tail, or that the increase of the 56Ni mass is accompanied by the growth of the degree of mixing which favours a less steep decline. This correlation is interesting in the sense that, if confirmed, it will provide distance and extinction independent estimates of the 56Ni mass in SNe IIP.
We construct then a “” model of the H luminosity in SN IIP to explore the sensitivity of the H behaviour to variation of model parameters. The primary purpose of the upgraded model is to specify better the early nebular phase compared to the previous version Chug90 . We found that if mass, energy and mixing conditions do not vary strongly among SNe IIP (less than factor 1.4) then with an accuracy better than 10% H luminosity is proportional to 56Ni mass during the days after explosion (for more details see Elmhamdi et al. 2003 Elm03 ). H luminosities are then used to derive 56Ni masses of the SNe sample. This is done employing two approaches: first, using the H light curve in SN 1987A as template and, second, applying the model fitting (Fig. 3). Both approaches agree within 15% unless we are dealing with extreme cases such as SN 1970G (type IIP/L) and the underluminous SN 1997D. In both these cases we should possess additional information about ejecta mass and energy to derive the 56Ni mass from H modeling. SN 1997D is indeed a special case for which two scenarios have been argued, namely: a small age scenario with a low ejecta mass (case “b”; Chug00 ) and a large age option with high mass of the ejecta (case “a”; Zamp03 ).

Worth noting is the simple approach of using H light curve of SN 1987A as a template to estimate the 56Ni mass. The 56Ni mass values derived using this method agree within 20% with those from the photometry, which thus gives us confidence that H is a good indicator of the amount of 56Ni in SNe IIP (Fig. 4). Simultaneously, this consistency suggests that parameters of SNe IIP (mass, energy and mixing) are not very different. In fact this is consistent with the uniformity of plateau luminosities and plateau lengths of SNe IIP.
This simple approach is applied then for three SNe for which we have late spectra but no photometry (SNe 1995ad, 1995V and 1995W), giving reasonable values, and thus demonstrating the usefulness of the method Elm03 . Generally, the approach based upon H may be indispensable in cases, when the photometry at the nebular epoch is absent, or when there is a problem with subtraction of stellar background (SN IIP in the bulge, or in high redshift galaxies).
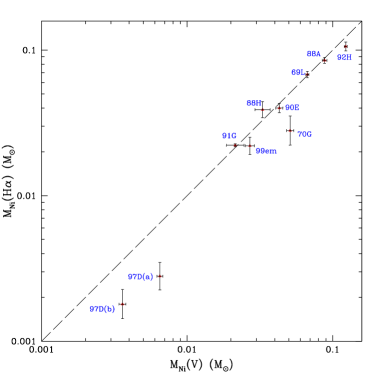
On the one hand, the clustering of the points around two values of 56Ni mass viz. 0.005 and 0.05 in Fig. 4 may result from poor statistical sampling, or it may be a hint that a mechanism such as fall-back is an important one in the evolution of the low-mass group.
The interesting correlations demonstrated in this class of objects point to a high degree of homogeneity and this is encouraging for the use of type IIP SNe as cosmological probes. Improved statistical samples and better sampled data are however needed to have a firmer confirmation of these correlations.
These kinds of analyses demonstrate how large sample analyses in SNe studies can provide robust results and correlations with their consequent impact for our understanding of SNe physics.
References
- (1) Aufderheide M. B., Baron E. Thielemann F. K. 1991, ApJ, 370, 630
- (2) Chugai N. N. 1990, SvAL, 16, 457
- (3) Chugai N. N. Utrobin V. P. 2000, AA, 354, 557
- (4) Elmhamdi A., Chugai N. N. and Danziger I. J. 2003, AA, 404, 1077
- (5) Hamuy M. 2003, ApJ, 582, 905
- (6) Leonard D. C., Filippenko A. V., Li W. et al. 2002, AJ, 124, 2490
- (7) Schlegel D. J., Finkbeiner D. P. Davis M. 1998, 500, 525
- (8) Schmidt B. P., Kirshner R. P. Eastman R. G. 1992, ApJ, 395, 366
- (9) Zampieri L. et al. 2002, MNRAS; 338, 711