Evidence of a decrease of kHz QPO peak separation towards low frequencies in 4U 1728–34 (GX 354–0)
Abstract
We have produced the colour-colour diagram of all the observations of 4U 1728–34 available in the Rossi X-ray Timing Explorer public archive (from 1996 to 2002) and found observations filling in a previously reported ‘gap’ between the island and the banana X-ray states. We have made timing analysis of these gap observations and found, in one observation, two simultaneous kHz quasi-periodic oscillations (QPOs). The timing parameters of these kHz QPOs fit in the overall trend of the source. The ‘lower’ kHz QPO has a centroid frequency of Hz. This is the lowest ‘lower’ kHz QPO frequency ever observed in 4U 1728–34. The peak frequency separation between the ‘upper’ and the ‘lower’ kHz QPO is Hz, significantly smaller than the constant value of Hz found when the ‘lower’ kHz QPO frequency is between and 800 Hz. This is the first indication in this source for a significant decrease of kHz QPO peak separation towards low frequencies. We briefly compare the result to theoretical models for kHz QPO production.
keywords:
binaries: close – accretion, accretion discs – stars: neutron stars: individual: 4U 1728–341 Introduction
Low-mass X-ray binary (LMXB) low-magnetic field neutron stars (NSs) often show pairs of kHz quasi-periodic oscillations (QPOs) in their power spectra. The frequency separation between these ‘twin peaks’ is sometimes observed to be close to the burst oscillation frequency , interpreted as the spin frequency of the NS (Strohmayer et al. 1996; see Chakrabarty et al. 2003), while sometimes it is close to half of it. Recent work on the millisecond pulsar SAX J1808.4–3658 (where the spin frequency is more straightforwardly measured, at 401 Hz; Wijnands et al. 2003) indicates that in those latter cases is half the spin frequency. In some, perhaps all sources decreases significantly with increasing QPO frequency. GX 17+2 shows a hint of a decrease at lower frequencies (Homan et al. 2002), but is consistent with being constant. In some sources, e.g. 4U 1728–34 (Méndez & van der Klis 1999), the peak separation is always significantly lower than the burst oscillation , while in 4U 1636–53 (Jonker, Méndez & van der Klis 2002) varies between lower and higher than .
Two competing interpretations exist for these high frequency timing features (for a review see van der Klis 2000 and references therein) which make definite predictions for . The relativistic precession model (RPM: Stella & Vietri 1998, 1999) is based on free test particle orbits around a compact object. This model identifies the ‘upper’ kHz QPO as the frequency of an orbit in the disc and the ‘lower’ kHz QPO with the periastron precession of this orbit. The RPM model predicts that the frequency separation decreases both when the kHz QPO frequencies increase (as observed), but also when they decrease to sufficiently low frequencies. In the sonic point beat frequency model (SPBFM: Miller, Lamb & Psaltis 1998) an orbiting clump at the sonic radius is related to the production of the upper kHz QPO and the beat between this clump and the NS spin frequency produces the lower kHz QPO. In this model should in principle be equal to the spin frequency, but can decrease when the upper kHz QPO increases due to the spiral-in of the clump. So, both theoretical models (RPM and SPBMF) can explain the observed decrease of with increasing QPO frequency. What evidence can constrain or test the validity of the models? The two models predict different behaviours of as the kHz QPO frequencies decrease: the RPM predicts a decrease of , while the beat frequency model predicts a steady or increasing (see e.g. discussion in Jonker et al. 2002) peak separation. In addition, Osherovich & Titarchuk (1999) developed the two-oscillator model in which explained the kHz QPOs as arising from oscillations of hot blobs thrown into the NS’s magnetosphere. They identify the lower kHz QPO frequency as the Keplerian frequency of the blob and the upper kHz QPO frequency as the radial oscillator mode frequency, a non linear function of the Keplerian frequency. This model also gives a relation between the lower and the upper kHz QPOs (dependent on the source; see e.g. Titarchuk, Osherovich & Kuznetsov 1999) which can be tested by observations.
In this Letter we present the timing analysis of recent observations of the LMXB 4U 1728–34. We find twin peaks with lower kHz QPO frequency as low as Hz, and the first indication for a significant decrease of the kHz QPO peak separation as the kHz QPO frequencies decrease. If confirmed, this evidence will strongly constrain theoretical models and, in particular, rule out the sonic point beat frequency model in its current formulation.
1.1 4U 1728–34
4U 1728–34 (GX 354–0; Forman et al. 1976) is a low-mass X-ray binary and type-I X-ray burster (Lewin 1976; Hoffman et al. 1976), identifying the accreting compact object as a neutron star. Hasinger & van der Klis (1989) classified 4U 1728–34 as an atoll-type X-ray binary. Strohmayer et al. (1996) found slightly drifting oscillations at Hz during X-ray bursts, interpreted as the spin frequency of the NS. At high frequencies the source shows kHz QPOs up to 1,200 Hz (Stromayer, Zhang & Swank 1997) often in pairs (lower and upper kHz QPOs). These pairs have a frequency separation almost constant at Hz (i.e. significantly lower than the spin frequency) for lower kHz QPOs between and Hz, decreasing significantly to Hz above Hz (Méndez & van der Klis 1999). No twin peaks with a lower kHz QPO frequency lower than Hz have been found in 4U 1728–34 until now.
2 Observations and data analysis
We have made timing analysis of 4U 1728–34 data from 1999 to 2002 performed using the Proportional Counter Array (PCA) instrument on the Rossi X-ray Timing Explorer (RXTE) satellite.
2.1 Colour-colour diagram
We have used Standard2 data of the Proportional Counter Unit 2 (PCU2, always on in all epochs) to produce the CD of all the observations available in the RXTE public archive (from 1996 to 2002). The soft colour and the hard colour are defined as the count rate ratio (3.5–6) keV/(2–3.5) keV and (9.7–16) keV/(6–9.7) keV, respectively. We have normalised the colours of 4U 1728–34 to the colours of the Crab calculated with the closest observation available to each 4U 1728–34 observation. In Fig. 1 we show the mean colours of all the observations of 4U 1728–34 (dots); squares are the observations (1996–1997) previously analysed by Di Salvo et al. (2000) and van Straaten et al. (2001); the circle marks the observation where we find significant kHz twin peaks (see below). Di Salvo et al. (2000) found a gap in the CD between the island state and the banana state. This gap was only due to lack of observations. We concentrate on the observations filling in this ‘gap’ in between island and banana, namely in the range 0.9–0.98 of the hard colour.

2.2 Timing analysis
For the production of the power spectra we have used event data with a time resolution of 125 s. We rebinned the data in time to obtain a Nyquist frequency of 4096 Hz. For each observation we created Leahy et al. (1993) normalised power spectra from segments of 16 s length. We removed drop outs and X-ray bursts from the data, but no background and deadtime corrections were performed. We averaged the power spectra and subtracted Poisson noise spectrum according to Zhang et al. (1995), shifted in power to match the spectrum between 3000 and 4000 Hz, where there should be no timing features. We then converted the power spectra to squared fractional rms. We have fitted the power spectra with a multi-Lorentzian model (for details see Belloni, Psaltis & van der Klis 2001 and references therein). The power spectra of the gap observations are fitted using one broad Lorentzian (Lb or Lb2) to represent the low frequency noise and the break frequency, one ( Lh) or two (Lb and Lh) narrower Lorentzians between Hz, a broad Lorentzian around 100 Hz (LhHz) and one (except two observations in which two are needed, i.e. with a single-trial significance ; see § 3) narrow Lorentzian to fit the upper kHz QPO Lu in the range Hz (see van Straaten, van der Klis & Méndez 2003 for details on terminology).

3 Results


Fig. 2 shows a typical power spectrum of the observations analysed, with the best-fit model. The upper kHz QPO is present in 46 out of 48 observations. The power spectra are consistent with those found around this position in the CD by Di Salvo et al. (2000) and van Straaten et al. (2001; see Fig. 1, panel 7 in van Straaten et al. 2001). In two observations, namely 50023-01-11-00 and 60029-02-02-00, we observe both the lower (Ll) and the upper kHz QPO. In 50023-01-11-00 Ll and Lu are single-trial significant (see § 3.1) at a 4.4 and 7.9 level, respectively. In 60029-02-02-00 the significance is 4.5 for the lower kHz QPO and 3.4 for the upper kHz QPO. Another observation (50023-01-31-00) shows a less significant () lower kHz QPO (the upper kHz QPO is significant at 10). In the observation 50023-01-11-00 (see Fig. 3) the centroid frequencies of the lower and the upper kHz QPOs are Hz and Hz, respectively. The peak separation is . In the observation 60029-02-02-00 the centroid frequencies of the lower and the upper kHz QPOs are Hz and Hz, respectively. The peak separation is . To check for frequency variations in the kHz peaks we divided observation 50023-01-11-00 in to four time segments and observation 60029-02-02-00 in to two segments, and analysed the power spectra of these segments. We note that 60029-02-02-00 is ‘naturally’ divided in two by an X-ray burst, hence in this case we have analysed the pre-burst and post-burst power spectra. No significant frequency variations are present in either observation.
3.1 Trials and significance of the kHz QPOs
The number of gap observations analysed (observations with the hard colour in the range 0.9–0.98 and with event data with a time resolution of 125 s) is 48. When we look for a timing feature, the probability of a statistical fluctuation in the power spectrum at a certain frequency increases with the number of trials, i.e. with the number of power spectra searched, and with the range of frequencies in which we expect the QPO. We estimate the total number of trials as number of power spectra . As reported in Fig. 3, in observation 50023-01-11-00 we have a very significant upper kHz QPO at 582 Hz. We expect the lower kHz QPO (which has a Hz) in an interval of frequencies of about 200 Hz. This leads to . single-trial significance means a chance probability of which multiplied by 48 trials and by 4.4 gives : the QPO is still significant at a level. The kHz QPOs at and Hz of the observation 60029-02-02-00 turn out to be only marginally significant, below . Therefore only one gap observation can be reported to show evidence of twin peaks in the power spectrum.
4 Discussion
We have analysed the observations of 4U 1728–34, filling in the ‘gap’ in the CD (found by Di Salvo et al. 2002) in between island and banana, namely in the range 0.9–0.98 of the hard colour (see Fig. 1). In one of these observation we find two significant kHz QPOs with a lower kHz QPO as low as 308 Hz (the lowest ‘lower’ kHz QPO ever found in this source). The lower kHz QPO has an amplitude of per cent (rms) and Q=; the upper kHz QPO has per cent rms and Q=. Do these features fit in the overall timing behaviour of the source? The amplitudes vs. of the kHz QPOs of 4U 1728–34 are shown in Fig. 1 of Méndez & van der Klis (2001). The lower and the upper kHz QPOs form two distinct traces in the plot; the upper kHz QPO we find fits perfectly in the upper kHz QPO trace. The lower kHz QPO appears discrepant, but there are no other lower kHz QPO measurements below kHz with which to compare.
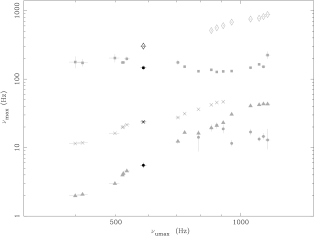
Comparison of the upper kHz QPO frequency with Q and amplitude of both the upper and lower kHz QPOs (see Fig. 4 in van Straaten et al. 2002) shows that all the parameters of these QPOs fit in the overall trend of the source. In Fig. 4 we show the characteristic frequency (see Belloni et al. 2001) of the upper kHz QPOs () as a function of the of all the other components used to fit the power spectra of 4U 1728–34. The grey points are from van Straaten et al. (2002) and the black points are from the observation 50023-01-11-00. The upper kHz QPO frequency of the observation 50023-01-11-00 is consistent with the correlations found with all the other components and in particular extend the Ll–Lu correlation (stars) to lower frequencies. The location of Ll at Hz is too high for a hHz QPO which in any case is separately detected (Fig. 3). Whether or not the ‘gap’ in the Ll–Lu correlation (diamonds in Fig. 4) between Hz is real must be further investigated. Clearly, bridging this gap would increase our confidence in the identification of the peak at Hz.
The peak separation of the kHz QPOs we have found ( Hz) is significantly lower than both the spin frequency as inferred by burst oscillations ( Hz; Strohmayer et al. 1996) and the ‘saturation’ value (at Hz) found by Méndez & van der Klis (1999) in the range Hz. In Fig. 5 we show the peak frequency separation as a function of the lower kHz QPO frequency. Black points are from Méndez & van der Klis (1999) and the open circle is our observation. The solid line indicates the frequency of the burst oscillations at 363.9 Hz (Strohmayer et al. 1996). This indicates a decrease of the peak frequency separation at low frequencies. This decrease is contrary to what is expected from the SPBFM, which predicts a steady or increasing peak frequency separation at low frequencies (see e.g. Fig. 2 in Lamb & Miller 2001). A clear prediction of a decrease of is made by the RPM. However, it seems that the decrease at low frequencies we find is steeper than the one predicted by the RPM: see e.g. Fig. 1 in Stella & Vietri (1999). We have also checked the relation between the upper and lower kHz QPOs as predicted by the two-oscillator model. We have used the values of the constant parameters of equation 15 in Osherovich & Titarchuk (1999) as determined by Titarchuk, Osherovich & Kuznetsov (1999) for 4U 1728–34. For a low frequency QPO of 308 Hz the two-oscillator model predicts an upper kHz QPO of Hz, much higher than the one observed.

Acknowledgements
SM would like to thank Steve van Straaten, Tiziana Di Salvo and Mariano Méndez for very helpful discussions. We would like to thank the anonymous referee for her/his comments and suggestions.
References
- [] Belloni T., Psaltis D., van der Klis M., 2002, ApJ, 572, 392
- [] Chakrabarty D., Morgan E.H., Muno M.P., Galloway D.K., Wijnands R.A.D., van der Klis M., Markwardt C.B., 2003, Nature, 424, 42
- [] Di Salvo, T., Méndez, M., van der Klis, M., Ford, E., Robba, N.R., 2000, ApJ, 546, 1107
- [] Ford E.C., van der Klis M., van Paradijs J., Méndez M., Wijnands R., Kaaret P., 1998, ApJ, 508, L155
- [] Forman W., Tananbaum H., Jones C., 1976, ApJ, 206, L29
- [] Hasinger G., van der Klis M., 1989, A&A, 225, 79
- [] Hoffman J.A., Lewin W.H.G., Doty J., Hearn D.R., Clark G.W., Jernigan G., Li F.K., 1976, ApJ, 210, L13
- [] Homan J., van der Klis M., Jonker P.G., Wijnands R., Kuulkers E., Méndez M., Lewin W.H.G., 2002, ApJ, 568, 878
- [] Jonker P.G., van der Klis M., Méndez M., 2002, MNRAS, 336, L1
- [] Lamb F.K., Miller M.C., 2001, ApJ, 554, 1210
- [] Leahy D.A., Darbro W., Elsner R.F., Weisskopf M.C., Kahn S., Sutherland P.G., Grindlay J.E., 1983, ApJ, 266, 160
- [] Lewin W.H.G., Clark G.W., Doty J., 1976, IAU Circ., 2922
- [] Markwardt C.B., Strohmayer T.E., Swank J.H., 1999, ApJ, 512, L125
- [] Méndez M., van der Klis M., 1999, ApJ, 517, L51
- [] Méndez M., van der Klis M., Wijnands R., Ford E.C., van Paradijs J., Vaughan B.A., 1998, ApJ, 505, L23
- [] Miller M.C., 1999, ApJ, 515, L77
- [] Miller M.C., 2000, ApJ, 531, 458
- [] Miller, M.C., Lamb, F.K., Psaltis, D., 1998, ApJ, 508, 791
- [] Muno M.P., Fox D.W., Morgan E.H., Bildsten L., 2000, ApJ, 542, 1016
- [] Osherovich V., Titarchuk L., 1999, ApJ, 522, L113
- [] Stella L. & Vietri M, 1998, ApJ, 492, L59
- [] Stella L. & Vietri M, 1999, Phys.Rev.Lett., 82, 17
- [] Strohmayer T.E., Zhang W., Swank J.H., 1997, ApJ, 487, L77
- [] Strohmayer T.E., Zhang W., Swank J.H., Smale A., Titarchuk L., Day C., Lee U., 1996, ApJ, 469, L9
- [] Titarchuk L., Osherovich V., Kuznetsov S., 1999, ApJ, 525, L129
- [] van der Klis M., 2000, ARA&A, 38, 717
- [] van der Klis M., Wijnands R.A.D., Horne K., Chen W., 1997, ApJ, 481, L97
- [] van Straaten S., van der Klis M., Di Salvo T., Belloni T., 2002, ApJ, 568, 912
- [] van Straaten S., van der Klis M., Méndez M., 2003, ApJ, in press
- [] Wijnands R.A.D. & van der Klis M., 1997, ApJ, 482, L65
- [] Wijnands R.A.D., van der Klis M., Homan J., Chakrabarty D., Markwardt C.B., Morgan E.H., 2003, Nature, 424, 44
- [] Zhang W., Jahoda K., Swank J.H., Morgan E.H., Giles A.B., 1995, ApJ, 449, 930