Optical Spectroscopy of IRAS 02091+6333††thanks: Based on observations at the Innsbruck 60cm telescope and the Flemish Mercator telescope on Roque de los Muchachos, Spain
We present a detailed spectroscopic investigation, spanning four winters, of the asymptotic giant branch (AGB) star IRAS 02091+6333. Zijlstra & Weinberger (ZW (2002)) found a giant wall of dust around this star and modelled this unique phenomenon. However their work suffered from the quality of the optical investigations of the central object. Our spectroscopic investigation allowed us to define the spectral type and the interstellar foreground extinction more precisely. Accurate multi band photometry was carried out. This provides us with the possibility to derive the physical parameters of the system. The measurements presented here suggest a weak irregular photometric variability of the target, while there is no evidence of a spectroscopic variability over the last four years.
Key Words.:
stars: AGB and post-AGB – stars: individual: IRAS 02091+6333 = GSC 04041-017431 Introduction
When Zijlstra & Weinberger (ZW (2002)) discovered a massive dust shell around the AGB star IRAS 02091+6333 they could use only a single quick look spectrum and the original TYCHO and magnitudes (Perryman et al. tycho (1997)) to estimate the spectral type and the interstellar extinction towards the target. The spectroscopic investigation was lacking comparison spectra obtained with the same instrument setup. Furthermore the TYCHO instrument was close to its sensitivity limits. Thus we obtained spectra and photometry of this unique object for several years to derive an accurate spectral type and the foreground extinction. This allowed us to determine more precisely the distance of the target for the modelling of the dust shell found on Infrared Astronomical Satellite (IRAS) images. Zijlstra & Weinberger (ZW (2002)) outline such shells for various types of objects at late stages of their evolution. Their focus was especially on a swept up shell with a void in the interstellar matter (ISM) around the target. This is crucial for both, the ”Swiss cheese” like structure of the ISM and for the hydrodynamic evolution of the planetary nebula (PN) built after this evolutionary stage.
We thus investigated the spectroscopic and photometric properties of the central star to provide new input for the complete model of this unique object and its surroundings.
2 Data
The spectroscopic data were obtained with the Innsbruck 60 cm telescope (Kimeswenger 60cm (2001); Bacher et al. bacher01 (2001)) and an OptoMechanics 10C spectrograph. A CompuScope Kodak 0400 CCD camera was attached to the spectrograph. In the year 2000 a grating with 600 l/mm was used, resulting in a resolution of 1 Å/pixel. Later a grating with 240 l/mm (2.6 Å/pixel) was mounted to achieve a better S/N ratio. The complete log of the observations is given in Table 1. The exposure times varied with the wavelength region from 300 to 900 seconds. Each spectrum is a composite of individual takes covering about 800 Å with the high resolution grating and 2000 Å with the medium resolution mode. The wavelength shifts were selected to obtain appropriate overlaps of at least 25% of the wavelength range. In most of the nights several spectra were obtained to improve the S/N and eliminate cosmic ray events. The positions along the slit and the starting wavelengths varied to eliminate possible systematic errors in the setup. Flatfield, bias subtraction and wavelength calibration were carried out in a standard manner with the help of MIDAS routines. For comparison the late type standard stars HD 23475 (M2IIb), HD 39801 (M2I), HD 13325(M3III), HD 40239 (M3II), HD 44478 (M3III), HD 42995 (M3III) HD 5316 (M4III) and HD 12292 (M5III) were observed with the medium resolution setup. The spectra were not calibrated absolutely, but only corrected for exposure time and airmass (with the atmospheric extinction given by Tüg extinct (1980)).
The wide band direct imaging in Innsbruck was obtained with an AP7p SITe 502e CCD device (Kimeswenger et al. 2002a ; Lederle & Kimeswenger CI (2003)). 24 images were taken in the nights of 10th and 11th of December 2002 with , , and filters. The exposure times were 30, 20, 10 and 10 seconds in , , and respectively. After standard basic CCD reduction the source extraction was performed using SExtractor V2 (Bertin & Arnouts sex (1996)). The rms of the comparison standards in the field was (, , and ). Absolute calibration was obtained in both nights using the standard stars HR 580 and HR 596. The rms variations of the zero-points were less than 003, resulting in an error of the mean zero-point of less than 0015.
| Date | mode | band / | resolution | |
|---|---|---|---|---|
| wavelength | sampling | eff.∗ | ||
| Å/pixel | Å | |||
| 05.02.2000 | spectra | 6000-9000Å | 1.0 | 6.2 |
| 15.01.2001 | spectra | 5000-10000Å | 2.6 | 10.6 |
| 18.01.2001 | spectra | 5000-10000Å | 2.6 | 10.6 |
| 11.02.2001 | spectra | 5440-10000Å | 2.6 | 9.9 |
| 15.02.2001 | spectra | 5000-8860Å | 2.6 | 8.6 |
| 16.02.2001 | spectra | 5440-8860Å | 2.6 | 8.0 |
| 06.03.2001 | spectra | 5440-8860Å | 2.6 | 10.7 |
| 08.01.2002 | spectra | 5600-10000Å | 2.6 | 13.4 |
| 09.01.2002 | spectra | 5000-9000Å | 2.6 | 14.1 |
| 10.12.2002 | imaging | BVRIC | ||
| 11.12.2002 | imaging | BVRIC | ||
| 17.01.2003 | spectra | 5000-10000Å | 2.6 | 17.1 |
∗ Effective resolution was measured as FWHM of night sky lines.
The long term monitoring of the target was done with the P7 photometer attached to the 1.2m Mercator telescope located at La Palma, using the 7 filters of the Geneva photometric system (Meylan & Hauck mercator (1981), Golay golay (1994)). The data was obtained and reduced within the framework of monitoring stars with constant airmass as described in Burki et al. (burki (1995)). The typical errors derived by the rms of the standard stars for the nights are below 001. The results are listed in Table 2.

3 Results
3.1 Spectroscopy
First the spectra were investigated with respect to variability. We cannot detect spectral variability (except in the region of the telluric water vapor bands longwards to 8000Å– see Fig. 1). Also individual equivalent widths of metal lines of the IR Ca II triplet and of Mg lead us to the same conclusion. Thus a composite spectrum was derived for the classification. The classification criteria of Kirkpatrick et al. (KP (1991)) were applied in the same way as described in Kimeswenger et al. (iras (2003)). This results in a spectral class of M4 - M5. The scheme of TiO indices (Malyuto et al. SK1 (1997)) argues for an M4.2III star. Applying the extension by Schmidt-Kaler & Oestreicher (SK2 (1998)) we obtain an M4III star with (). The relation of the TiO to the NaD and Mgb indices propose luminosity class III.
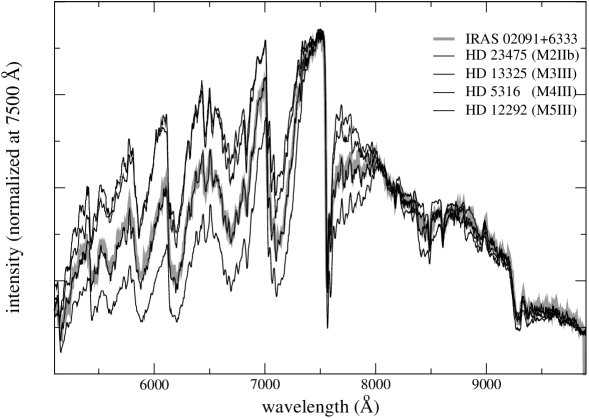
The most reliable classification is the direct comparison with standards, using the identical instrument setup. For this purpose eight comparison stars were taken during February 2001 and January 2003 between the target exposures with the same setup. Especially the TiO features at 7200-7400 Å and 7700-8000 Å are extremely sensitive to the effective temperature of the stars in that domain. The latter was not covered by the spectrum used by Zijlstra & Weinberger (ZW (2002)). The classification using such bands is completely independent of the correction for the atmospheric and interstellar extinction. The results are shown in Fig. 2. The target superimposes nearly exactly the M4III star HD 5316. The overlay gives us an exact solution for the interstellar extinction of .
We tried to use the line ratios of the IR CaII triplet of the comparison stars and those of the target - all taken with the same instrument setup. But not even for the comparison stars, having a much better S/N ratio than the target, the effective resolution (see Table 1) allow to derive useful separations between luminosity class III and II.
3.2 Photometry and Distance
| MJD | weight | |||||||
|---|---|---|---|---|---|---|---|---|
| 52103.63730 | 10.445 | 15.647 | 12.027 | 13.638 | 13.011 | 11.298 | 11.281 | 4 |
| 52103.68906 | 10.452 | 15.540 | 12.039 | 13.646 | 12.995 | 11.291 | 11.281 | 4 |
| 52104.67404 | 10.450 | 15.643 | 12.017 | 13.615 | 13.007 | 11.287 | 11.286 | 3 |
| 52111.70459 | 10.380 | 15.416 | 11.965 | 13.585 | 12.948 | 11.232 | 11.214 | 1 |
| 52205.54382 | 10.427 | 15.637 | 12.030 | 13.637 | 13.035 | 11.281 | 11.267 | 2 |
| 52299.37930 | 10.421 | 15.427 | 12.045 | 13.700 | 13.010 | 11.280 | 11.261 | 3 |
| 52299.42229 | 10.419 | 15.806 | 12.060 | 13.690 | 12.997 | 11.257 | 11.253 | 3 |
| 52500.69875 | 10.458 | 15.606 | 12.055 | 13.659 | 13.082 | 11.304 | 11.297 | 2 |
| 52501.69090 | 10.453 | 15.472 | 12.047 | 13.676 | 13.067 | 11.306 | 11.286 | 2 |
| 52502.69127 | 10.447 | 15.714 | 12.047 | 13.680 | 13.022 | 11.303 | 11.278 | 2 |
| 52505.64131 | 10.434 | 15.573 | 12.027 | 13.634 | 13.034 | 11.276 | 11.254 | 3 |
| 52506.69780 | 10.421 | 15.552 | 12.026 | 13.650 | 13.018 | 11.279 | 11.258 | 3 |
| 52508.69154 | 10.430 | 15.629 | 12.040 | 13.676 | 13.017 | 11.262 | 11.264 | 2 |
We have searched literature and telescope archives for photometry, but found in the optical and in the MIR-FIR only those mentioned already in Zijlstra & Weinberger (ZW (2002)) – namely TYCHO in the optical, Midcourse Space Experiment (MSX, Egan et al. msx (1999)) and IRAS in the infrared. The results of our photometry, together with results from literature are collected in Table 3. For the flux to magnitude conversion for IRAS we used the results of Wainscoat et al. (SKY (1992)) and for MSX that of Cohen et al. (cohen (2000)). The calibration of IRAS by Hickman et al. (hickman (1995)) was not taken into account, as the MSX and the IRAS 12 m fluxes gave differences of about 040 for all M type comparison stars here. For the TYCHO measurements we applied the color equations as given in the catalogue: and .
During the reviewing process of this work, the 2MASS NIR data was made public. Although we listed the values in Table 3, they were not useful, as the target was overexposed even in the short 53 ms preexposure of the survey. We thus didn’t include these values in our interpretation.
| date | band | mag. | quality | ref. |
|---|---|---|---|---|
| or error | ||||
| 10./11.12.2002 | 12607 | 0014 | here | |
| 10519 | 0009 | here | ||
| 9077 | 0004 | here | ||
| 7309 | 0019 | here | ||
| 1989 | 1222 | 023 | TYC-1 | |
| 1041 | 005 | TYC-1 | ||
| 1246 | 023 | TYC-2 | ||
| 1037 | 005 | TYC-2 | ||
| January 2000 | 1255 | ? | [1] | |
| 105 | ? | [1] | ||
| 95 | ? | [1] | ||
| 74 | ? | [1] | ||
| January 2001 | 117 | ? | [1] | |
| 101 | ? | [1] | ||
| 93 | ? | [1] | ||
| 73 | ? | [1] | ||
| 5.1.1999 | 5326# | 003 | 2MASS | |
| 4350# | 029 | 2MASS | ||
| 4034# | 034 | 2MASS | ||
| 1995 | 8.3 | 380 | qal 4 | MSX |
| 14.6 | 29 | qal 1 | MSX | |
| 1983 | 12 | 376 | qal 3 | IRAS |
| 25 | 355 | qal 3 | IRAS |
| [1] | Zijlstra & Weinberger (ZW (2002)) |
|---|---|
| # | The 2MASS data is flagged in the data base as |
| ”radial profile fitting of overexposed source” and | |
| ”profile fit very poor”. |

The first TYCHO catalogue (Perryman et al. tycho (1997)) and the reanalysis of the same data in TYCHO-2 (Høg et al. tycho2 (2000)) give completely different results for the band. The band differs considerably more than the error given in the catalogue. Thus we assume the error to be significantly higher. For further analysis we use the TYCHO-2 values.
The Mercator monitoring (Fig. 3) clearly shows an
irregular variability with an amplitude below 01 in .
On the other hand the variation between our measurements, those of
the amateur observations reported in Zijlstra & Weinberger
(ZW (2002)) and TYCHO-2 in the optical give an amplitude of some
tenths of a magnitude. The ( - )
value (15% and 85% of the 228 photometric transits) given in
TYCHO-2 is 171. But we assume the latter is mainly due to the
limits of the experiment.
The MSX and IRAS measurements together with the spectroscopic
stability lead us to the conclusion that the object seems to be
very stable in the effective temperature. That fact limits the
optical photometric amplitude to those found in the Mercator
monitoring. Such small variations seem to be usual for late type
stars around the tip of the first giant branch (Ita et al.
ita (2002)).
The colors (-)0 = 115 and (-)0 = 268 indicate a M4.5III MK class (Drilling & Landolt
allen (2000)). Using our photometry and the color equations above
we receive . Cohen et al. (cohen (2000))
are announcing 521, 558 and 602 for M3, M4 and M5
respectively, which is also consistent with the classifications
found above. The Mercator monitoring was not used for the colors,
as this system is lacking investigations, absolute calibrations
and color equations for very late type stars (Meylan &
Hauck mercator (1981), Moro & Munari asiago (2000)).
We
derived, again using TYCHO, MSX measurements and HIPPARCOS
parallaxes, the spectral energy distributions (SED) for M3-5
giants from our spectroscopic sample and from those one of
van Belle et al. (belle (1999)). The latter is a sample of stars
investigated in detail with interferometers for the determination
of accurate size and luminosity of late type stars. Two stars –
namely HD 13325 (M3III) and HD 5316 (M4III) – overlap between
their and our sample. One can clearly see in Fig. 4 the
broad band mid-IR flux hardly varies between M3 and M4 stars. Only
M5 stars have a significant different SED. We thus fit our target
between the M4 stars of the sample. This provides us with (using
all bands) a distance of 1020 pc. The HIPPARCOS errors for the
bright comparison stars and the uncertainties from the photometry
of the target results in a lower limit of 870 pc and an upper one
of 1150 pc. The luminosity derived from the spectroscopy and the
photometry give us 920 pc. According to van Belle et al.
(belle (1999)) for there is no correlation with
the effective temperature anymore. Thus
this band, lacking here, would deliver us no additional information.

3.3 Astrometry
The target was suspected to have a relatively high proper motion in the TYCHO catalogue, although the positional error given there is very high. We thus tried to derive a value for the proper motion in the same way as in Kimeswenger et al. (2002b ) by using the six sky survey plates of the region. But as the target is extremely overexposed and lies near the corner of the POSS-E (1952 and 1993) and of the Quick-VN (1983) plates, we cannot derive a proper solution. The accuracy is about the same as in the the TYCHO experiment. Kislyuk et al. (fonac (1999)) give similar numbers in their online version, using their plate from 1983 and the AC2000 catalogue position from 1905 (Urban et al. ac2000 (1997)). But forwarding the errors in both catalogues to the resulting proper motion we again end up with large error bars (12 mas yr-1). The direction of the motion vector is co-lined with the TYCHO result, suggesting a genuine movement which leads to a motion of about 60 km s-1 relative to the surrounding stellar field after subtracting the galactic rotation for a distance of about 1 kpc (only about 1.5 mas yr-1). This is, although still possible, very high for galactic disk stars. The vector is almost opposite to the galactic rotation parallel to the galactic plane. Further investigations about the population membership are needed.
4 Conclusions
| spectral type | M4±0.3 III |
|---|---|
| Teff | 3350±50 K |
| type of photometric variability | irr. or SR |
| 1052±0.03 | |
| interstellar | |
| visual amplitude | 01 |
| MV | 05 |
| Mbol | 265 |
| distance | pc |
| luminosity | L⊙ |
The precise spectroscopic classification of the central star IRAS 02091+6333 of the unique giant dust shell reported in Zijlstra & Weinberger (ZW (2002)) allowed us to derive a more accurate distance of the target. This leads us to a somewhat higher mass estimate of 5.2 M⊙ and a size of 1.8 1017 m (5.2 pc) and thus even enlarges the discrepancy in lifetime as discussed in section 3.3 of Zijlstra & Weinberger (ZW (2002)) and therefore clearly excludes the scenario of the mass originating mainly from the star itself. This result is strengthened by the fact of the lower luminosity we derived (40% below the one estimated there). The star lies in the evolutionary tracks (Girardi et al. 2000a ) nearby the red giant branch tip and rather far from the TP-AGB. The small irregular photometric variability fits well to this assumption (Ita et al. ita (2002)). So the model of the swept up ISM is strongly supported by our measurements. The fast movement, although uncertain, may shorten the timescales for the bubble. This may suggest a wind having a higher momentum. One can only speculate on the origin of this additional source of energy. There is no signature in the spectroscopy for a hot companion causing a symbiotic Mira. Also Schmeja & Kimeswenger (schmeja (2001)) have shown that those objects have clear signatures in their NIR and MIR bands.
IRAS 02091+6333 has a distance of pc, a luminosity of L⊙ and, according to van Belle et al. (belle (1999)), an effective temperature of K. Both the spectroscopy as well as the photometric consistency of the colors with the MK type from visual to IR bands suggest there is currently no dominant circumstellar shell material. Girardi et al. (2000b ) discussed inhomogeneities in the tracks and in the evolution due to different He-core burning phases. It affects slightly the luminosity (and thus the distance) but hardly the photometric colors (Girardi et al. 2000a ). This adds some uncertainties to the values derived for individual sources.
Acknowledgements.
We thank the colleagues of the institute for the unlimited access to the facilities of the new university observatory in Innsbruck. The staff of the ’Instituut voor Sterrenkunde’, KULeuven is acknowledged for the photometric monitoring at the Mercator facilities and the staff of the Geneva observatory is acknowledged for the photometric reductionReferences
- (1) Bacher, A., Lederle, C., Grömer, G., Kapferer, W., Kausch, W., Kimeswenger, S. 2001, IBVS, 5182
- (2) van Belle, G. T., Lane B. F., Thompson R. R., et al. 1999, AJ, 117, 521
- (3) Bertin, E., & Arnouts, S. 1996, A&AS, 117, 393
- (4) Burki, G., Rufener F., Burnet, M., Richard, C., Blecha, A., Bratschi, P. 1995, A&AS, 112, 383
- (5) Cohen, M., Hammersley, P. L., Egan, M. P. 2000, AJ, 120, 3362
- (6) Drilling, J. S., & Landolt, A. U. 2000, in Allen’s astrophysical quantities, 4th ed. Publisher: New York: AIP Press; Springer, 2000. Edited by A. N. Cox. , p381
- (7) Egan, M. P., Price, S. D., Moshir, M. M., et al. 1999 The Midcourse Space Experiment Point Source Catalog, Version 1.2, Air Force Research Lab. Technical Rep. AFRL-VS-TR-1999-1522
- (8) Girardi, L., Bressan, A., Bertelli, G., Chiosi, C. 2000a, A&AS, 141, 371
- (9) Girardi, L., Mermilliod, J.-C., Carraro, G. 2000b, A&A, 354, 892
- (10) Golay, M. 1994, in The MK process at 50 years, Proceedings of a Workshop of the Vatican Observatory, held in Tucson Arizona, USA, San Francisco: Astronomical Society of the Pacific (ASP), eds. C. Corbally, R.O. Gray, & R.F. Garrison, p.164
- (11) Hickman, M. A., Sloan, G. C., Canterna, R. 1995, AJ, 110, 2910
- (12) Høg, E., Fabricius, C., Makarov, V. V., et al. 2000, A&A, 355, L27
- (13) Ita, Y., Tanabé, T., Matsunaga, N., et al. 2002, MNRAS, 337, 31L
- (14) Kislyuk, V., Yatsenko, A., Ivanov, G., Pakuliak, L., Sergeeva, T. 1999, The FON Astrographic Catalogue, Main Astronomical Observatory of National Academy of Science of Ukraine
- (15) Kimeswenger, S. 2001, AGM, 18, 251
- (16) Kimeswenger, S., Lederle, C., Schmeja, S., Armsdorfer, B. 2002a, MNRAS, 336, L43
- (17) Kimeswenger, S., Schmeja, S., Kitzbichler, M. G., Lechner, M. F. M., Mühlbacher, M. S., Mühlbauer, A. D. 2002b, IBVS, 5233
- (18) Kimeswenger, S., Lederle, C., Armsdorfer, B., Pritchard, J. 2003, Rev. Mex. Astron. Astroph., 39, 33
- (19) Kirkpatrick, J. D., Henry, T. J., McCarthy Jr., D. W. 1991, ApJS, 77, 417
- (20) Lederle, C., & Kimeswenger, S. 2003, A&A, 397, 951
- (21) Malyuto, V., Oestreicher, M. O., Schmidt-Kaler, Th. 1997, MNRAS, 286, 500
- (22) Meylan, G., & Hauck, B. 1981, A&AS, 46, 281
- (23) Moro, D., & Munari, U. 2000, A&AS, 147, 361
- (24) Neugebauer, G., & Leighton, R. B. 1969, NASA SP, Washington: NASA
- (25) Perryman, M. A. C., & ESA 1997, The Hipparcos and Tycho catalogues. Astrometric and photometric star catalogues derived from the ESA Hipparcos Space Astrometry Mission, Publisher: Noordwijk, Netherlands: ESA Publications Division, ESA SP-1200
- (26) Schmeja, S., & Kimeswenger, S. 2001, A&A, 377, L18
- (27) Schmidt-Kaler, Th., & Oestreicher, M.O. 1998, AN, 319, 375
- (28) Tüg, H. 1980, A&A, 82, 195
- (29) Wainscoat, R. J., Cohen, M., Volk, K., Walker, H. J., Schwartz, D. E. 1992, ApJS, 83, 111
- (30) Urban, S.E., Corbin, T.E., Wycoff, G.L. 1997, The ACT Reference Catalog, U.S. Naval Observatory, Washington D.C.
- (31) Zijlstra, A., & Weinberger, R. 2002, ApJ, 572, 1006