Does GRS 1915+105 exhibit ”canonical” black-hole states?
Received :
)
We have analysed data of the superluminal source GRS 1915+105 in order to investigate if, despite its extreme variability, it also exhibits the canonical source states that characterise other black-hole candidates. The phenomenology of GRS 1915+105 has been described in terms of three states (named A, B and C) based on their hardness ratios and position in the colour-colour diagram. We have investigated the connection between these states and the canonical behaviour and found that the shape of the power spectral continuum and the values of the best-fit model parameters to the noise components in all three states indicate that the source shows properties similar to the canonical very high state.
Key Words.:
stars: individual: GRS 1915+105 binaries: close – X-rays: binaries – accretion: accretion disc1 Introduction
Black-hole candidates are observed to go through different states (van der Klis 1995, Tanaka & Shibazaki 1996, Liang 1998). The source state is defined by certain combinations of the value of the model parameters that are used to account for the X-ray timing and spectral properties. Since similar combinations of the spectral and timing parameters are seen in most black-hole systems the term ”canonical” has been coined to designate those states that are common to many systems (Miyamoto et al. 1992). The four canonical states, in addition to quiescence, that have been recognised are distinguished by the presence or absence of a soft component, normally modelled as a multi-colour black body component at energies below 5 keV (Mitsuda et al. 1984 but see Merloni et al. 2000), by the luminosity and spectral slope of the emission at higher energies and by the different shapes and characteristic frequencies of the QPO and noise components. These are the low/hard (LS; Tananbaum et al. 1972), intermediate (IS; Belloni et al. 1997c, Méndez and van der Klis 1997, Belloni et al. 1996), high/soft (HS; Tananbaum et al. 1972) and very high states (VHS; Miyamoto et al. 1991, Ebisawa et al. 1994). Recent work (Rutledge et al. 1999, Homan et al. 2001) has shown that the intermediate state (IS) and the very high state (VHS) most likely represent the same state. Initially, these states were simply distinguished because in time the IS occurred in transitions between the low state (LS) and the high state (HS). The same spectral and timing properties seen at a count rate above that of the HS in a given source were called VHS properties. However, since the VHS can be found at different flux levels there is no need for two separate states.
GRS 1915+105 displays an extraordinary richness in variability, with regular and stable behaviour interspersed with flaring activity. Belloni et al. (2000, hereafter B00) analysed a large set of observations of GRS 1915+105 and classified them in 12 separate classes, based on their light curves and colour-colour diagram (one more class was identified by Klein-Wolt et al. 2002). Despite this complex X-ray behaviour the variability of the source can be understood as transitions between three basic states: states A and B exhibit a soft spectrum, state B having a higher count rate and a slightly harder spectrum than state A. State C is characterised by a low count rate and hard spectrum (B00, see also Markwardt et al. 1999). The transitions between these states can be very fast (seconds). States A and C may appear as short ( 100 s) or long (days) intervals. In contrast, the source never stays in the B state for more than a few hundreds of seconds. Ten of the twelve classes are characterised by repeating patterns of transitions between two, or all three, of the states. There are, however, two classes, class and which do not show state transitions (B00). They are characterised by the absence of large amplitude variations or patterned variability. Class is associated with state A only and class shows characteristics exclusively of state C. The purpose of this paper is to investigate whether we can establish, observationally, a relation between the three states observed in GRS 1915+105 and the ”canonical” states of other black-hole systems. A timing analysis of some of these classes and the implications on various corona models has recently been presented by Ji et al. (2003).
| Obs. | Date | Obs. | State/ | rmsd | FWHM | rmsQPO | (dof) | ||||
| num. | 1996 | IDa | class | (Hz) | (Hz) | (Hz) | |||||
| 1 | May 21 | I-08-00 | B | 9.5 | 1.530.03 | - | - | - | - | - | 1.49(97) |
| 2 | May 26 | I-10-00 | BAc | 9.0 | 1.120.03 | 5.50.4 | 2.10.2 | - | - | - | 1.67(95) |
| 3 | May 29 | I-09-00 | A | 7.0 | 0.85 fix | 8.01.0 | 1.40.1 | 2.110.05 | 2.20.2 | 4.10.2 | 1.90(119) |
| 4 | May 31 | I-11-00 | A | 7.6 | 1.080.04 | 13.01.0 | 2.40.3 | 1.920.03 | 1.60.2 | 3.40.1 | 1.53(106) |
| 5 | Jun 5 | I-12-00 | A | 8.9 | 1.200.03 | 9.10.7 | 2.60.2 | 1.570.06 | 1.40.2 | 3.60.1 | 1.36(108) |
| 6 | Jun 7 | I-13-00 | A | 9.7 | 1.250.08 | 8.81.0 | 2.70.4 | 1.480.06 | 1.50.2 | 4.30.3 | 1.33(108) |
| 7 | Jun 12 | I-14-00 | B | 13.1 | 1.350.03 | 2.20.2 | 2.00.1 | - | - | - | 1.72(95) |
| 8 | Jun 22 | I-17-01/02 | A | 10.7 | 1.340.05 | 9.60.6 | - | 1.200.07 | 2.00.2 | 5.40.3 | 1.48(110) |
| 9 | Jun 25 | I-18-00 | A | 10.3 | 1.300.07 | 8.01.0 | - | 1.400.15 | 1.60.5 | 4.30.6 | 0.84(108) |
| 10 | Jun 29 | I-19-00/01/02 | A | 5.3 | 1.130.02 | - | - | 1.980.07 | 0.5 fixed | 1.78(114) | |
| 11 | Jul 3 | I-20-00/01 | A | 7.5 | 1.070.02 | 9.81.2 | 1.80.2 | 1.660.06 | 0.4 fixed | 1.38(145) | |
| 12 | Jul 11 | I-22-00 | C | 13.3 | 0.060.03 | 1.720.07 | 2.70.2 | 3.480.01 | 0.400.03 | 10.10.2 | 1.75(124) |
| 13 | Jul 14 | I-23-00 | C | 13.8 | 0.160.02 | 1.780.09 | 2.60.04 | 3.560.01 | 0.440.03 | 10.60.2 | 1.98(124) |
| 14 | Jul 16 | I-24-00 | C | 15.9 | 0.290.02 | 2.610.12 | 2.720.03 | 2.430.01 | 0.330.03 | 10.90.2 | 4.62(124) |
| 15 | Jul 19 | I-25-00 | C | 17.3 | 0.200.05 | 2.760.08 | 3.120.05 | 1.120.01 | 0.170.01 | 12.20.2 | 2.50(124) |
| 16 | Jul 26 | I-27-00 | C | 16.9 | 0.150.02 | 1.380.02 | 2.530.01 | 0.630.01 | 0.070.01 | 9.50.3 | 1.67(124) |
| 17 | Aug 3 | I-28-00 | C | 17.4 | 0.250.02 | 2.120.04 | 2.730.01 | 0.960.01 | 0.120.01 | 11.10.2 | 2.34(124) |
| 18 | Aug 10 | I-29-00 | C | 16.8 | 0.170.05 | 3.650.05 | 3.110.05 | 1.850.01 | 0.300.03 | 12.30.2 | 3.33(124) |
| 19 | Aug 18 | I-30-00 | C | 13.9 | 0.380.04 | 2.120.10 | 2.110.05 | 5.200.02 | 1.100.10 | 6.60.7 | 1.71(122) |
| 20 | Aug 25 | I-31-00 | C | 13.7 | 0.230.02 | 1.590.05 | 2.070.06 | 3.970.02 | 1.090.05 | 10.20.2 | 2.58(124) |
| 21 | Aug 31 | I-32-00 | C | 15.9 | 0.270.02 | 1.550.05 | 1.90.1 | 5.990.04 | 2.150.14 | 5.00.1 | 5.05(144) |
| 22 | Sep 7 | I-33-00 | C | 16.5 | 0.330.04 | 0.910.04 | 2.20.2 | 5.360.03 | 1.140.07 | 5.30.1 | 3.24(139) |
| 23 | Oct 7 | I-38-00 | B | 6.9 | 1.580.06 | - | - | - | - | - | 1.63(133) |
| 24 | Jun 18b | K-33-00 | B | 13.3 | 1.500.02 | - | - | - | - | - | 1.90(96) |
| 25 | Sep 5b | K-45-02 | A | 10.9 | 1.580.06 | - | - | - | - | - | 2.32(135) |
| : I stands for 10408-01 and K for 20-402-01 | |||||||||||
| : Year 1997 | |||||||||||
| : It contains a smooth transition between A and B | |||||||||||
| : Obtained from the best-fit model in the frequency range 0.01–20 Hz | |||||||||||
2 Observations
We have chosen PCA observations that represent the three basic states of B00. These three states occur for various durations in the large number of variability classes. The fourth column of Table 1 indicates from which class the basic states were extracted. Obs. 2 contains a smooth transition between state A and B, virtually impossible to separate. If one arbitrary cuts the AB interval into two halves and assumes that one half represents state A and the other half state B then the results of the spectral fitting for both states agree within the errors. All three states show variations in count rate by a factor of two over the time analysed in this work. However, on average state B is brighter than state C and it, in turn, is brighter than state A.
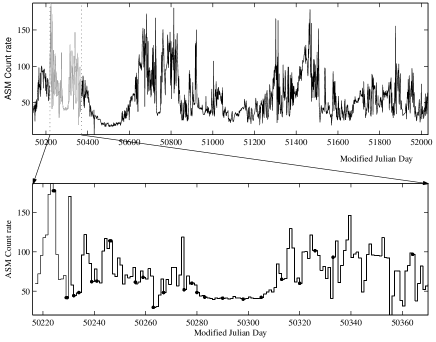
Figure 1 shows the one-day average All Sky Monitor (ASM) light curve of GRS 1915+105. The period covered by the observations is marked by two dotted lines in the upper panel. An enlargement of that interval is shown in the lower panel. The dots represent the initial time of the individual observations.
A soft (HR1) and a hard (HR2) X-ray colour were defined as the ratio of the intensity 5-13 keV over 2-5 keV and 13-60 keV over 2-5 keV, respectively. The colour-colour diagram (CD), shown in the upper panel of Fig. 2, clearly separates the observations in three branches which correspond to each one of the states. Different symbols represent the different states: circles for A, squares for B and triangles for C. The short state A (Obs. 25) is marked by an filled circle and Obs. 2, which contains a transition between states A and B by a filled square. The dashed lines show the positions corresponding to model spectra that generally describe the energy spectrum (disk-blackbody and power law, see B00 for a description of the CD). The points along the disc-blackbody (DBB) line represent steps of 0.1 keV in . The points along the power law (PL) line correspond to changes in photon index by steps of 0.1. The absorption was fixed to cm-2. The pattern traced by GRS 1915+105 in the CD is reminiscent of the comb-like structure reported by Homan et al. (2001, Fig. 3) for XTE J1550–564. The main difference is that the points in the hard branch lie above the power-law line and not below as in XTE J1550–564. This could be due to a higher disk blackbody temperature.


3 Power spectra
Power spectra were obtained by dividing the light curves into 256-s segments and calculating the Fourier spectrum of each segment. The time resolution was 1/512 seconds, giving a Nyquist frequency of 256 Hz. Given the shorter duration of the B-state and short A-state observations 16-s segments were used in those cases. Only photons with energies in the range 2–13 keV (PCA channels 0–34, PCA epoch 3) were accumulated. Finally, the power spectra of each segment were averaged together and logarithmically rebinned to produce one power spectrum for each observation.
The power spectrum of the observations in the soft branch (state A) is characterised by a strong red-noise component (Fig. 3). However, a single power-law function does not fit the data well. Instead, a broken power law plus one Lorentzian component with frequency in the range 1–3 Hz are required. The peaked noise is normally accompanied by one harmonic. In Obs. 3-4, an extra broad component at around 0.07 Hz is needed in order to obtain an acceptable fit. The central frequency of the main peaked noise component decreased with time from 2 Hz to 1 Hz. The Q-value (the central frequency divided by the FWHM) was , that is, lower than the generally accepted value of 2 to be considered as a QPO. The break frequency is always above the peak frequency and varies in the range 8-13 Hz. In this state as the 2–13 keV count rate increased, the fractional root-mean-squared (rms) amplitude in the frequency range 0.01–20 Hz increased as well. The power spectrum of the short A state can be fit by a single power law, i.e., with no break. The power spectrum of the B state is qualitatively similar to that of state A (Fig. 3), although no broad Lorentzian component is required.
In the hard branch (state C), the power spectra contain a strong band-limited noise component together with one QPO peak (occasionally with some harmonics) in the frequency range 0.01–10 Hz (Fig. 3). The power spectrum is flat below the QPO frequency and steepens to a power law above the QPO frequency. As the 2–13 keV count rate increases, the frequency of the QPO increases and its amplitude (rms) decreases. As the source becomes harder the rms amplitude increases whereas the QPO frequency decreases. As in state A a broken power law describing the continuum and one or two Lorentzians modelling the QPO feature and its harmonics were used to fit the power spectra. The value of the break frequency is lower in state C (1–4 Hz) than in state A (8–13 Hz). Table 1 shows the results of the power spectral fits.
| Parameter | LS | HS | VHS | State A | State B | State C |
|---|---|---|---|---|---|---|
| (keV) | 1 | 1-2 | 1.8 | 2.2 | 3–4 | |
| 1.5–2 | 2–3 | 3.5 | 3.1 | 1.5–2.5 | ||
| Noisec | FT | PL | FT & PL | PL | PL | FT |
| 1 Hz | - | 1 Hz | 1–3 Hz | - | 10 Hz | |
| rms | 30–50% | 3% | 1–15% | 5–10% | 5–10% | 10–20% |
| QPO | no | no | 1–10 Hz | no | no | 1–10 Hz |
| radio | jet | no | bright | weak | weak | jet |
| : Temperature of the disc blackbody component | ||||||
| : Power-law index of the hard spectral component | ||||||
| : Type of noise in the PDS: FT stands for flat-top and PL for power law | ||||||
4 Connection with canonical states
From the point of view of the timing analysis the power spectra of states A and B are almost indistinguishable and very similar to the power-law like power spectrum of other black-hole candidates that have gone through the VHS: GX 339-4 (Miyamoto et al. 1991), GS 1124–68 (Miyamoto et al. 1994; Takizawa et al. 1997), GRO J1655–40 (Méndez et al. 1998). The red- and peaked-noise components and an amplitude of variability in the range 7–10% are all properties of the VHS, when the energy spectrum is soft. As the source becomes harder, i.e, as the source enters the C state, QPOs in the frequency range 1–10 Hz and flat-top noise show up in the power spectra. The shape of the power spectra now resembles that of Cyg X–1 (Belloni et al. 1996), GRO J1655–40 (Méndez et al. 1998), XTE J1748–288 (Revnivtsev et al. 2000) in a IS/VHS.
The GRS 1915+105 observations of June 29 and July 3 present the lowest HR1 ratio (), i.e. they show the softest energy spectrum, among all the observations in this paper. In these two observations the source shows characteristics that approach that of the HS: GRO J1655–40 (Méndez et al. 1998), GS 1124–68 (Miyamoto et al. 1993) or GX 339–4 (Belloni et al. 1999), namely, a weak noise component, the absence of QPO, soft spectrum and red noise in the form of a power law. However, the fact that the source never reaches the disc blackbody curve (Fig. 2) and that the rms amplitude is still rather high (5-7%) preclude the association of these observations with the canonical HS.
Although the properties of the radio emission have not been traditionally used to define the source states it is worth pointing out that in state C, GRS 1915+105 is a source of strong radio emission (Naik & Rao 2000; Muno et al. 2001, Klein-Wolt et al. 2002). In this state the optically thick radio emission has been shown to originate in a compact jet (Dhawan et al. 2000). Since radio jets in black-hole candidates have been detected in the LS only (Fender 2001), one may wonder whether state C of GRS 1915+105 resembles the canonical LS. The answer is that neither the fractional rms, QPO frequency or break frequency of the flat-top noise component that characterise state C in GRS 1915+105 lie in the range of those found in the canonical LS: the frequencies are too high and the rms amplitude too low.
5 Discussion
GRS 1915+105 is unusual among black-hole systems because of its extreme variability (B00 and references therein) and its long periods of X-ray activity. GRS 1915+105 was discovered as an X-ray transient (Castro-Tirado et al. 1994) but it has been detected persistently since then. Permanent X-ray emission is a characteristic of black-hole binaries with massive companions (Cyg X–1, LMC X–1 and LMC X–3). In contrast, all confirmed low-mass black-hole binaries are transients. GRS 1915+105 contains a K-MIII star (Greiner et al. 2001).
A proposed model for the interpretation of the X-ray variability involves the disappearing and subsequent refilling of the inner region of an accretion disk due to the onset of a thermal/viscous instability (Belloni et al. 1997a; 1997b). This effect, not observed in other sources on similarly short time scales, led B00 to define three states, A, B and C based on the X-ray hardness of the source and its position in the colour-colour diagram. State C was interpreted as corresponding to the unobservability of the inner portion of the accretion disc, whereas in states A and B the disc would be seen up to the last stable orbit. The association of the flat-top power spectrum of GRS 1915+105 (state C) with the canonical VHS has already been suggested (Morgan et al. 1997; Paul et al. 1997), although the notion of state C came only later. States A and B have not been explored as such and their timing association with black hole states is new.
In Table 2 a comparison of the timing and spectral parameters of each state in GRS 1915+105 with respect to average values found in other black-hole systems is presented. The properties of states A and B agree well with the canonical VHS even though they do not exhibit proper low-frequency QPOs (in the sense of having a Q-value greater than 2). State C, which does show QPOs, shows a prominent thermal component and strong radio emission. Also, the power spectrum is power-law like for states A and B and flat-top like for state C. No correlation is found between the shape of the noise and the count rate. These relatively rapid changes (hours to days) of the continuum of the power spectrum of GRS 1915+105 have been seen in other systems. During a VHS the power spectrum of GX 339–4 (Miyamoto et al. 1991) and of GS 1124–683 (Miyamoto et al. 1993, Takizawa et al. 1997) manifested two different shapes according to the fraction of X-ray photons in the power-law energy spectral component. A flat-top shape was obtained when there was a substantial amount of counts contributing to the power-law in the energy spectrum. When this component was weak the power spectra turned into a power-law shape, that is, the same behaviour as in GRS 1915+105.
If one looks into the current models that have been put forward to explain the phenomenology of the spectral states in black-hole candidates, it is possible to understand why GRS 1915+105 is not so different from other ”well-behaved” systems. Although no current model can explain the whole phenomenology of this type of systems, it is suggested that in the LS the accretion disc stops at a certain distance from the black hole, whereas in the HS the disc extends all the way to the last stable orbit (Chen & Taam 1996; Esin et al. 1997; Zhang et al. 1997). States A and B, being associated with the observability of the entire disc, can be identified with high-flux states, i.e., the VHS. Likewise, given that state C corresponds to the lack of the inner part of the accretion disc, is perhaps not surprising that it presents some similarities with the canonical LS. The fact that the canonical HS is not seen in either of the three states implies that the power-law tail, whose absence characterises the HS energy spectra of black-hole systems at higher energies, must always play a strong role in GRS 1915+105. In short, as in canonical sources the variations in the value of the innermost radius of the accretion disc determine the transition between the states. However, in GRS 1915+105 these variations move all in the range of the VHS.
6 Conclusion
The analysis of the aperiodic variability and spectral hardness of GRS 1915+105 reveals canonical behaviour but also a number of peculiar properties compared to other black-hole candidates. The source spends most of its life in a sort of very high state, showing complex variability. Occasionally, it transits to a hard, but not necessarily low state where the flux remains stable and no patterned variability is seen, and where the source can stay for tens of days. The continuum power spectra can be described by two different shapes according to the hardness of the spectrum: flat-top noise, which appears when the spectrum is hard, and power-law noise when the spectrum is softer. Such behaviour has been seen in other black-hole systems during the very high state. No correlation of the shape of the noise with count rate is seen.
Acknowledgements.
We thank the referee B. Paul for his suggestions that improved the presentation of the paper. PR is a researcher of the programme Ramón y Cajal funded by the Spanish Ministery of Science & Technology and by the University of Valencia. The authors also acknowledge partial support via the European Union Training and Mobility of Researchers Network Grant ERBFMRX/CT98/0195. TB acknowledges the Cariplo Foundation for financial support. This research has made use of data obtained through the High Energy Astrophysics Science Archive Research Center Online Service, provided by the NASA/Goddard Space Flight Center.References
- (1) Belloni, T., Méndez, M., van der Klis, M., Hasinger, G., Lewin, W.H.G., van Paradijs, J., 1996, ApJ, 472, L107
- (2) Belloni, T., Méndez, M., van der Klis, M., King, A.R., van Paradijs, J., 1997a, ApJ, 479, L145
- (3) Belloni, T., Méndez, M., van der Klis, M., King, A.R., van Paradijs, J., 1997b, ApJ, 488, L109
- (4) Belloni, T., van der Klis, M., Lewin, W.H.G., van Paradijs, J., Dotani, T., Mitsuda, K., Miyamoto, S., 1997c, A&A, 322, 857
- (5) Belloni, T., Méndez, M., van der Klis, M., Lewin, W.H.G., Dieters, S., 1999, ApJ, 519, L159
- (6) Belloni, T., Klein-Wolt, M., Méndez, M., van der Klis, M., van Paradijs J., 2000, A&A, 355, 271 (B00)
- (7) Castro-Tirado, A.J., Brandt, S. Lund, N. Lapshov,I., Sunyaev, R.A., Shlyapnikov, A.A., Guziy, S. Pavlenko, E.P., 1994, ApJS, 92, 469
- (8) Chen, X., Taam, R.E., 1996, ApJ, 466, 404
- (9) Dhawan, V., Mirabel, I.F., Rodríguez, L.F., 2000, ApJ, 543, 373
- (10) Ebisawa, K., et al. 1994, PASJ, 46, 375
- (11) Esin, A.A., McClintock, E., Narayan, R., 1997, ApJ, 489, 865
- (12) Fender, R.P., 2001, MNRAS, 322, 31
- (13) Greiner, J., Cuby, J. G., McCaughrean, M. J., Castro-Tirado, A. J., Mennickent, R. E., 2001, A&A, 373, L37
- (14) Homan, J., Wijnands, R., vander Klis, M., Belloni, T., van Paradijs, J., Klein-Wolt, M., Fender, R., Méndez, M., 2001, ApJS, 132, 377
- (15) Ji, J.F., Zhang, S.N., QU, J.L., & Li, T.P., 2003, ApJ, 584, L23
- (16) Klein-Wolt, M., Fender, R.P., Pooley, G.G., Belloni, T., Migliari, S., Morgan, E.H., van der Klis, M., 2002, MNRAS, 331, 745
- (17) Liang, P., 1998, Physics Reports, 302, 67
- (18) Markwardt, C.B., Swank, J.H., & Taam, R.E., 1999, ApJ, 513, L37
- (19) Méndez, M., van der Klis, M., 1997, ApJ, 479, 926
- (20) Méndez, M., Belloni, T., van der Klis, M., 1998, ApJ, 499, L187
- (21) Merloni, A., Fabian, A.C., Ross, R.R., 2000, MNRAS, 313, 193
- (22) Mitsuda, K., Inoue, H., Koyama, K., et al. 1984, PASJ, 36, 741
- (23) Miyamoto, S., Kimura, K., Kitamoto, S., Dotani, T., Ebisawa, K., 1991, ApJ, 383, 784
- (24) Miyamoto, S., Kitamoto, S., Iga, S., Negoro, H., Terada, K., 1992, ApJ, 391, L21
- (25) Miyamoto, S., Iga, S., Kitamoto, S., Kamado, Y., 1993, ApJ, 403, L39
- (26) Miyamoto, S., Kitamoto, S., Iga, S., Hayasida, K., Terada, K., 1994, ApJ, 435, 398
- (27) Morgan, E.H., Remillard, R.A., Greiner, J., 1997, ApJ, 482, 993
- (28) Muno, M.P., Remillard, R.A., Morgan, E.H., Waltman, E.B., Dhawan, V., Hjellming, R.M., Pooley, G., 2001, ApJ, 556, 515
- (29) Naik, S., Rao, A. R., 2000, A&A, 362, 691
- (30) Paul, B., Agrawal, P. C., Rao, A. R., Vahia, M. N., Yadav, J.S., Marar, T. M. K., Seetha, S., Kasturirangan, K., 1997, A&A, 320, L37
- (31) Revnivtsev, M.G., Trudolyubov, S.P., Borozdin, K.N., 2000, MNRAS, 312, 151
- (32) Rutledge, R.E., Lewin, W.H.G., van der Klis, M., van Paradijs, J., Dotani, T. Vaughan, B., Belloni, T., Oosterbroek, T., Kouveliotou, C., 1999, ApJS, 124, 265
- (33) Takizawa, M., Dotani, T., Mitsuda, K., et al., 1997, ApJ, 489, 272
- (34) Tananbaum, H., Gursky, H., Kellog, E., Giacconi, R., Jones, C., 1972, ApJ, 177, L5
- (35) Tanaka, Y., Shibazaki, N., 1996, ARA&A, 34, 607
- (36) van der Klis, M., 1995, in X-ray binaries, Cambridge University Press, eds. Lewin, W.H.G., van Paradijs, J., van den Heuvel, E.P.J., p.252
- (37) Zhang, S.N., Cui, W., Chen, W., 1997, ApJ, 482, L155