A Snapshot Survey for Gravitational Lenses Among Quasars: I. The Sample
Abstract
Over the last few years, the Sloan Digital Sky Survey (SDSS) has discovered several hundred quasars with redshift between 4.0 and 6.4. Including the effects of magnification bias, one expects a priori that an appreciable fraction of these objects are gravitationally lensed. We have used the Advanced Camera for Surveys on the Hubble Space Telescope to carry out a snapshot imaging survey of high-redshift SDSS quasars to search for gravitationally split lenses. This paper, the first in a series reporting the results of the survey, describes snapshot observations of four quasars at and 6.30, respectively. We find that none of these objects has a lensed companion within 5 magnitudes with a separation larger than arcseconds; within 2.5 magnitudes, we can rule out companions within 0.1 arcseconds. Based on the non-detection of strong lensing in these four systems, we constrain the luminosity function to a slope of , assuming a break in the quasar luminosity function at . We discuss the implications of this constraint on the ionizing background due to quasars in the early universe. Given that these quasars are not highly magnified, estimates of the masses of their central engines by the Eddington argument must be taken seriously, possibly challenging models of black hole formation.
1 Introduction
Before 1995, only 24 quasars with redshifts larger than four had been published; most had been found in multicolor or grism surveys for high-redshift quasars (e.g., Warren et al. 1987; Schmidt, Schneider, & Gunn 1987). In the past eight years the number of known quasars has increased to more than 400, largely due to the discoveries from the Sloan Digital Sky Survey (SDSS; York et al. 2000) and the Digitized Palomar Sky Survey (Kennefick, Djorgovski, & Meylan 1996). The SDSS to date has published the discovery of over 200 quasars with redshifts greater than 3.6 (Fan et al. 2001b; Anderson et al. 2001; Schneider et al. 2001; Schneider et al. 2003). In addition, Fan et al. (2000), Fan et al. (2001a), and Fan et al. (2003) have discovered the seven highest-redshift quasars known, all with and four of which are the subject of this paper. This large sample provides us with new opportunities to study high-redshift quasars; it has already been used to determine the luminosity function of quasars and its evolution with redshift from to (Fan et al. 2001c, 2003). The luminosity function is well-fit with a power-law, while the comoving number density of quasars drops exponentially with redshift over this range. One of the goals of this paper is to determine the extent to which the observed luminosity function might be biased by gravitational lensing.
Understanding the (intrinsic) quasar luminosity function and evolution thereof at high redshifts is important for several reasons. We observe that supermassive, quiescent black holes are ubiquitous at low redshift (Magorrian et al. 1998); comparison of the present-day mass function with the high-redshift luminosity function can constrain models for the duty cycle of black holes and their feeding mechanisms. There is increasing evidence for a population of optically faint AGN at high redshift, which appear in deep X-ray images with the Chandra satellite (Mushotzky et al. 2000; Brandt et al. 2001; Alexander et al. 2001); understanding their nature requires that we understand the nature of the optically luminous objects as well. Finally, the optical (rest-frame UV) luminosity function puts important constraints on the ultraviolet ionizing background (Fan et al. 2001c), which is especially important now that we appear to be observing the first hints that the universe became completely reionized around redshift (e.g., Becker et al. 2001; Djorgovski et al. 2001; White et al. 2003).
The continuum luminosities of the quasars are all very high, with absolute magnitudes at rest frame 1450 Å between and for the WMAP cosmology that we use throughout this paper (a flat CDM model with and ; Spergel et al. 2003). This yields a lower limit to the masses of their black holes of order by the Eddington argument (Fan et al. 2000). It is a challenge to explain in standard cosmologies how such massive black holes could form at a cosmic epoch less than a billion years after the Big Bang (e.g., Efstathiou & Rees 1988; Turner 1991; Haiman & Loeb 2001).
All these results assume that the apparent magnitudes that we measure for these quasars are intrinsic to the quasar themselves, and represent isotropic fluxes. However, gravitational lensing can systematically brighten the images of quasars by a significant amount. This is a particularly important effect for flux-limited surveys like SDSS, which are sensitive to the most luminous quasars at any given redshift (e.g., Maoz & Rix 1993). The resulting magnification bias (e.g., Pei 1995, and references therein) can systematically change the quasar luminosity function, causing an overestimation of the black hole masses powering these objects.
The expected fraction of multiply imaged quasars at a given redshift depends both on the cosmological model (which sets the distribution and profiles of halos as a function of redshift, as well as the dependence of cosmological pathlength on redshift), and on the luminosity function of quasars, which determines the effect of magnification bias. In the WMAP cosmology (using a halo distribution taken from the large N-body simulations of Jenkins et al. 2001), the fraction of random lines of sight at that produce multiple images at all splitting angles (see the discussion of lensing models in § 3 below) is of order 0.2%; this fraction rises to 0.4% at . However, magnification bias greatly increases the lensing rate in a flux-limited sample. At , using the canonical cosmology, and a luminosity function (Fan et al. 2001b) with a break at (see § 3 below for further discussion), we expect about 1% of quasars in our sample to be lensed (specifically, multiply imaged with magnification of at least two). This fraction increases to 8% if we assume a steeper slope of , and to if we keep the slope of , but assume a break in at a 10 times lower luminosity (). At , magnification bias can result in lensing probabilities approaching 100% if the luminosity function is particularly steep (Comerford, Haiman, & Schaye 2002; Wyithe & Loeb 2002a, 2002b). However, the detailed shape of is not well-measured, especially at higher redshifts and luminosities. Such quasars represent the highest peaks in the density field at high redshift, where the mass function of massive dark halos — in which bright quasars likely reside — is expected to be very steep (Fan et al. 2001c).
The median expected splitting of gravitationally lensed quasars is predicted to be somewhat less than (Turner, Ostriker, & Gott 1984), with flux ratios as large as 20:1; this is in broad agreement with the observed splitting separation found by the Cosmic Lens All Sky Survey (CLASS; Browne et al. 2003), but see the discussion in §3 below on CLASS implications for the details of the lens profiles. The SDSS images themselves have PSF widths of order (Abazajian et al. 2003), making them inadequate to look for all but the very rare wide-separation () lenses (Pindor et al. 2003). We are thus carrying out a snapshot imaging survey of 250 SDSS-discovered quasars with using the Advanced Camera for Surveys (ACS; Ford et al. 2003) on the Hubble Space Telescope (HST), which can easily resolve pairs separated by as little as with flux ratios as large as 10:1. Our observations should therefore be sensitive to essentially all expected lenses (Turner et al. 1984; Hinshaw & Krauss 1987). Fan et al. (2003) presented some preliminary results based on some of these (and other, non-HST) data; here we give a full analysis of the HST observations for all four of the quasars in our sample.
Throughout this paper, we adopt the WMAP cosmology mentioned above, with an rms mass fluctuation within a sphere of radius Mpc of , and power–law index for the power spectrum of density fluctuations (Spergel et al. 2003). We also adopt the cosmological transfer function from Eisenstein & Hu (1999). Conversions between and assume (Schmidt, Schneider, & Gunn 1995) with spectral index .
2 The Data
2.1 Observations
The full sample of quasars included in our HST snapshot program will be presented in future papers in this series. In this paper, we present results of imaging the four quasars with discovered by Fan et al. (2000, 2001a); see Table 1. These four objects were selected from the SDSS imaging database based on their extremely red color, absence of detection in and , and relatively blue color (which distinguishes the quasars from brown dwarfs).
The SDSS images of these quasars have an image scale of and -band seeing FWHM between and . In order to test the ability of the SDSS photometric pipeline to identify quasar pairs, we created simulated SDSS images of pairs of point sources (see Pindor et al. 2003 for details) in these observing conditions and at the appropriate signal-to-noise ratio. We find that the SDSS star-galaxy separator would have identified pairs of point sources as resolved objects for image separations greater than and for flux ratios less than 5:1. Thus the SDSS data are suitable for exploring only a fraction of the parameter space of lensing (in terms of separations and flux ratios) that is of interest; higher resolution HST observations were needed to probe the rest of that parameter space. We did not restrict our sample to point sources since the SDSS star-galaxy separation algorithm (see Scranton et al. 2002) breaks down at these faint magnitudes. The only object of the four that was flagged as an extended source was SDSSp J104433.04-012502.2.
We used the High Resolution Camera (HRC) on ACS to image the four quasars presented herein. For these four objects, the Ly forest lies in the SDSS -band; we therefore observed them in the SDSS -band, F850LP, despite its lower sensitivity. The Wide-Field Camera on ACS has higher sensitivity in and than does the HRC, but has has substantially higher overhead and is mildly undersampled. The exposure times were 1200 seconds for each object, 600 seconds in each of two exposures to help in cosmic ray rejection. We did not dither the images, and our cosmic ray rejection is far from perfect (§ 2.2); however, our analysis indicates that imperfect cosmic ray removal is not critical for our search for gravitational lenses.
2.2 Data Processing
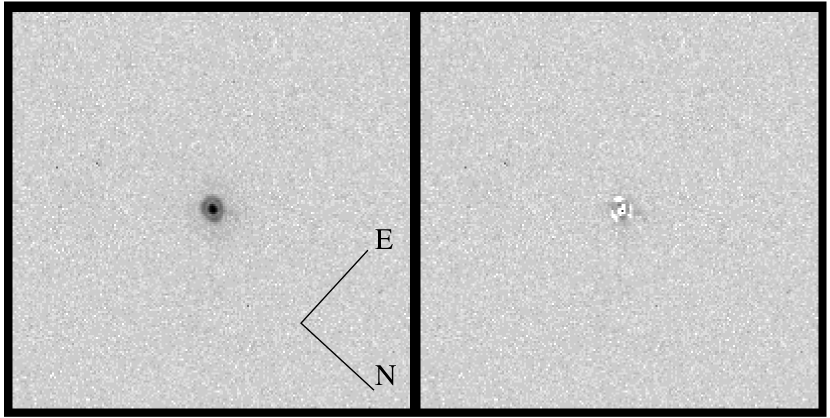
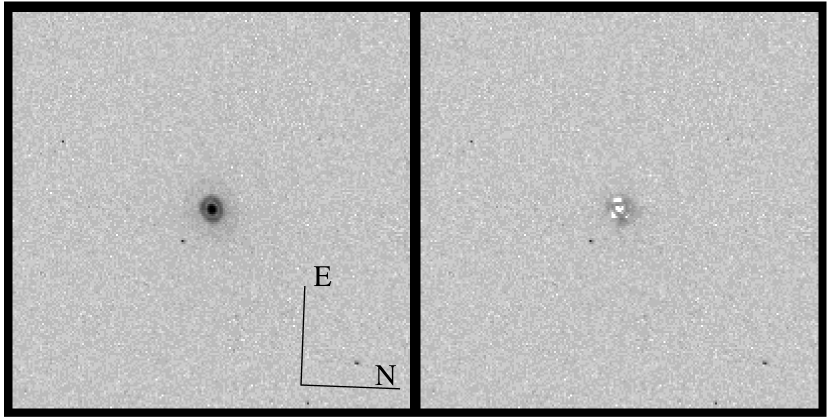
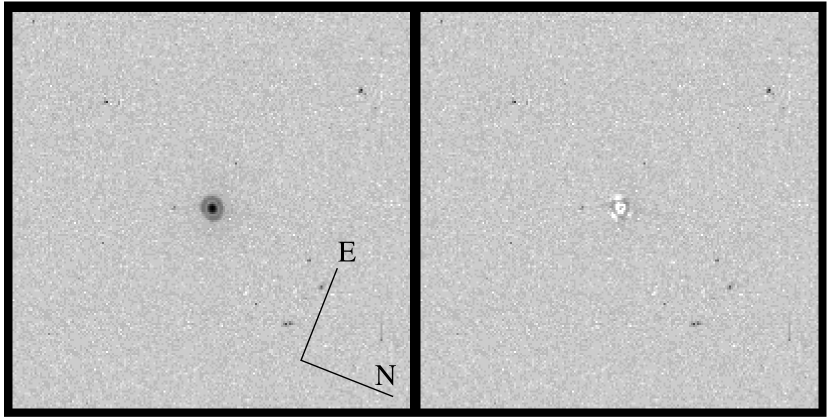
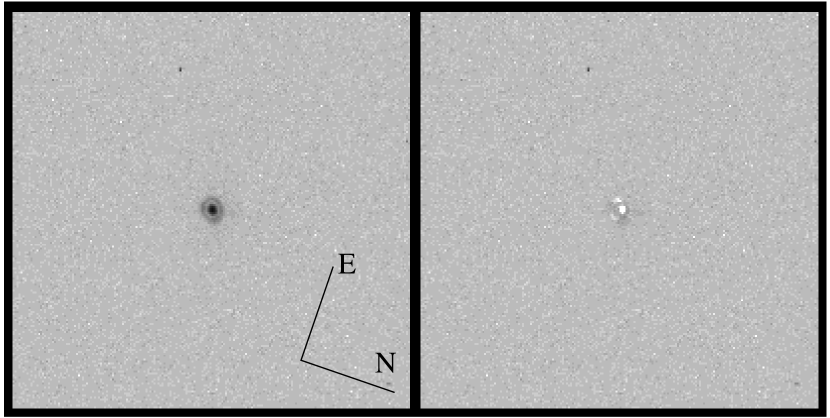
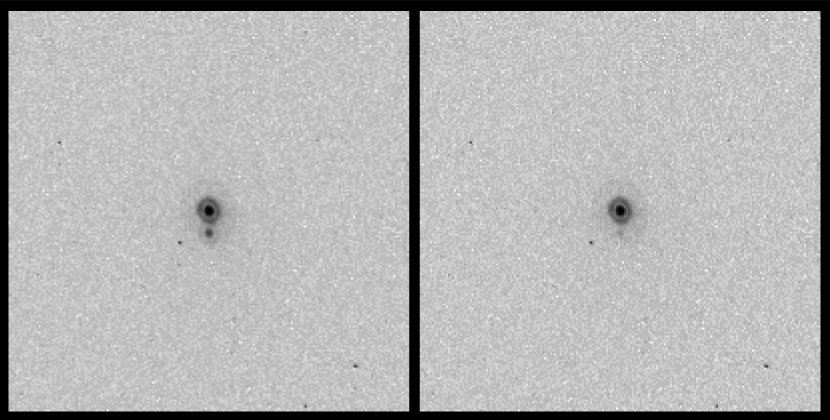
The raw images were calibrated by the CALACS package in IRAF111IRAF is distributed by the National Optical Astronomy Observatories, which are operated by the Association of Universities for Research in Astronomy, Inc., under cooperative agreement with the National Science Foundation. as part of on-the-fly-reprocessing (OTFR) at the time of download. For the most part, we find these initial reductions to be sufficient for our purposes. The images that we present are the “cosmic ray rejected” (CRJ) images that are output by the OTFR algorithms at STScI. These files were re-requested a number of weeks after the observations were completed to ensure that we are using the latest “reference” files and that the OTFR reprocessing is current. The CRJ files have all been reduced in the standard manner, including having been overscan-, bias- and dark-corrected, flat-fielded and photometrically calibrated, in addition to having bad pixels masked and cosmic rays removed (see the ACS manual222http://www.stsci.edu/hst/acs/documents/handbooks/cycle12/cover.html for more details). The plate scale on the HRC of the ACS is not the same in the and directions and the sky axes are not perpendicular on the CCD; these CRJ images have not been corrected for this distortion. A cutout of each of the ACS images is given in Figures 1-4.
With the exception of cosmic ray rejection and hot pixel identification, the images output by the OTFR algorithm are acceptable for our purposes. The CALACS rejects pixels that are significantly different in the two images. This process successfully rejects the majority of the cosmic rays in our images. However, many of the cosmic rays occupy multiple pixels, and we have only two exposures, meaning that some cosmic rays remain. In addition, hot pixels can remain in the corrected images if they have not been properly identified in the masks that are constructed for each period of observations between the annealing procedure that helps to repair hot pixels. Fortunately, the morphologies of the residual cosmic rays and hot pixels are considerably different from that of the ACS PSF (the PSF is spread out over many tens of pixels), so spurious sources due to cosmic rays and most other defects are easy to recognize.
2.3 Subtracting the Point Source
The point spread function is narrow enough that any lens with a separation greater than will be obvious by visual inspection (see § 2.5). To search for faint secondary images at separations smaller than this requires that we fit and subtract off a model for the point spread function of each image. We have done this using the v6.0 (pre-launch of ACS) version of the Tiny Tim software (Krist 1995)333http://www.stsci.edu/software/tinytim/, which produces a model PSF for the instruments on HST given the object’s SED and position in the focal plane, the filter curve, and knowledge of the optics of the instrument. Such model PSFs are necessary because it is not always possible to do PSF subtraction using an empirical template (another point source in the field-of-view). That is, given the positional dependence of the PSF across the field-of-view, the Tiny Tim models are often better than using an empirical template. For our ACS/HRC images, the model correctly takes into account the different scales and non-orthogonality of the and axes.
We fit the PSF model to each CRJ image, allowing the location on the CCD and normalization to vary, and using sinc interpolation when shifting the model PSF by fractional pixels. Inputs to Tiny Tim were the camera used (ACS/HRC), the location on the CCD of each quasar to the nearest pixel (as measured by imexam in IRAF) and a Keck spectrum (Becker et al. 2001) of each quasar (for the wavelength dependence of the PSF). We minimized the sum of the square of residuals (since the formal errors per pixel over the image are close to constant). The results are shown in Figures 1–4. Each of the four images show the familiar first Airy ring; on a very hard stretch, the second Airy ring is faintly visible. Note that HST PSFs are not symmetric as a result of the three primary mirror supports, the signature of which can be seen in the PSF subtracted images. Given inevitably somewhat imperfect PSF subtraction and the expected asymmetry of the residual images, in none of the four cases is there an obvious secondary image; none of them are obviously gravitationally lensed.
2.4 Notes on Individual Objects
2.4.1 SDSSp J104433.04-012502.2;
The ACS/HRC image of this quasar is shown in the left panel of Figure 1; the right panel shows the residuals after PSF subtraction. The SDSS -band magnitude of this quasar is 19.3; the HST -band (ST) magnitude is 19.91, see also Table 1. The offset between the SDSS and ST -band magnitude is systematic (see the other objects below) with the ST magnitudes always being fainter. This is probably due to the differences in the filter curves (the SDSS curve having less red response due to atmospheric features) and the differences between a Vega-based (ST) and an AB-based (SDSS) photometric system given that Vega has an AB -band magnitude of 0.57 (Fukugita et al. 1996). We find no offset between the SDSS and ST -band magnitudes (in the HST images of our lower redshift quasars), where the filter curves appear to be much more similar.
Fan et al. (2000) describe a image of this object taken with the Keck 10m telescope in seeing, which was consistent with a point source. That is consistent with the HST image; there is no apparent splitting in this object.
Shioya et al. (2002) found a faint galaxy () south-west of this quasar. Our 20-minute exposure shows this object faintly after rebinning. Shioya et al. (2002) suggest that this galaxy could amplify the flux of the quasar by up to a factor of two. The lack of a secondary image of the quasar restricts any possible magnification to be no larger than this — in the absence of microlensing and external shear (Wyithe & Loeb 2002a).
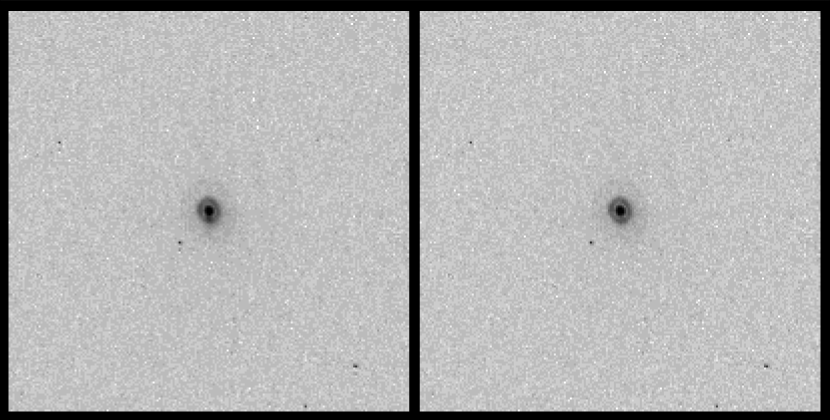
2.4.2 SDSSp J083643.85+005453.3;
The ACS/HRC image of this quasar and residuals after PSF subtraction are shown in Figure 2. The SDSS -band magnitude of this quasar is 18.79; the HST -band (ST) magnitude is 19.49, see also Table 1. One other point source and two other extended sources are in the ACS/HRC field of this quasar, but all are more than away (out of the field-of-view of Fig. 2), and are therefore unlikely to lens (or significantly magnify) the quasar. The black dots in the field-of-view of Figure 2 are residual cosmic rays that were not properly cleaned by the OTFR reductions.
2.4.3 SDSSp J130608.26+035626.3;
The ACS/HRC image of this quasar is shown in Figure 3. The SDSS -band magnitude of this quasar is 19.46; the HST -band (ST) magnitude is 20.23, see also Table 1. There is some evidence for a few very faint extended sources in the ACS/HRC field (off the image in Fig. 3), but as with Figure 2, all of the black dots in Figure 3 are residual cosmic rays. Yamada et al. (2003) have taken deep images to in moderate seeing with Subaru in this field, and have found no foreground galaxies close enough to the line of sight to cause gravitational lensing.
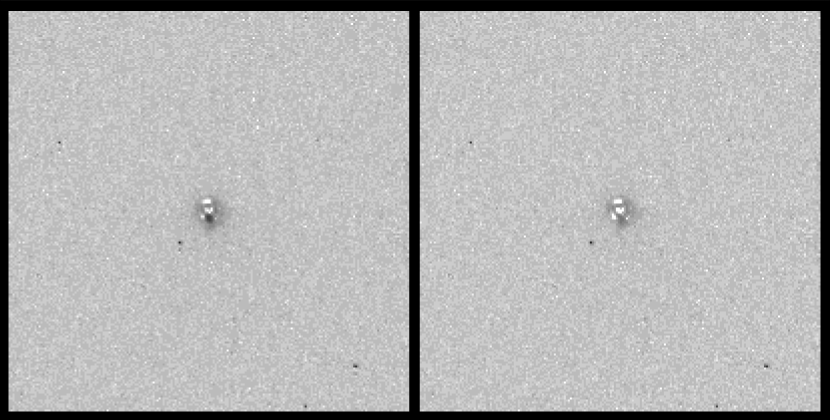
2.4.4 SDSSp J103027.10+052455.0;
The ACS/HRC image of this quasar is shown in Figure 4. The SDSS -band magnitude of this quasar is 20.02; the HST -band (ST) magnitude is 20.54, see also Table 1. There is one other relatively bright point source in the field, nearly due west of the target quasar, but it is at the edge of the field (off the image in Fig. 4) and is not of interest in terms of lensing. As in the previous object, a deep image by Yamada et al. (2003) shows no obvious lensing galaxies in the foreground. However, Petric et al. (2003) have taken deep VLA images at 20 cm in this field, and found a statistically significant overdensity of four radio sources within of the quasar, which may indicate the possibility of a magnifying cluster along the line of sight.
2.5 Looking for Multiple Images
Our ACS images have an image scale of , and we can visually rule out any multiple imaging at scales larger than about . To make this more quantitative, we have carried out simulations of quasar pairs at various separations and flux ratios, by adding a scaled-down and shifted version of our quasar images to itself. This naive procedure produces a slightly incorrect sky level, but the inaccuracy is negligible for our present purposes. Figure 5 shows simulated observations of SDSS J0836+0054 with an additional point source 2.5 and 5.0 mag fainter than the quasar and separated from the quasar by . The secondary image is obvious in both cases even without PSF subtraction. Figure 6 shows the result of a offset. With a flux ratio of 10:1, the secondary object is visible as an enhancement in the first Airy ring of the primary object; it becomes clear upon PSF subtraction (Figure 7). With a flux ratio of 100:1, we cannot discern a pair with separation even after subtraction of the PSF; however, even if we were able to do so, it would not significantly improve the constraints that we derive below since most split images will have larger image separations.
3 Constraining the Slope of the Quasar Luminosity Function
The shape of the high-redshift quasar luminosity function is not tightly constrained because of the limited size and luminosity range of the available statistical samples. Schmidt et al. (1995), using a set of 90 quasars with , found a power-law luminosity function slope () of . Fan et al. (2001c) measured from 39 quasars in the redshift interval 3.6 to 5.0. These slopes apply to the high-luminosity () part of the luminosity function. At these high redshifts, direct observations currently yield only poor constraints on the slope of the quasar luminosity function (LF) at , and essentially no constraints at , where the luminosities of the known quasars all lie within magnitudes of the detection threshold of SDSS. From the number counts of quasars, Fan et al. (2001c) place a 3- lower limit on the slope of . Gravitational lensing tends to flatten the intrinsic luminosity function, producing an apparent slope of in the limit of an arbitrarily steep intrinsic LF down to a fixed low–luminosity cutoff (e.g., Schneider, Ehlers, & Falco 1992). As a result, the relatively shallow apparent slope at does not necessarily reflect the slope of the underlying LF, which could be much steeper, if most quasars were lensed and magnified.
One of the primary goals of this work is to constrain the slope of the quasar LF at high redshift, using the lack of evidence for strong lensing among the four quasars in the HST images (Comerford et al. 2002). In line with previous work, we describe the intrinsic (not necessarily observed) quasar luminosity function as a broken power law (e.g., Boyle, Shanks, & Peterson 1988; Pei 1995):
| (1) |
The LF is described by four parameters: the normalization , the faint-end slope , the bright-end slope , and the characteristic luminosity at which the LF steepens. The lensing probability is very sensitive to the last two parameters, and , while it is only weakly dependent on the faint–end slope below the break, and it is strictly independent of the normalization . Here we apply the lensing model from Comerford et al. (2002), in which lenses are associated with dark matter halos, to compute the total lensing probability, including the effect of magnification bias. In this model, the abundance of halos as a function of potential well depth is adopted from the simulations of Jenkins et al. (2001). While it would be simplest to assume that the halos have a common density profile, such as the singular isothermal sphere (SIS), recent work has suggested that the typical density profile of massive lenses is shallower than that of the SIS (Porciani & Madau 2000; Kochanek & White 2001; Li & Ostriker 2002; Huterer & Ma 2003). The observed dearth of large–separation lenses cannot be explained if all lenses have the same density profile. A prescription that fits the observed steep splitting angle distribution is to assume that all halos below have SIS profiles (adopting a standard conversion between circular velocity and halo mass), while all halos above this mass follow the dark matter density profile suggested by Navarro, Frenk, & White (1997, hereafter NFW). NFW profiles are much less efficient lenses than are SIS profiles. This prescription is physically motivated in Kochanek & White (2001) based on the efficiency of gas cooling, and we adopt it in this paper. In our calculations, this is essentially equivalent to ignoring all lenses above a halo mass of , as the massive halos do not contribute to lensing at small separations.
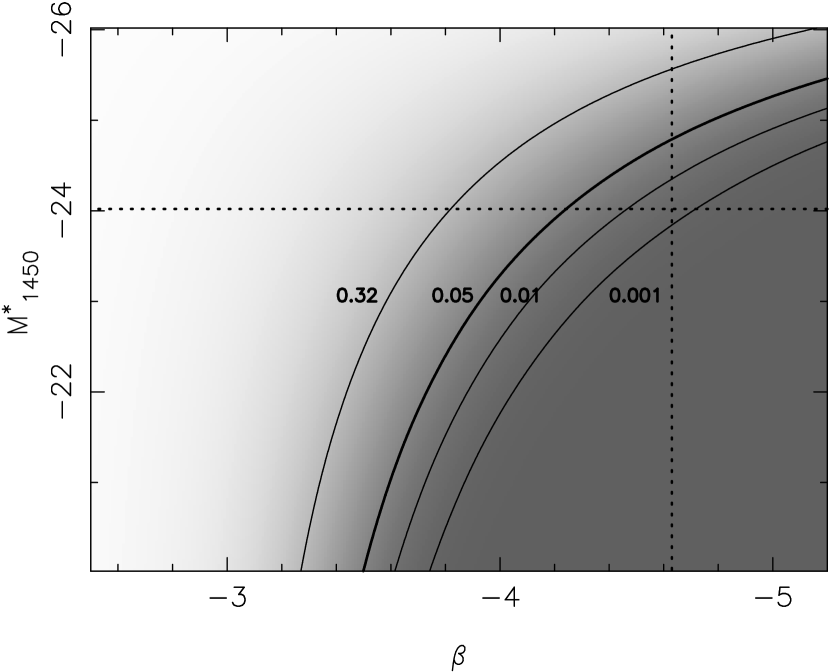
As an example, we first fix the characteristic luminosity (“knee”) of the quasar LF at a fiducial value of , and derive constraints on the bright-end slope, . The choice for this value is somewhat arbitrary: the highest redshift where the quasar LF is measured to faint enough magnitudes to define a reliable break is at (Boyle et al. 2000), where . In pure luminosity evolution models, the break at would then be at around (e.g. Madau, Haardt, & Rees 1999; Wyithe & Loeb 2002a). Having fixed the value of the break, we next vary the slope of the LF, and require that the expected probability for no lensing among the four highest redshift quasars is P=0.0026 () or greater. Assuming that we can rule out a second image with a flux ratio of 100 down to a splitting angle of , we find the constraint on the slope . We find that resolving high–contrast lensing configurations, with a flux ratio , or resolving angular separations smaller than does not significantly improve this constraint, since in any model, the fraction of lenses with separations less than is small. For example, ruling out flux ratios of 10 down to would only improve the constraint to .
It is more informative to illustrate joint constraints on the parameters . In Figure 8, we show contours for the likelihood at , 0.05, 0.01, and 0.001 that none of the four quasars are lensed (again, to a separation of 0.3 arcseconds, and to flux ratios of 100). The figure shows, as in Fan et al. (2003), that the derived limit on the slope depends strongly on the assumed break. Overall, the constraint shown in this figure is similar to that derived from the sample of seven high–redshift quasars in Fan et al. (2003), although the present constraints are somewhat weaker, due to the smaller number of sources. The recent results of Wyithe (2003) are consistent with ours under the assumption of no lensing. As shown in Wyithe (2003), a stronger constraint is available if two of the known quasars are indeed magnified, as suggested by Shioya et al. (2002) and White et al. (2003).
4 Discussion
The lack of lenses among the four high–redshift quasars allows us to place constraints on the quasar LF at high redshift, shown in Figure 8. It is useful to keep in mind that only models with extreme magnification bias, predicting significant lensing probabilities, can be constrained by the lack of lensing events. For example, for the range of LF slopes considered by Wyithe & Loeb (2002a), , the lensing fraction for the SDSS sample would be 7-30%. The chance of finding no lenses among the four quasars for their steepest slope of 3.43 is , which translates to a significance of only for ruling out this slope (consistent with our results shown in Figure 8 at the break of ).
Accordingly, as Figure 8 shows, the constraints obtained here still allow very steep LF slopes, especially if we assume that the break in the LF lies at relatively bright magnitudes. Nevertheless, these constraints are fairly direct, and are among the most stringent limits we currently have on the shape of the high-redshift quasar LF. We expect that the full sample will further tighten the constraints (or yield a measurement should a lens be found). Table 2 shows that the lensing probability (for a slope of and break ) decreases from 8.2% at to 1.2% at . This implies that seeing no lensing with a single quasar provides a constraint that is equivalent to about seven quasars, from the equation . The lensing probability is a steep function of and , but since our full sample will include times more sources than utilized here, we expect that we will be able to significantly tighten the constraints in the plane with this sample.
Given our assumed shape of the quasar LF, the constraints obtained in the plane translate directly to the global ionizing emissivity of the quasar population, . The emissivity is of great interest, since a related quantity — the mean background flux — can be constrained independently from the level of resonant neutral hydrogen absorption detected in high–resolution spectra of the SDSS quasars. Specifically, recent upper limits on this background were obtained from the Gunn–Peterson (1965) trough of the quasar (e.g., McDonald & Miralda-Escudé 2001; Cen & McDonald 2002; Lidz et al. 2002; Fan et al. 2002), requiring that ionizations per hydrogen atom per second at . The conversion to the ionizing emissivity is
| (2) |
where we have assumed , is the hydrogen ionization cross section at the Lyman limit (and we assumed above the threshold), is the Planck constant, Hz is the frequency of a Lyman limit photon, and is the mean free path of ionizing photons (see the Appendix in Comerford et al. 2002). The last quantity unfortunately has a very large uncertainty. Nevertheless, for a crude estimate, we here assume that the effective mean free path corresponds to a redshift interval of at (see Haardt & Madau 1996; Steidel, Pettini, & Adelberger 2001), and scales with redshift as towards higher redshift (Cen & McDonald 2002). In this case, the model with and corresponds to . In other words, the constraint we derive here from the absence of lensing is approximately at the same level as that implied by the upper limit on the ionizing background. Note that the constraints we obtain apply to the total emissivity of quasars alone, but the upper limits on the background from the Gunn-Peterson trough constrains the total emissivity (including galaxies). Future improvements of the lensing constraint can yield tighter limits on the ionizing emissivity of the quasar population than hitherto possible — subject to the uncertainties in (1) the mean evolution of the mean free path with redshift, (2) the faint–end slope , which does affect the total emissivity , and (3) the escape fraction of ionizing photons at .
The fact that none of the four high–redshift quasars appears to be strongly magnified also implies that the masses inferred for the central black holes from the Eddington limit argument are real. If a quasar is strongly beamed towards us, the bolometric luminosity would be overestimated, but Willott, McLure, & Jarvis (2003), following Haiman & Cen (2002) argued that emission line equivalent widths being normal mitigates the beaming hypothesis. The inferred black hole masses in these four quasars are very high, ; how black holes can grow so large so early in the Universe requires explanation (Efstathiou & Rees 1988; Turner 1991). Haiman & Loeb (2001) considered the presence of the black hole for the quasar in simple models for black hole growth. They found that it could be marginally accommodated in simple models of black hole growth by mergers and accretion in an LCDM universe. These considerations depend strongly on the redshift, and on the typical radiative efficiency of black holes. The highest redshift quasars therefore represent a bigger challenge to models, especially if their radiative efficiency during their growth was as high as 20%, the typical value inferred recently for the brightest quasars at lower redshifts (Yu & Tremaine 2002). This is twice the fiducial value of adopted in Haiman & Loeb (2001) and most other previous work on black hole growth, doubling the expected growth timescale.
Finally, the lack of strong lensing appears consistent with the large apparent sizes of ionized regions around the quasars. Haiman & Cen (2002) argue that the source cannot be magnified by more than a factor of a few, since an intrinsically faint source would not be able to ionize a neutral IGM out to the observed distance away from the source of (comoving) Mpc — the spectrum shows transmission at wavelengths corresponding to this distance. Similar conclusions were drawn for the quasar (Fan et al. 2003) recently by White et al. (2003).
5 Conclusions and Future Work
We have obtained high resolution HST images of the four highest redshift quasars known prior to 2003 to look for the signature of gravitational lensing. We have found no evidence of multiple images, significantly limiting the amount by which these quasars can be magnified by foreground mass concentrations (in the absence of microlensing). Thus the masses of these quasars as derived from the Eddington argument cannot be significantly inflated by magnification.
The lack of any strong lenses puts a constraint on the bright end slope of the luminosity function of . This limit on the slope of the luminosity function is also consistent with previous limits on the ionizing emissivity of quasars of ionizations per hydrogen atom per second based on the Gunn-Peterson trough in the highest redshift quasar studied herein.
The next paper in the series will present an analysis of a much larger sample of quasar observations with HST and will discuss the constraints that we can place upon the quasar luminosity function from that larger (but lower redshift) sample. Furthermore, there are many more (and even a few ) quasars known now than were known at the time that these HST observations were approved. Higher resolution images should be taken of as many of these as possible; much of the parameter space can even be covered by ground-based observations since HST resolution splittings are only needed to discern the smallest expected splittings.
References
- Abazajian et al. (2003) Abazajian et al. 2003, AJ, in press
- Alexander, Brandt, Hornschemeier, Garmire, Schneider, Bauer, & Griffiths (2001) Alexander, D. M., Brandt, W. N., Hornschemeier, A. E., Garmire, G. P., Schneider, D. P., Bauer, F. E., & Griffiths, R. E. 2001, AJ, 122, 2156
- Anderson, Fan, Richards, Schneider, Strauss, Vanden Berk, Gunn, Knapp, Schlegel, Voges, Yanny, Bahcall, Bernardi, Brinkmann, Brunner, Csabái, Doi, Fukugita, Hennessy, Ivezić, Kunszt, Lamb, Loveday, Lupton, McKay, Munn, Nichol, Szokoly, & York (2001) Anderson, S. F., Fan, X., Richards, G. T., Schneider, D. P., Strauss, M. A., Vanden Berk, D. E., Gunn, J. E., Knapp, G. R., et al. 2001, AJ, 122, 503
- Becker, Fan, White, Strauss, Narayanan, Lupton, Gunn, Annis, Bahcall, Brinkmann, Connolly, Csabai, Czarapata, Doi, Heckman, Hennessy, Ivezić, Knapp, Lamb, McKay, Munn, Nash, Nichol, Pier, Richards, Schneider, Stoughton, Szalay, Thakar, & York (2001) Becker, R. H., Fan, X., White, R. L., Strauss, M. A., Narayanan, V. K., Lupton, R. H., Gunn, J. E., Annis, J., et al. 2001, AJ, 122, 2850
- Boyle, Shanks, Croom, Smith, Miller, Loaring, & Heymans (2000) Boyle, B. J., Shanks, T., Croom, S. M., Smith, R. J., Miller, L., Loaring, N., & Heymans, C. 2000, MNRAS, 317, 1014
- Boyle, Shanks, & Peterson (1988) Boyle, B. J., Shanks, T., & Peterson, B. A. 1988, MNRAS, 235, 935
- Brandt, Hornschemeier, Alexander, Garmire, Schneider, Broos, Townsley, Bautz, Feigelson, & Griffiths (2001) Brandt, W. N., Hornschemeier, A. E., Alexander, D. M., Garmire, G. P., Schneider, D. P., Broos, P. S., Townsley, L. K., Bautz, M. W., et al. 2001, AJ, 122, 1
- Browne, Wilkinson, Jackson, Myers, Fassnacht, Koopmans, Marlow, Norbury, Rusin, Sykes, Biggs, Blandford, de Bruyn, Chae, Helbig, King, McKean, Pearson, Phillips, Readhead, Xanthopoulos, & York (2003) Browne, I. W. A., Wilkinson, P. N., Jackson, N. J. F., Myers, S. T., Fassnacht, C. D., Koopmans, L. V. E., Marlow, D. R., Norbury, M., et al. 2003, MNRAS, 341, 13
- Cen & McDonald (2002) Cen, R. & McDonald, P. 2002, ApJ, 570, 457
- Comerford, Haiman, & Schaye (2002) Comerford, J. M., Haiman, Z., & Schaye, J. 2002, ApJ, 580, 63
- Djorgovski, Castro, Stern, & Mahabal (2001) Djorgovski, S. G., Castro, S., Stern, D., & Mahabal, A. A. 2001, ApJ, 560, L5
- Efstathiou & Rees (1988) Efstathiou, G. & Rees, M. J. 1988, MNRAS, 230, 5P
- Eisenstein & Hu (1999) Eisenstein, D. J. & Hu, W. 1999, ApJ, 511, 5
- (14) Fan, X., Narayanan, V. K., Lupton, R. H., Strauss, M. A., Knapp, G. R., Becker, R. H., White, R. L., Pentericci, L., et al. 2001a, AJ, 122, 2833
- Fan, Narayanan, Strauss, White, Becker, Pentericci, & Rix (2002) Fan, X., Narayanan, V. K., Strauss, M. A., White, R. L., Becker, R. H., Pentericci, L., & Rix, H. 2002, AJ, 123, 1247
- (16) Fan, X., Strauss, M. A., Richards, G. T., Newman, J. A., Becker, R. H., Schneider, D. P., Gunn, J. E., Davis, M., et al. 2001b, AJ, 121, 31
- Fan, Strauss, Schneider, Becker, White, Haiman, Gregg, Pentericci, Grebel, Narayanan, Loh, Richards, Gunn, Lupton, Knapp, Ivezić, Brandt, Collinge, Hao, Harbeck, Prada, Schaye, Strateva, Zakamska, Anderson, Brinkmann, Bahcall, Lamb, Okamura, Szalay, & York (2003) Fan, X., Strauss, M. A., Schneider, D. P., Becker, R. H., White, R. L., Haiman, Z., Gregg, M., Pentericci, L., et al. 2003, AJ, 125, 1649
- (18) Fan, X., Strauss, M. A., Schneider, D. P., Gunn, J. E., Lupton, R. H., Becker, R. H., Davis, M., Newman, J. A., et al. 2001c, AJ, 121, 54
- Fan, White, Davis, Becker, Strauss, Haiman, Schneider, Gregg, Gunn, Knapp, Lupton, Anderson, Anderson, Annis, Bahcall, Boroski, Brunner, Chen, Connolly, Csabai, Doi, Fukugita, Hennessy, Hindsley, Ichikawa, Ivezić, Loveday, Meiksin, McKay, Munn, Newberg, Nichol, Okamura, Pier, Sekiguchi, Shimasaku, Stoughton, Szalay, Szokoly, Thakar, Vogeley, & York (2000) Fan, X., White, R. L., Davis, M., Becker, R. H., Strauss, M. A., Haiman, Z., Schneider, D. P., Gregg, M. D., et al. 2000, AJ, 120, 1167
- Ford, Clampin, Hartig, Illingworth, Sirianni, Martel, Meurer, McCann, Sullivan, Bartko, Benitez, Blakeslee, Bouwens, Broadhurst, Brown, Burrows, Campbell, Cheng, Feldman, Franx, Golimowski, Gronwall, Kimble, Krist, Lesser, Magee, Miley, Postman, Rafal, Rosati, Sparks, Tran, Tsvetanov, Volmer, White, & Woodruff (2003) Ford, H. C., Clampin, M., Hartig, G. F., Illingworth, G. D., Sirianni, M., Martel, A. R., Meurer, G. R., McCann, W. J., et al. 2003, in Future EUV/UV and Visible Space Astrophysics Missions and Instrumentation. Edited by J. Chris Blades, Oswald H. W. Siegmund. Proceedings of the SPIE, Volume 4854, pp. 81-94 (2003)., 81
- Fukugita, Ichikawa, Gunn, Doi, Shimasaku, & Schneider (1996) Fukugita, M., Ichikawa, T., Gunn, J. E., Doi, M., Shimasaku, K., & Schneider, D. P. 1996, AJ, 111, 1748
- Gunn & Peterson (1965) Gunn, J. E. & Peterson, B. A. 1965, ApJ, 142, 1633
- Haardt & Madau (1996) Haardt, F. & Madau, P. 1996, ApJ, 461, 20
- Haiman & Cen (2002) Haiman, Z. & Cen, R. 2002, ApJ, 578, 702
- Haiman & Loeb (2001) Haiman, Z. & Loeb, A. 2001, ApJ, 552, 459
- Hinshaw & Krauss (1987) Hinshaw, G. & Krauss, L. M. 1987, ApJ, 320, 468
- Huterer & Ma (2003) Huterer, D. & Ma, C. 2003, astro-ph/0307301
- Jenkins, Frenk, White, Colberg, Cole, Evrard, Couchman, & Yoshida (2001) Jenkins, A., Frenk, C. S., White, S. D. M., Colberg, J. M., Cole, S., Evrard, A. E., Couchman, H. M. P., & Yoshida, N. 2001, MNRAS, 321, 372
- Kennefick, Djorgovski, & Meylan (1996) Kennefick, J. D., Djorgovski, S. G., & Meylan, G. 1996, AJ, 111, 1816
- Kochanek & White (2001) Kochanek, C. S. & White, M. 2001, ApJ, 559, 531
- Krist (1995) Krist, J. 1995, in ASP Conf. Ser. 77: Astronomical Data Analysis Software and Systems IV, 349
- Li & Ostriker (2002) Li, L. & Ostriker, J. P. 2002, ApJ, 566, 652
- Lidz, Hui, Zaldarriaga, & Scoccimarro (2002) Lidz, A., Hui, L., Zaldarriaga, M., & Scoccimarro, R. 2002, ApJ, 579, 491
- Madau, Haardt, & Rees (1999) Madau, P., Haardt, F., & Rees, M. J. 1999, ApJ, 514, 648
- Magorrian, Tremaine, Richstone, Bender, Bower, Dressler, Faber, Gebhardt, Green, Grillmair, Kormendy, & Lauer (1998) Magorrian, J., Tremaine, S., Richstone, D., Bender, R., Bower, G., Dressler, A., Faber, S. M., Gebhardt, K., et al. 1998, AJ, 115, 2285
- Maoz & Rix (1993) Maoz, D. & Rix, H. 1993, ApJ, 416, 425
- McDonald & Miralda-Escudé (2001) McDonald, P. & Miralda-Escudé, J. 2001, ApJ, 549, L11
- Mushotzky, Cowie, Barger, & Arnaud (2000) Mushotzky, R. F., Cowie, L. L., Barger, A. J., & Arnaud, K. A. 2000, Nature, 404, 459
- Navarro, Frenk, & White (1997) Navarro, J. F., Frenk, C. S., & White, S. D. M. 1997, ApJ, 490, 493
- Pei (1995) Pei, Y. C. 1995, ApJ, 440, 485
- Petric, Carilli, Bertoldi, Fan, Cox, Strauss, Omont, & Schneider (2003) Petric, A. O., Carilli, C. L., Bertoldi, F., Fan, X., Cox, P., Strauss, M. A., Omont, A., & Schneider, D. P. 2003, AJ, 126, 15
- Pindor, Turner, Lupton, & Brinkmann (2003) Pindor, B., Turner, E. L., Lupton, R. H., & Brinkmann, J. 2003, AJ, 125, 2325
- Porciani & Madau (2000) Porciani, C. & Madau, P. 2000, ApJ, 532, 679
- Richards, Vanden Berk, Reichard, Hall, Schneider, SubbaRao, Thakar, & York (2002) Richards, G. T., Vanden Berk, D. E., Reichard, T. A., Hall, P. B., Schneider, D. P., SubbaRao, M., Thakar, A. R., & York, D. G. 2002, AJ, 124, 1
- Schmidt, Schneider, & Gunn (1987) Schmidt, M., Schneider, D. P., & Gunn, J. E. 1987, ApJ, 321, L7
- Schmidt, Schneider, & Gunn (1995) —. 1995, AJ, 110, 68
- Schneider, Fan, Strauss, Gunn, Richards, Hill, MacQueen, Ramsey, Adams, Booth, Hill, Knapp, Lupton, Saxe, Shetrone, Tufts, Vanden Berk, Wolf, York, Anderson, Anderson, Bahcall, Brinkmann, Brunner, Csabai, Fukugita, Hennessy, Ivezić, Lamb, Munn, & Thakar (2001) Schneider, D. P., Fan, X., Strauss, M. A., Gunn, J. E., Richards, G. T., Hill, G. J., MacQueen, P. J., Ramsey, L. W., et al. 2001, AJ, 121, 1232
- Schneider, Ehlers, & Falco (1992) Schneider, P., Ehlers, J., & Falco, E. E. 1992, Gravitational Lenses (Springer-Verlag Berlin)
- Schneider et al. (2003) Schneider et al. 2003, AJ, in press
- Scranton, Johnston, Dodelson, Frieman, Connolly, Eisenstein, Gunn, Hui, Jain, Kent, Loveday, Narayanan, Nichol, O’Connell, Scoccimarro, Sheth, Stebbins, Strauss, Szalay, Szapudi, Tegmark, Vogeley, Zehavi, Annis, Bahcall, Brinkman, Csabai, Hindsley, Ivezic, Kim, Knapp, Lamb, Lee, Lupton, McKay, Munn, Peoples, Pier, Richards, Rockosi, Schlegel, Schneider, Stoughton, Tucker, Yanny, & York (2002) Scranton, R., Johnston, D., Dodelson, S., Frieman, J. A., Connolly, A., Eisenstein, D. J., Gunn, J. E., Hui, L., et al. 2002, ApJ, 579, 48
- Shioya, Taniguchi, Murayama, Ajiki, Nagao, Fujita, Kakazu, Komiyama, Okamura, Oyabu, Kawara, Ohyama, Kawabata, Ando, Nishimura, Hayashi, Ogasawara, & Ichikawa (2002) Shioya, Y., Taniguchi, Y., Murayama, T., Ajiki, M., Nagao, T., Fujita, S. S., Kakazu, Y., Komiyama, Y., et al. 2002, PASJ, 54, 975
- Spergel et al. (2003) Spergel et al. 2003, astro-ph/0302209
- Steidel, Pettini, & Adelberger (2001) Steidel, C. C., Pettini, M., & Adelberger, K. L. 2001, ApJ, 546, 665
- Stern et al. (2003) Stern et al. 2003, ApJ, submitted
- Turner (1991) Turner, E. L. 1991, AJ, 101, 5
- Turner, Ostriker, & Gott (1984) Turner, E. L., Ostriker, J. P., & Gott, J. R. 1984, ApJ, 284, 1
- Warren, Hewett, Irwin, & Osmer (1987) Warren, S. J., Hewett, P. C., Irwin, M. J., & Osmer, P. S. 1987, Nature, 330, 453
- White, Becker, Fan, & Strauss (2003) White, R. L., Becker, R. H., Fan, X., & Strauss, M. A. 2003, AJ, 126, 1
- Willott, McLure, & Jarvis (2003) Willott, C. J., McLure, R. J., & Jarvis, M. J. 2003, ApJ, 587, L15
- Wyithe (2003) Wyithe, J. S. B. 2003, astro-ph/0308290
- (61) Wyithe, J. S. B. & Loeb, A. 2002a, ApJ, 577, 57
- (62) —. 2002b, Nature, 417, 923
- Yamada et al. (2003) Yamada et al. 2003, astro-ph/0306450
- York, Adelman, Anderson, Anderson, Annis, Bahcall, Bakken, Barkhouser, Bastian, Berman, Boroski, Bracker, Briegel, Briggs, Brinkmann, Brunner, Burles, Carey, Carr, Castander, Chen, Colestock, Connolly, Crocker, Csabai, Czarapata, Davis, Doi, Dombeck, Eisenstein, Ellman, Elms, Evans, Fan, Federwitz, Fiscelli, Friedman, Frieman, Fukugita, Gillespie, Gunn, Gurbani, de Haas, Haldeman, Harris, Hayes, Heckman, Hennessy, Hindsley, Holm, Holmgren, Huang, Hull, Husby, Ichikawa, Ichikawa, Ivezić, Kent, Kim, Kinney, Klaene, Kleinman, Kleinman, Knapp, Korienek, Kron, Kunszt, Lamb, Lee, Leger, Limmongkol, Lindenmeyer, Long, Loomis, Loveday, Lucinio, Lupton, MacKinnon, Mannery, Mantsch, Margon, McGehee, McKay, Meiksin, Merelli, Monet, Munn, Narayanan, Nash, Neilsen, Neswold, Newberg, Nichol, Nicinski, Nonino, Okada, Okamura, Ostriker, Owen, Pauls, Peoples, Peterson, Petravick, Pier, Pope, Pordes, Prosapio, Rechenmacher, Quinn, Richards, Richmond, Rivetta, Rockosi, Ruthmansdorfer, Sandford, Schlegel, Schneider, Sekiguchi, Sergey, Shimasaku, Siegmund, Smee, Smith, Snedden, Stone, Stoughton, Strauss, Stubbs, SubbaRao, Szalay, Szapudi, Szokoly, Thakar, Tremonti, Tucker, Uomoto, Vanden Berk, Vogeley, Waddell, Wang, Watanabe, Weinberg, Yanny, & Yasuda (2000) York, D. G., Adelman, J., Anderson, J. E., Anderson, S. F., Annis, J., Bahcall, N. A., Bakken, J. A., Barkhouser, R., et al. 2000, AJ, 120, 1579
- Yu & Tremaine (2002) Yu, Q. & Tremaine, S. 2002, MNRAS, 335, 965
| SDSSp J | Redshift | SDSS | HST | Reference |
|---|---|---|---|---|
| 104433.04012502.2 | 5.74 | 19.3 | 19.91 | 1 |
| 083643.85+005453.3 | 5.82aaStern et al. (2003) find from CIII] emission. | 18.79 | 19.49 | 2 |
| 130608.26+035626.3 | 5.99 | 19.46 | 20.23 | 2 |
| 103027.10+052455.0 | 6.30bbCorrected from using a fit to templates that allow for emission line blueshifts (Richards et al. 2002). | 20.02 | 20.54 | 2 |
Note. — Column (1) lists the J2000 coordinates, column (2) the redshift, columns (3) and (4) give SDSS and HST -band magnitudes and column (5) gives the discovery references, which are are (1) Fan et al. (2000) and (2) Fan et al. (2001a).
| -25.48 | -26.05 | -26.51 | |
| -24.73 | -24.42 | -24.12 | |
| diff | 0.75 | 1.63 | 2.39 |
| 0.21% | 0.29% | 0.37% | |
| Prob. | 1.2% | 3.5% | 8.2% |
Note. — The rows are (1) the absolute magnitude at mag, (2) from the Wyithe & Loeb (2002a) quasar LF, (3) the difference of the above two, (4) the multiple lensing optical depth (i.e., fraction of lines of sight subject to lensing), and (5) the lensing optical depth with bias, assuming slope .