IBIS performances during the Galactic Plane Scan ††thanks: Based on observations with INTEGRAL, an ESA project with instruments and science data centre funded by ESA member states (especially the PI countries: Denmark, France, Germany, Italy, Switzerland, Spain), Czech Republic and Poland, and with participation of Russia and USA.
The Plane of our Galaxy is regularly observed by the INTEGRAL satellite by means of scheduled scans. We present here results from the IBIS/ISGRI instrument using data from the first two Galactic Plane Scans performed at the end of the Performance Verification phase, while INTEGRAL was pointed towards the Cygnus region.
Considering the predicted IBIS sensitivity, we expected three persistent sources to be detectable: Cyg X–1, Cyg X–3, Cyg X–2 , in order of decreasing intensity in the hard-X energy range (15 keV). In addition to these sources, our analysis revealed two more transient sources, confirming the unprecedented IBIS sensitivity. For each exposure (2200 s) of the two scans, we report on detected source fluxes, variabilities and localisation accuracies.
Key Words.:
Galactic Plane – X-ray binaries – coded mask telescope – gamma-ray astronomydelsanto@rm.iasf.cnr.it
1 Introduction
IBIS (Ubertini et al. (2003)) is the coded mask telescope on board of the INTEGRAL satellite (Winkler et al. 2003a ) dedicated to fine imaging ( angular resolution FWHM) of gamma-ray sources. Thanks to its large field of view (2929∘ zero response) and wide energy range (15 keV–10 MeV), IBIS will monitor the gamma-ray sky for the next 2+3 years, depending on ESA approvals for extension of the operations. During the first year, the INTEGRAL observing programme is dedicated for of the time to the General Programme (open time) and for to the Core Programme (CP), that is the guaranteed time reserved to the INTEGRAL Science Working Team (ISWT).
The CP consists of three parts:
-
-
GCDE, Galactic Centre Deep Exposure
-
-
GPS, Galactic Plane Scan
-
-
Pointed observations, including Targets of Opportunity (ToOs)
In the GPS, the Galactic plane is scanned performing a “” pattern of 37 min individual exposures separated by with respect to the scan path (Winkler et al. 2003b ). Additionally, in the GCDE the Galactic Centre region will be observed deeply by closer (separations and in latitude and longitude, respectively) and shorter (30 min) pointings.
During the GPS programme the main IBIS goals are: discovering new transients, studying the long term evolution of persistent sources, monitoring the frequent outbursts of sources in the hard X-rays. Most of these sources are X-ray binaries, both in low or high mass systems, with a black hole or neutron star as compact object.
So far, during the CP eight new transients have been discovered by the CdTe detector layer (ISGRI) of IBIS (Lebrun et al. (2003)). These sources show different features: quick variability, weak emission and soft spectrum as for IGR J16358–4726 (Revnitsev et al. 2003a ), strong flux and hard spectrum in the IGR J17464-3213 case (Revnitsev et al. 2003b ). Usually, after the discovery of a new source, follow up observations (i.e. by XMM-Newton, Chandra, RXTE) and searches in the data archives are performed. For example, IGR J16320-4751 (discovered by INTEGRAL during an open time observation) has been observed by XMM-Newton (Rodriguez et al. 2003a ) and it has been consistently detected in a reanalysis of the data collected in 1996–2002 with the BeppoSAX-WFC (in ’t Zand et al. (2003)).
During the Performance Verification (PV) phase, the first GPS has been performed in the Cygnus region: Cyg X–1, Cyg X–2 and Cyg X–3 were expected to be detected and localized. These three sources have different natures: Cyg X–1 is a black hole candidate in a high mass system, characterized by state transitions, and during our observation was in its so-called hard state (Zdziarski et al. (2002) and references therein); Cyg X–2 is a bright low mass X-ray binary (LMXRB) classified as Z source, showing Type-I X-ray bursts (Kuulkers et al. (1995)); Cyg X–3 is a high mass X-ray binary (HMXRB) which with its typical radio jets is one of the dozen galactic binaries classified as microquasar (see list in Distefano et al. (2002)), even though the black hole or neutron star nature is still unknown (Hannikainen et al. (2003)).
2 Observations and Data Analysis
During revolution (rev.) 25 on December 2003 and rev. 26 on December , two scans of the Galactic Plane were performed in the Cygnus region with a total of 21 pointings: 11 in rev. 25 and 10 in rev. 26.
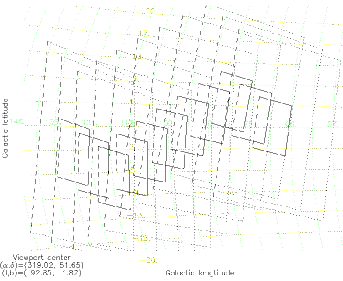
The difference between the two GPS is that the first scan started from going on for roughly 57∘ towards the Galactic Centre, whereas the second one has been performed in the opposite direction (Fig. 1). The continuous squares in Fig. 1 describe the limits of 99∘ IBIS fully coded field of view (FCFOV); the dashed ones define the total instrument field of view: FCFOV plus partially coded field of view (PCFOV). Details of the first and last scan of each revolution are given in Tab. 1.
| Exposure | Duration | Pointing coordinates (J2000) | |
|---|---|---|---|
| number | (s) | R.A. | Dec |
| 00250026 () | 2263 | ||
| 00250036 () | 2200 | ||
| 00260002 () | 4088 | ||
| 00260011 () | 3781 | ||
We analysed consolidated data re-processed by the INTEGRAL Science Data Centre (ISDC) system (Courvoisier et al. (2003)), and we used the IBIS analysis software (Goldwurm et al. (2003)) delivered by the ISDC to the wide scientific community on May 2003 within the total INTEGRAL Off-line Scientific Analysis software (OSA 1.1). For each exposure, we have extracted images in three different energy ranges: 20–40 keV, 40–80 keV, 80–160 keV. In the software release there is a complete X-ray and gamma-ray sources catalogue prepared by Ebisawa et al. (2003), which is used as OSA input in order to distinguish known and new sources. No new sources have been found in the Cygnus region during the observations presented in this paper.
Furthermore, of the three sources which we expected to see, we have extracted for the strongest, Cyg X–1, a spectrum for the first pointing of rev. 26, when the source was in the FCFOV. We compared its count rate spectrum to that obtained for the Crab in an on-axis observation (rev. 39), since the spectral responses for fully coded sources are comparable and better known. In general, the spectral binning is selected giving the response matrix (rmf) as input. For our analysis, the IBIS/ISGRI original 2048 linear elements of the rmf have been rebinned to 64 non-linear energy channels.
3 Results
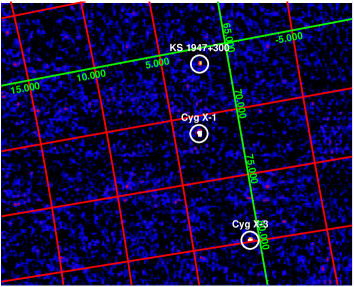
During the observations, the three expected sources were immediately detected in the preliminary near real time analysis (Courvoisier et al. (2003)). Using the last delivered software and performing a deeper analysis, also the transient X-ray pulsar SAX J2103.5+4545 has been detected in rev. 25 as reported by Lutovinov et al. (2003) and was still present in rev. 26. Moreover, we found in two pointings a statistically significant signal corresponding to the position of the KS 1947+300, a HMXRB in Be system; in Fig.2 the 20–40 keV image obtained from exposure 00250036 is shown. This transient was also revealed in the 40–80 keV and 80–160 keV bands.
Informations concerning all source detections for the range 20–40 keV are given in Tab. 2. Of the available 21 pointings, we had source detections in only 8 exposures. In the energy range 40–80 keV, the three objects Cyg X–1, Cyg X–3 and KS 1947+300 have been detected; Cyg X–1 and KS 1947+300 are still visible in 80–160 keV. In Tab. 3 the intensities of the three latter sources are given as measured in pointing 00250036. We found evident flux variations for these sources.
However, in this first phase of the mission, we must be careful with the interpretation of such variations since these could partly be caused by systematic effects which have to be investigated further.
| §Source | Flux | Offset | Off-axis angle |
|---|---|---|---|
| (mCrab) | (arcmin) | (∘) | |
| Exposure n∘ 00250032 | |||
| Cyg X–3 | 3.0 | 14.7 | |
| Cyg X–2 | 3.0 | 11.6 | |
| Exposure n∘ 00250033 | |||
| Cyg X–3 | 1.2 | 9.0 | |
| J2103.5+4545 | 2.7 | 1.8 | |
| Exposure n∘ 00250034 | |||
| Cyg X–1 | 392 | 1.5 | 11.9 |
| Cyg X-3 | 151 | 0.6 | 3.7 |
| Exposure n∘ 00250035 | |||
| Cyg X–1 | 410 | 0.6 | 6.4 |
| Cyg X–3 | 175 | 1.1 | 4.2 |
| Exposure n∘ 00250036 | |||
| Cyg X–1 | 410 | 0.4 | 3.4 |
| Cyg X–3 | 157 | 1.9 | 9.9 |
| KS 1947+300 | 65 | 1.3 | 7.2 |
| Exposure n∘ 00260002 | |||
| Cyg X–1 | 390 | 0.6 | 2.1 |
| Cyg X–3 | 150 | 1.7 | 6.7 |
| KS 1947+300 | 55 | 1.4 | 7.2 |
| Exposure n∘ 00260003 | |||
| Cyg X–1 | 386 | 1.2 | 7.6 |
| Cyg X–3 | 168 | 0.7 | 3.8 |
| Exposure n∘ 00260005 | |||
| Cyg X–3 | 132 | 1.2 | 11.0 |
| J2103.5+4545 | 2.7 | 1.8 | |
§ If present in the field of view, all these sources have been detected at least in the lowest energy range.
Using a Crab calibration observations of 100 ks duration, we verified that a spectral fit with the known Crab spectrum gives an acceptable with only systematic deviations at the level for energies below 70–100 keV.
For Cyg X–1 and Cyg X–3 the offset with respect to SIMBAD position vs energy has been evaluated in the exposures 00250036 and 00250034 respectively, those are when the two sources are fully coded. As expected, the point source location accuracy (PSLA) improves for stronger sources (Tab. 4).
In order to give a first indication of the IBIS/ISGRI spectral capabilities, the Cyg X–1 count rate normalized to the Crab one is plotted in Fig. 3. In spite of the short integration time, Cyg X–1 is detected above 200 keV (for a complete Cyg X–1 spectral analysis see Laurent et al. (2003) and Pottschmidt et al. (2003)).
| Energy range | Cyg X–1 | Cyg X–3 | KS 1947+300 |
|---|---|---|---|
| (keV) | (mCrab) | (mCrab) | (mCrab) |
| 20–40 | 410 | 157 | 65 |
| 40–80 | 405 | 64 | 59 |
| 80–160 | 165 | – | 37 |
| Energy range | Cyg X–1 offset | Cyg X–3 offset |
|---|---|---|
| (keV) | (arcmin) | (arcmin) |
| 20–40 | 0.4 | 0.6 |
| 40–80 | 0.6 | 1.1 |
| 80–160 | 0.7 | – |
4 Discussion
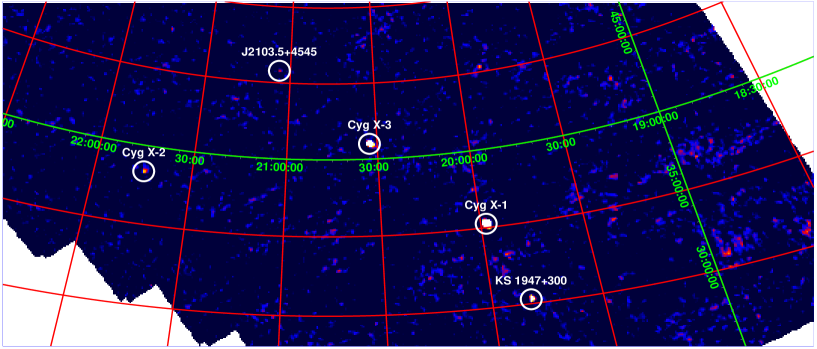
We have demonstrated (see Tab. 2) that we can give a lower limit for the IBIS/ISGRI source detection sensitivity (5 in 2200s) of 20 mCrab in the 20–40 keV band, in good agreement with Rodriguez et al. (2003b). Collecting a larger amount of GPS data we expect to detect more transients and new sources. For example, SAX J2103.5+4545 that is quite imperceptible in one exposure image, becomes visible on the summed mosaic map (Fig. 4).

In the short exposures of the GPS, the point source location accuracy (PSLA) of faint sources in the FCFOV is 2.7′ based on the SAX J2103.5+4545 detection. For a strong source like Cyg X–1, we find an offset of 0.4′. As expected, when the source is far away from the pointing direction the PSLA is worse; in fact Cyg X–1 at an off-axis angle of 11.6∘ was measured with an offset of 3.0′.
The statistical errors of the PSLA are significantly larger than the theoretical values and clearly dominated by systematics (Gros et al. (2003)), mainly due to the misalignment rotation matrix computed at ISDC (Walter et al. (2003)) in order to correct the offset between the telescope axis and the axis of the star sensors.
Finally, during the GPSs of revolutions 25 and 26, IBIS/ISGRI detected Cyg X–1 at a flux level of roughly 400 mCrab for energies 20–40 keV. The flux was variable, as also reported in Bazzano et al. (2003). Furthermore from Fig. 3 the black hole candidate exhibits a harder spectrum than the Crab below 50 keV and softer above roughly 150 keV, which is a confirmation of the known spectral shape of Cyg X–1 in its hard state.
Acknowledgements.
This work has been partially supported by the Italian Space Agency (ASI).MDS thanks Aleksandra Gros (CEA–Saclay) for the software support during the data analysis.
MDS, FC, LF thank the INTEGRAL Science Data Centre for the hospitality during some part of this work.
JR acknowledges financial support from the French Spatial Agency (CNES).
References
- Bazzano et al. (2003) Bazzano A., Bird T., Capitanio F., et al. 2003, A&A, this volume
- Courvoisier et al. (2003) Courvoisier T.J.-L., Walter R., Beckmann V., et al. 2003, A&A, this volume
- Distefano et al. (2002) Distefano C., Guetta D., Waxman E., Levinson A. 2002, ApJ, 575, 378
- Ebisawa et al. (2003) Ebisawa K., Bourban G., Bodaghee A., Mowlavi N., Courvoisier T.J.-L. 2003, A&A, this volume
- Goldwurm et al. (2003) Goldwurm A., David P., Foschini L., et al. 2003, A&A, this volume
- Gros et al. (2003) Gros A., Goldwurm A., Cadolle-Bel M., et al. 2003, A&A, this volume
- Hannikainen et al. (2003) Hannikainen D. C., McCollough M. L., Vilhu O., et al. 2003, HEAD 35.1709H, AAS
- in ’t Zand et al. (2003) in ’t Zand J. J. M., Ubertini P., Capitanio F., Del Santo M. 2003, IAUC 8077
- Kuulkers et al. (1995) Kuulkers E., van der Klis M., van Paradijs J. 1995, ApJ, 450, 748
- Laurent et al. (2003) Laurent P., Cadolle-Bel M., Bazzano A., et al. 2003, A&A, this volume
- Lebrun et al. (2003) Lebrun F., Leray J. P., Lavocat P., et al. 2003, A&A, this volume
- Lutovinov et al. (2003) Lutovinov A., Molkov S., Revnivtsev M. 2003, Astronomy Letters, to be published
- Pottschmidt et al. (2003) Pottschmidt K., Wilms J., Chernyakova M., et al. 2003, A&A, this volume
- (14) Revnitsev M., Tuerler M., Del Santo M., et al. 2003a, IAUC 8097
- (15) Revnitsev M., Chernyakova M., Capitanio F., et al. 2003b, ATEL #132
- (16) Rodriguez J., Tomsick J. A., Foschini L., et al. 2003a, A&A, 407, L41
- Rodriguez et al. (2003b) Rodriguez J., Del Santo M., Lebrun F., et al. 2003b, A&A, this volume
- Ubertini et al. (2003) Ubertini P., Lebrun F., Di Cocco G., et al. 2003, A&A, this volume
- Walter et al. (2003) Walter R., Favre P., Dubath P., et al. 2003, A&A, this volume
- (20) Winkler C., Courvoisier T.J.-L., Di Cocco G., et al. 2003a, A&A, this volume
- (21) Winkler C., Gehrels N., Schnfelder V., et al. 2003b, A&A, this volume
- Zdziarski et al. (2002) Zdziarski A., Poutanen J., Paciesas W.S., Wen L. 2002, ApJ, 578, 357