Neutron star mergers versus core-collapse supernovae as dominant r-process sites in the early Galaxy
The astrophysical nature of r-process sites is a long standing mystery and many probable sources have been suggested in the past, among them lower-mass core-collapse supernovae (in the range ), higher-mass core-collapse supernovae (with masses ) and neutron star mergers. In this work, we present a detailed inhomogeneous chemical evolution study that considers for the first time neutron star mergers as major r-process sources, and compare this scenario to the ones in which core-collapse supernovae act as dominant r-process sites. We conclude that, due to the lack of reliable iron and r-process yields as function of progenitor mass, it is not possible at present to distinguish between the lower-mass and higher-mass supernovae scenarios within the framework of inhomogeneous chemical evolution. However, neutron-star mergers seem to be ruled out as the dominant r-process source, since their low rates of occurrence would lead to r-process enrichment that is not consistent with observations at very low metallicities. Additionally, the considerable injection of r-process material by a single neutron-star merger leads to a scatter in [r-process/Fe] ratios at later times which is much too large compared to observations.
Key Words.:
Physical processes: nucleosynthesis – Stars: abundances – ISM: abundances – Galaxy: abundances – Galaxy: evolution – Galaxy: halo1 Introduction
The principal production mechanisms of heavy elements beyond the iron-peak are known since the classical paper by Burbidge, Burbidge, Fowler & Hoyle (B2FH, b2fh (1957)): A major fraction of these elements is formed by slow or rapid capture of neutrons on seed nuclei. These nucleosynthesis channels are denoted as the s-process, if the capture of neutrons occurs on timescales slower than the -decay timescales of the newly formed nuclei, or as the r-process, if neutron capture operates on timescales much shorter than the relevant -decay timescales. Yet, although the physical requirements for the occurrence of r-process nucleosynthesis are well understood (see e.g. Pfeiffer et al. pf01 (2001)), the astrophysical nature of the dominant r-process site is still unknown.
Ultra metal-poor halo stars were formed when the s-process had little time to make any significant contribution to the interstellar medium (ISM). The abundance pattern of neutron capture elements heavier than Ba () in these stars matches the scaled solar system r-process abundances remarkably well. This suggests that, contrary to s-process nucleosynthesis, the synthesis of r-process elements started early in galactic evolution and that the r-process is robust for elements heavier than Ba, i.e. originates from a single astrophysical site or at least occurs under well defined physical conditions (e.g. Sneden et al. 2000a ; Westin et al. we00 (2000); Cowan et al. co02 (2002); but see also Hill et al. vh02 (2002)). On the other hand, lighter neutron capture elements () in ultra metal-poor halo stars show significant deviations from the scaled solar system r-process abundance curve, indicating the possible existence of a second r-process source. The diversity of r-process sources was first proposed based on meteoritic data, which seem to require two r-process sources operating on different timescales, namely years for the production of nuclei and years for nuclei (Wasserburg et al. wa96 (1996)). In principle, these two r-process sites could either be two types (frequent and less common) of core-collapse supernova (SN II) events (Wasserburg & Qian wa00 (2000); Qian qi00 (2000); qi01 (2001)), or a mixture of SNe and neutron star mergers (Rosswog et al. ro99 (1999); ro00 (2000)). On the other hand, Cameron (cm01 (2001)) showed that it is possible to reproduce the abundance distribution of both light and heavy neutron capture elements in different regions of a single source, namely the accretion-disk and jet forming near the proto-neutron star in SN II events. However, the evidence that the r-process beyond Ba (at least in the range ) is robust is very convincing and we will use this property in the following to gain some insight into the enrichment of the Galaxy with r-process elements beyond Ba.
A number of possible astrophysical sites responsible for the robust r-process were put forth in the past, most of them linked to the violent death of massive stars in supernova events. Wheeler et al. (wh98 (1998)) suggested that, during the prompt explosion of a massive star in the range , physical conditions in the innermost mass layers are sufficiently extreme for the r-process to work and that the amount of r-process matter ejected may be consistent with observed Galactic r-process abundances. This is in agreement with detailed r-process calculations based on an artificially induced prompt explosion of an progenitor (Sumiyoshi et al. sm01 (2001)). However, there are major objections to the prompt explosion mechanism from detailed studies by Bruenn (1989a , 1989b ). Optimistically speaking, if prompt explosions of massive stars may occur in reality, lower-mass progenitors are the only ones that show any hope to do so (e.g. Wheeler et al. wh98 (1998); Sumiyoshi et al. sm01 (2001); but see also Liebendörfer et al. li01 (2001)).
On the other hand, neutrino-driven winds from nascent neutron-stars were also proposed as a promising site for r-process nucleosynthesis (e.g. Woosley & Hoffman wo92 (1992); Takahashi et al. tk94 (1994); Woosley et al. wo94 (1994); Qian & Woosley qi96 (1996); Thompson et al. tp01 (2001); Wanajo et al. wn01 (2001); Terasawa et al. te02 (2002)). Following the delayed explosion of a very massive star (), neutrinos diffusing out of the contracting proto-neutron star heat and ablate material from its surface and a neutrino-driven wind develops. Such winds may exhibit sufficiently high entropies and/or sufficiently short dynamical timescales for the r-process to occur. However, r-process yields consistent with observed r-process abundances in stars may be obtained in this scenario only for extreme assumptions such as massive neutron stars of or more, which makes this not a very likely scenario. Furthermore, it seems questionable whether the high entropies required to reproduce the solar system r-process signature (e.g. Meyer & Brown mb97 (1997); Freiburghaus et al. 1999a ) can be provided by Type II supernovae (Witti et al. wi94 (1994); Qian & Woosley qi96 (1996); Thompson et al. tp01 (2001)).
It should be noted that the r-process scenarios associated with core-collapse supernovae discussed above are affected by considerable theoretical uncertainties since the physics of these events is not really understood (e.g. Rampp & Janka ra00 (2000); Liebendörfer et al. li01 (2001)). Recently, Freiburghaus et al. (1999b ) presented for the first time detailed r-process calculations for neutron star mergers (NSM). Coalescing neutron stars potentially can provide in a natural way the large neutron fluxes required for the build-up of heavy elements through rapid neutron capture. This scenario was subsequently explored and refined by Rosswog et al. (ro99 (1999); ro00 (2000)). Their calculations showed that a few times of r-process matter might be ejected in a merger event. This amount is significantly larger than the typical of r-process material thought to be ejected in each core-collapse SN event (Cowan et al. co91 (1991); Woosley et al. wo94 (1994); Qian qi00 (2000); Wanajo et al. wn01 (2001)). Since the rate of NSM in the Galaxy is significantly lower than that of Type II SNe (e.g. Tamman et al. tm94 (1994); Belczynski et al. bl02 (2002)), either of these two sources may account for the total amount of r-process matter in the Galaxy (Qian & Woosley qi96 (1996); Rosswog et al. ro99 (1999); Rosswog & Davies ro02 (2002); Thielemann et al. th02 (2002)).
However, Qian (qi00 (2000)) argued that if NSM were a major r-process source, the low coalescence rate of binary compact objects would prevent any correlation between abundances of r-process elements and iron, which is clearly in disagreement with observed r-process abundances in stars more metal-rich than [Fe/H] . In addition, the large amount of r-process ejecta from NSM would lead to r-process abundances in metal-poor halo stars that would be too large compared to observations. These arguments deserve closer examination, especially since no detailed chemical evolution calculations exist to date that assume NSM to be the major r-process source. Chemical evolution studies that treat SN with either lower-mass () or higher-mass () progenitors as the major r-process source were carried out by Ishimaru & Wanajo (is99 (1999)), Travaglio et al. (tr99 (1999)) and Tsujimoto et al. (ts00 (2000)). Unfortunately, each of these studies favoured different r-process sites: lower-mass SNe (Travaglio et al. tr99 (1999)), higher-mass SNe (Tsujimoto et al. ts00 (2000)), or both (Ishimaru & Wanajo is99 (1999)) are acceptable from the viewpoint of chemical evolution.
The purpose of this work is twofold. First, neutron star mergers are included as major r-process site in detailed chemical evolution calculations for the first time. Second, we compare the r-process enrichment of the ISM under the assumption that neutron star mergers, lower-mass SNe II or higher-mass SNe II are the dominant r-process sites in the framework of inhomogeneous chemical evolution. In Sect. 2, the inhomogeneous chemical evolution model is presented. The impact of SNe II and NSM as r-process sites on Galactic chemical evolution is studied in Sect. 3 and conclusions are presented in Sect. 4.
2 The chemical evolution model
The large scatter seen in the abundances of neutron capture elements in metal-poor halo stars is generally attributed to local chemical inhomogeneities of the interstellar medium during the earliest stages of Galaxy formation and enrichment (e.g. McWilliam et al. 1995a , 1995b ; Ryan et al. ry96 (1996); Burris et al. br00 (2000); Mishenina & Kovtyukh mi01 (2001)). Several authors developed chemical evolution models (Ishimaru & Wanajo is99 (1999); Raiteri et al. ri99 (1999); Tsujimoto et al. ts99 (1999), ts00 (2000); Argast et al. ar00 (2000); Travaglio et al. tr01 (2001), Fields et al. fi02 (2002)) that investigate the impact of local chemical inhomogeneities on the enrichment of the ISM and the scatter in element abundances. Although the methods employed by these authors differ significantly, the model results are in qualitative agreement. The notion of inhomogeneous chemical evolution therefore seems to be well established.
In the present work we use the stochastic chemical evolution model presented in Argast et al. (ar00 (2000), hereafter Paper I) to investigate the enrichment of the ISM with r-process elements. In the following, we give a short summary of the model and discuss some major changes (mass infall, star formation rate, SN Ia events and r-process sites) that were implemented for this work.
2.1 Basic ingredients
We model the chemical enrichment of the halo ISM within a volume of (2.0 kpc)3, down to a resolution of (50 pc)3. Primordial matter is assumed to be falling into this volume, following an infall law of the form
| (1) |
Instead of specifying parameters and directly, we use the fact that with this description the time of maximal infall, , is given by
| (2) |
and that the total mass, , falling into the volume is
| (3) |
where is the age of the system. The infall law is therefore fully described by the parameter set .
A crucial ingredient of chemical evolution models is the treatment of star formation (SF). Unfortunately, it is also one of the least understood. In this work we adopt a simple SF description based on Schmidt’s law (Schmidt sch59 (1959)). The number of stars that are formed per time-step (of duration yr) is determined by the product
| (4) |
where is the local ISM density at time in a cell of volume (50 pc)3 and the sum goes over all cells in the volume (). The parameter determines the star formation efficiency, and possible values for range from 1 (SF proportional to gas density) to 2 (SF triggered by cloud-cloud collisions, Larson la91 (1991)). The factor was introduced to keep the number of newly formed stars independent of the model resolution, so that Eq. 4 gives if the ISM is homogeneously distributed (i.e. for all ).
The mass of a newly formed star is chosen randomly, subject to the condition that the mass distribution of all stars follows a Salpeter initial mass function () with lower and upper mass limits of and , respectively. The average mass of a star is given by the initial mass function (IMF) as
| (5) |
The number of star formation events translates into an average star formation rate (SFR) at each time-step by multiplying the average stellar mass , i.e.
| (6) |
The cells that undergo star formation are also chosen randomly, though the probability for a cell to get selected scales with its density. In this prescription, patches of denser material, e.g. in the neighbourhood of a supernova remnant, are predominantly chosen for star formation events. Note that a cell is allowed to form stars only if it contains at least of gas. This restriction is imposed, so that SF is not biased towards low mass stars. With the imposed limit, a star formed in a cell can be of any mass in the range . Consequently, no SF will occur until enough material has fallen into the volume to exceed this limit. Due to the stochastic nature of our SF prescription, small deviations from the average SFR in Eq. 6 have to be expected at each time-step. Newborn stars inherit the abundance pattern of the ISM out of which they formed, thus carrying information about the chemical composition of the ISM at the place and time of their birth.
Low mass stars () do not evolve significantly during the considered time but serve to lock up part of the total mass, thus affecting the abundances of elements with respect to hydrogen. Stars of intermediate mass () return most of their mass at the end of their stellar lifetime, leaving a white dwarf as stellar remnant. Stars in the mass range of are assumed to explode as SNe II, polluting the neighbouring ISM with their highly enriched ejecta. Stellar lifetimes are taken from the Geneva Stellar Evolution and Nucleosynthesis Group (cf. Schaller et al. sl92 (1992); Schaerer et al. 1993a ; Schaerer et al. 1993b ; Charbonnel et al. cb93 (1993)). Stellar yields of O, Mg, Si, Ca and Fe are taken from Thielemann et al. (th96 (1996)) and Nomoto et al. (no97 (1997)) and are scaled according to Samland (sa98 (1998)) to account for the global chemical enrichment of the Galaxy. In particular, Fe yields are reduced by a factor of two.
SN events pollute the neighbouring ISM with their nucleosynthesis products and sweep up the material in a spherical, chemically well mixed shell. Here, it is assumed that each SN pollutes of ISM (Ryan et al. ry96 (1996); Shigeyama & Tsujimoto sh98 (1998)). Stars which form out of material enriched by a single SN II show an element abundance pattern that is characteristic of the yields for the particular progenitor of this SN II. This will lead to a large scatter in element abundance ratios ([el/Fe]) as long as local inhomogeneities caused by SN II events dominate the halo ISM. As time progresses, supernova remnants overlap and the abundance pattern in each cell approaches the average defined by SN II yield patterns for different progenitor masses and the IMF. This leads to a decrease of the scatter in element abundance ratios at later times.
To determine which intermediate mass stars form Type Ia SN events, we adopt the following simple procedure: With probability a newly formed intermediate mass star has a companion in the same mass range and one of these two stars will end its life as SN Ia. The mass of the companion (again in the range and following a Salpeter IMF) is determined randomly and the SN Ia event occurs after the less massive of the two stars enters the red giant phase. Although this procedure admittedly is rather simple, it has the advantage that the SN Ia frequency is determined by only one free parameter, namely the probability . This parameter is chosen in such a way that the slope observed in [/Fe] abundance ratios at [Fe/H] is reproduced. We chose as upper mass limit for SN Ia progenitors to be consistent with the lower mass limit of SN II. Since we use such a simplified description to determine the occurrence of SN Ia, the upper mass limit of SN Ia progenitors is not very relevant: Assuming a Salpeter IMF, more than 99% of the binary systems will consist of stars with masses each. Finally, the yields of Type Ia SNe are taken from Iwamoto et al. (iwetal99 (1999), Model CDD2). Note, that if revised, i.e. reduced electron capture rates are applied (see Brachwitz et al. brach00 (2000)), the yields of model CDD2 correspond to those of model WDD2, which are more accurate in terms of central conditions.
| Parameter | Description | Value |
|---|---|---|
| modelled volume | 8 kpc3 | |
| total system mass | ||
| infall decline timescale | Gyr | |
| time of maximal infall | Gyr | |
| age of the system | Gyr | |
| SF efficiency | ||
| exponent of SF law | ||
| lower IMF mass limit | ||
| upper IMF mass limit | ||
| SN Ia probability |
In Table 1 we list the parameter values adopted for our standard model.
2.2 Treatment of r-process sources in the model
An ideal element to trace the r-process enrichment of the ISM is the pure r-process element Europium; approximately 97% of the solar Eu abundance was produced in r-process events (Burris et al. br00 (2000)). Unfortunately, only a small sample of Eu abundances at very low metallicities (i.e. [Fe/H] ) are available to date. In order to trace the r-process enrichment at lower metallicities, the well studied element Barium is also used in this investigation. Ba abundances in stars are dominated by the s-process, and only of the solar Ba abundance was formed by rapid neutron capture (Burris et al. br00 (2000)). However, the r-process fraction [Bar/Fe] of Ba abundances in stars can be easily calculated by subtracting the s-process component from its total Ba abundance (c.f. Burris et al. br00 (2000)). Since we did not include s-process sources in our model, displayed Bar abundances in Sect. 3 of model and halo stars only show the r-process contribution to the total Ba abundances.
In the following, r-process yields of Eu and Ba are estimated under the assumption of a robust r-process for nuclei more massive than Ba, i.e. only one source is responsible for the enrichment of the ISM with r-process elements beyond Z=56. In this work we focus only on these heavier neutron capture elements, since the enrichment of lighter neutron capture elements may require a second, independent source (e.g. Wasserburg et al. wa96 (1996)). Thus, r-process matter ejected in an r-process event is considered to consist of pure r-process nuclei more massive than Ba. First, the mass fractions of Ba and Eu are calculated with the help of Table 5 in Burris et al. (br00 (2000)) and the standard solar system element abundances of Anders & Grevesse (ag89 (1989)):
| (7) |
| (8) |
where is the number fraction of r-process nuclei of a nuclear species , its mean atomic weight and the sum goes over all elements beyond Ba (). Final yields are estimated by multiplying these mass fractions with the mass ejected in an r-process event, i.e.
| (9) |
| (10) |
The total ejected r-process matter, , is either deduced from observational evidence and/or theoretical considerations or is treated as a free parameter that is adjusted so that the results of the chemical evolution model are consistent with observations.
We now shortly discuss the implementation of lower-mass SNe (), higher-mass SNe () and NSM as r-process sites in our model. We did not consider a hybrid model, where different r-process sites contribute to the enrichment of the ISM with neutron capture elements. Instead, it is assumed that for each of the three cases the corresponding site is responsible for the whole r-process element inventory (with ) of the Galaxy, i.e. is the major source of r-process elements beyond Ba.
2.2.1 r-process yields from core-collapse SNe in the mass range
Lower mass core-collapse SNe () are suspected to be major r-process sources without contributing much iron-peak elements to the enrichment of the ISM (Wheeler et al. wh98 (1998)). Recently, Sumiyoshi et al. (sm01 (2001)) presented results of r-process nucleosynthesis occurring during the artificially induced prompt explosion of an star. The resulting distribution of r-process yields is in reasonable agreement with solar r-process abundances for the heavier elements, whereas lighter r-process elements (A ) are underproduced. Since elements in this mass-regime are often overproduced in neutrino driven wind models, the authors speculate that lower-mass SNe II might be responsible for the production of massive r-process nuclei, whereas higher-mass SNe II account for the less massive r-process nuclei. Note however, that it is still doubtful if the prompt explosion of a massive star may occur in reality (Liebendörfer et al. li01 (2001); Sumiyoshi et al. sm01 (2001)). Chemical evolution models including lower mass SNe as r-process source were presented by Ishimaru & Wanajo (is99 (1999)) and Travaglio et al. (tr99 (1999)).
In the treatment of such lower-mass SNe, we proceed similar to Ishimaru & Wanajo (is99 (1999)): In model SN810, r-process nucleosynthesis is assumed to occur in the mass range with constant Ba and Eu yields over the whole mass range and assuming a Salpeter IMF. The yields then are deduced from the average [Eu/Fe] and [Bar/Fe] ratios (both ) of metal-poor halo stars: and , which equals to a total of of ejected r-process matter per event (Eqs. 9 and 10). Furthermore, we assume that the amount of - and iron peak elements synthesized in these SN II events are negligible (Hillebrandt et al. hi84 (1984)).
2.2.2 r-process yields from core-collapse SNe more massive than
Nucleosynthesis of r-process elements might also occur in neutrino driven winds or jets from nascent neutron-stars during the delayed explosion of high-mass stars with masses (e.g. Woosley & Hoffman wo92 (1992); Takahashi et al. tk94 (1994); Woosley et al. wo94 (1994); Qian & Woosley qi96 (1996); Thompson et al. tp01 (2001); Nagataki na01 (2001); Wanajo et al. wn01 (2001), wn02 (2002); Terasawa et al. te02 (2002)). The physical conditions needed for a robust r-process in neutrino driven winds (such as high entropies, low electron fraction and/or short dynamical timescales) are hard to achieve in present models, and lighter r-process nuclei are often overproduced (e.g. Thompson et al. tp01 (2001)). As an example, Wanajo et al. (wn02 (2002)) require a very massive and compact proto-neutron star of to reproduce the solar system r-process abundance pattern of heavier neutron capture elements. By allowing for strong magnetic fields, Thompson (tp03 (2003)) finds that the required physical conditions are much more easily achieved than in previous models. Yet, there exist still some considerable theoretical uncertainties and only very high-mass stars seem to be capable of providing the environment for a robust r-process which reproduces the abundance pattern of neutron-capture elements beyond Ba.
Williams (wi87 (1987)) reported the detection of Ba absorption lines in the spectra of SN 1987A (progenitor mass ), and Mazzali et al. (mz92 (1992)) noted that Ba was lacking at the very surface of the ejecta. Because of this remarkable feature, Tsujimoto & Shigeyama (ts01 (2001)) identify SN 1987A as r-process site and estimate that of Ba were synthesized during the SN event. However, the poor knowledge of the far UV radiation field in the envelope of SN 1987A makes it difficult to determine a truly reliable Ba abundance in its ejecta (Utrobin & Chugai ut02 (2002)) and it is not yet established without doubt that the detected Ba was formed in the SN event. Complementary to the observation of Ba in SN 1987A, Tsujimoto et al. (ts00 (2000)) deduce Ba and Eu yields from observations of metal-poor halo stars and inhomogeneous chemical evolution models, suggesting that core-collapse SNe in the mass range dominate the production of r-process elements. They propose a Ba yield of for a and for a progenitor and a Eu yield of and for a and progenitor, respectively.
In a first model (SN2025), we adopt yields similar to the ones given by Tsujimoto et al. (ts00 (2000)) and assume that SNe outside the indicated mass range (i.e. ) do not contribute significantly to r-process nucleosynthesis. In this model, a star produces of Ba and of Eu, whereas a star yields of Ba and of Eu. For stars between and , the yields are interpolated linearly. Thus, a SN II in this mass range ejects on average of r-process matter. Compared to the r-process yields proposed by Tsujimoto et al. (ts00 (2000)) our yields are reduced by a factor of two. This is the case, since we had to scale the Fe yields of Thielemann et al. (th96 (1996)) by the same factor to account for the global chemical enrichment of the Galaxy.
As an alternative to model SN2025, we also calculated the chemical evolution of the ISM with r-process yields from SNe II in the mass range (model SN2050). The yields were chosen in such a way that the whole range of r-process abundances in metal-poor halo stars are reproduced in the model. The r-process yield of a star was set to , which is about three times the r-process yield of a star in model SN2025. This large amount of ejected r-process matter requires a rapid decline in the r-process yields of progenitors with masses . Otherwise, the average [r/Fe] ratios of model stars do not reproduce the observed average abundances of metal-poor halo stars ([r/Fe] ). Yields of progenitors in the mass range then are assumed to be constant. On average, of r-process matter are ejected in each event.
| 8a | |||
|---|---|---|---|
| 10 | |||
| 20b | |||
| 25 | |||
| 20c | |||
| 21 | |||
| 22 | |||
| 23 | |||
| 24 | |||
| 25 | |||
| 26 | |||
| 27 | |||
| 28 | |||
| 50 |
Remarks: aModel SN810, bModel SN2025, cModel SN2050
Table 2 lists our Ba yields and Eu yields and total ejected r-process matter as function of progenitor mass of models SN810, SN2025 and SN2050. We point out that the yields adopted in this work are chosen in such a way that observational constraints from metal-poor halo stars are respected. Whether these yields are feasible would have to be tested with the help of self-consistent core-collapse SN models, which, unfortunately, are not available to date.
2.2.3 r-process yields from neutron star mergers
Another major source of r-process elements might be neutron star mergers (Freiburghaus et al. 1999b ; Rosswog et al. ro99 (1999); ro00 (2000)). A scheme similar to the determination of SN Ia events was applied for the determination of their occurrence (c.f. Sect. 2.1): With probability a newly formed high mass star (in the range ) has a companion in the same mass range. It is assumed that, subsequent to both SN II events, the remaining neutron stars will eventually merge. The time that is needed for the coalescence of the two neutron stars and the probability for the occurrence of NSM events are treated as free parameters which can be adjusted within given observational estimates on the coalescence rate of binary compact objects and merger timescales (van den Heuvel & Lorimer vdH96 (1996); Kalogera & Lorimer ka00 (2000); Belczynski et al. bl02 (2002)). As was the case for SN Ia events, this treatment is very simple, but has the advantage that all difficulties associated with the determination of formation channels of neutron star binaries (or neutron star / black hole binaries) and the corresponding formation rates are combined in only one free parameter. Furthermore, the lower mass boundary for neutron star formation (here ) is of little importance: The decisive term for the enrichment of the ISM with r-process material in our model is the NSM rate. Since a decrease of the lower mass boundary results in an increase of the NSM rate, a simple adjustment of the parameter is sufficient to retrieve a NSM rate consistent with constraints on the galactic rate. In the model the ejected r-process matter is also mixed with of ISM and is assumed to be distributed in a spherical, chemically well mixed shell. This might not be true, however, since it is well conceivable that r-process matter is ejected only in the orbital plane of the merging neutron stars. In this case, the ejecta would be distributed over a smaller volume and would consequently mix with a smaller amount of ISM than the one assumed in our model. As will be seen below (Sect. 3.2), this would lead to even higher [r/Fe] ratios in the computed model stars. Thus, our assumptions are in favour of the NSM scenario and changing the mixing mechanism in our model would only aggravate the problems associated with the high r-process yields from NSM.
Coalescence timescales for neutron star mergers are typically estimated to be of the order Myr (e.g. Portegies Zwart & Yungel’son pr98 (1998); Fryer et al. fy99 (1999)). Recently, Belczynski et al. (bl02 (2002)) suggested a dominating population of short lived neutron star binaries with merger times less than 1 Myr. This population of neutron star mergers might be formed through channels involving mass-transfer episodes from helium stars, leading to tightly bound binary systems with very short orbit decay timescales. However, this result depends on the occurrence of a common envelope (CE) phase of the progenitor He stars, which was treated in a simplified manner by Belczynski et al. (bl02 (2002)). The authors caution that detailed hydrodynamical calculations of the CE phase still have to confirm these results. In view of these uncertainties, we adopt two different coalescence timescales , namely 1 and 100 Myr. In each case, it is assumed that all neutron star binaries merge within this time. Coalescence timescales of the order 1 Gyr have not been considered since they are not consistent with observations of neutron capture elements in ultra metal-poor stars (c.f. Sect 3.2).
| Reference | |
|---|---|
| Heuvel & Lorimer (vdH96 (1996)) | |
| Kalogera & Lorimer (ka00 (2000)) | |
| Belczynski et al. (bl02 (2002)) | |
| Reference | |
| Rosswog et al. (ro99 (1999)) | |
| Oechslin et al. (oe02 (2002)) |
Constraints on the Galactic NSM rate are also controversial. Van den Heuvel & Lorimer (vdH96 (1996)) estimate a rate of approximately , Kalogera & Lorimer (ka00 (2000)) give an upper limit of whereas Belczynski et al. (bl02 (2002)) get rates in the range . In Newtonian calculations, the amount of r-process matter ejected in a NSM event is of the order of a few times , depending on the initial configuration of the binary system (Rosswog et al. ro99 (1999)). Taking general relativistic effects into account, Oechslin et al. (oe02 (2002)) find as lower limit for . All constraints are again listed in Table 3.
| [Myr] | |||
|---|---|---|---|
| 1, 100 | |||
| 1, 100 | |||
| 1, 100 | |||
| 1, 100 |
Table 4 lists the parameter values adopted for the NSM probability , the resulting average NSM rate , the amount of r-process matter ejected in each event and coalescence timescales . After a value for has been chosen, the coalescence timescale is the only free parameter remaining in the model since the actual NSM rate is determined by the NSM probability and the SF rate (resulting from the parameter values given in Table 1). In addition, the NSM rate and the amount of ejected r-process matter are tightly correlated, since the total amount of r-process matter in the Galaxy (, Wallerstein et al. wl97 (1997)) has to be reproduced. Thus, higher NSM rates require that less r-process matter is ejected in each event, and vice versa.
Comparing the values in Table 4 with the constraints listed in Table 3 reveals that the NSM rate of the first row in Table 4 is too high by a factor of 10-100 and that the corresponding low value of of ejected r-process matter is close to the lower limit given by Oechslin et al. (oe02 (2002)). NSM rates listed in the three lower rows seem to be consistent with the galactic NSM rate. However, the ejected r-process matter in the last row is clearly beyond the upper limit of allowed values.
3 Enrichment of the ISM with r-process elements
3.1 SN II as dominating r-process sites
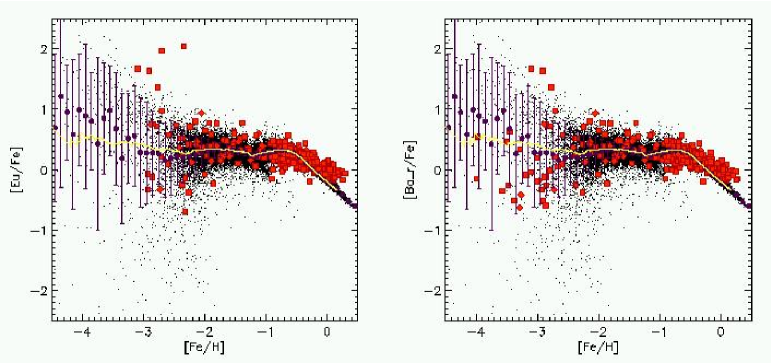
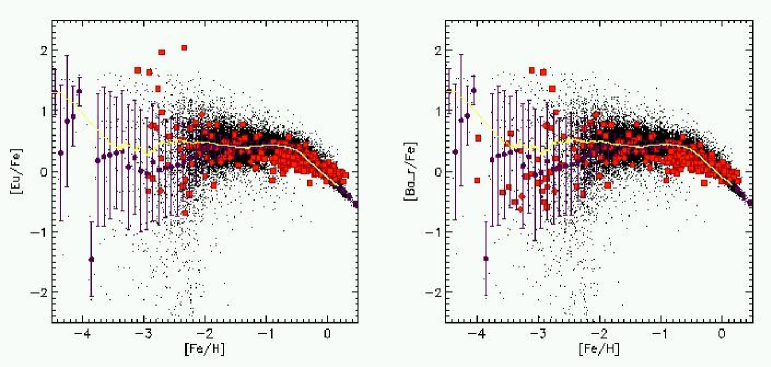
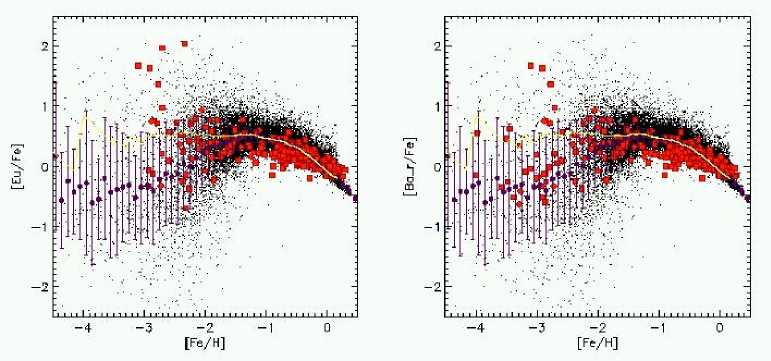
In this section, the enrichment of the ISM with neutron capture elements is discussed under the assumption, that the dominating r-process sources are either lower-mass SNe II () or higher-mass SNe II (). The results of models SN810, SN2025 and SN2050 are shown in Figs. 1 – 3, respectively. The figures show the evolution of [Eu/Fe] and [Bar/Fe] as function of metallicity [Fe/H]. Model stars are shown as black dots, whereas observations are indicated by filled red squares and diamonds. Observations are taken from Peterson et al. (pe90 (1990)), Gratton & Sneden (1991a , 1991b ), Ryan et al. (ry91 (1991)), Edvardsson et al. (ed93 (1993)), François et al. (fr93 (1993)), Beveridge & Sneden (be94 (1994)), McWilliam et al. (1995a ), Ryan et al. (ry96 (1996)), Jehin et al. (je99 (1999)), Aoki et al. (ao00 (2000)), Burris et al. (br00 (2000)), Mashonkina & Gehren (mg00 (2000)), Sneden et al. (2000a ), Mashonkina & Gehren (mg01 (2001)), Mishenina & Kovtyukh (mi01 (2001)), Koch & Edvardsson (ke02 (2002)) and Stephens & Boesgaard (st02 (2002)). Single observations of stars are marked by a square. In the case where multiple observations of a star are present, we plot the most recent one if all observations were published before the year 2000 (also marked by squares). If several more recent observations are available, the given element abundances are averaged (marked by diamonds). The yellow line shows the average element abundances in the model ISM and can directly be compared to classical chemical evolution models, which assume that the ISM is well mixed at all times. Purple filled circles with error bars denote the average [r/Fe] ratios of model stars and their standard deviation in [Fe/H] bins with binsize 0.1 dex. Note, that the [Bar/Fe] plots only show the r-process contribution to the total Ba abundances of halo stars. According to Burris et al. (br00 (2000)), r-process Ba abundances can be computed by removing the s-process contribution to Ba in stars with [Fe/H] , if Eu abundances have also been determined. For stars with metallicities [Fe/H] , it can be assumed that the whole Ba inventory is of pure r-process origin. Thus, published Ba abundances of such metal-poor halo stars simply have to be renormalized to the level of the solar r-process fraction (i.e. of the total solar Ba abundance). Care has been taken to remove known carbon stars from our sample. Such stars mostly show unusually large Ba abundances, which are thought to originate from mass transfer of s-process enriched matter in binary systems.
The evolution of r-process elements shown in Figs. 1 – 3 are qualitatively very similar. At very low metallicities ([Fe/H] ), a large scatter in abundances of model stars is visible. This scatter is due to chemical inhomogeneities in the early ISM (c.f. Paper I). The scatter decreases as the mixing of the ISM improves and finally reaches the IMF averaged mean. At this stage, the ISM can be considered well mixed and the further evolution is comparable to the one of classic chemical evolution models. In the following, we point out some important features of the ISM enrichment resulting from models SN810, SN2025 and SN2050:
-
1.
In all models, r-process elements appear very early in the enrichment of the ISM. Some model stars with r-process abundances exist even at metallicities [Fe/H] , which is in agreement with observed Ba abundances in ultra metal-poor stars. Neutron capture elements at such low metallicities are considered to be of pure r-process origin, since s-process enrichment is expected to occur at a later stage in the chemical evolution of the Galaxy (e.g. Travaglio et al. tr99 (1999)).
-
2.
For metallicities [Fe/H] , the scatter in [Eu/Fe] and [Bar/Fe] abundances of model stars is comparable to the one seen in observations. The main difference between the higher-mass (models SN2025 and SN2050, Fig. 2 and 3) and lower-mass (model SN810, Fig. 1) SNe II scenarios is the larger scatter in [r/Fe] at [Fe/H] and the slightly more pronounced scatter at higher metallicities of models SN2025 and SN2050. One might argue, that the model stars in Figs. 2 and 3 at [Fe/H] with high [r/Fe] abundances () should also be visible in the observational data. The bulk of model stars, however, has abundances [r/Fe] and it would thus be very unlikely to observe stars with high [r/Fe] ratios in this metallicity regime. The situation below [Fe/H] is different: Only few model stars are present in this metallicity range and their [r/Fe] abundances are evenly distributed and do not clump around the IMF averaged value.
-
3.
Models SN810 and SN2025 fail to reproduce the two metal-poor stars with the highest Eu abundances ([Eu/Fe] at [Fe/H] ). The existence of such ultra r-process enhanced stars might pose a serious problem for the SN scenario, since an unusual large amount of ejected r-process matter () is required to reproduce these observations in chemical evolution models (model SN2050, Fig. 3). In the neutrino driven wind model of Wanajo et al. (wn01 (2001)), massive proto-neutron stars with a high compaction ratio are required to achieve r-process yields of this order of magnitude. However, chemical evolution models constrain such large r-process yields to only a small progenitor mass range (see Table 2). Otherwise, the total r-process inventory of the Galaxy is exceeded.
On the other hand, Qian & Wasserburg (qiwa01 (2001), qiwa03 (2002)) argue that the highest Eu and Ba abundances in metal-poor halo stars may originate from the dumping of r-process enriched matter from a high-mass companion onto the surface of a low mass star. This explanation requires that during the SN II event of the high-mass companion, r-process elements but no iron-peak nuclei are produced. Possible candidates for this kind of SN II events are progenitors in the mass range ; see e.g. Qian & Wasserburg (qiwa03 (2002)) for a discussion of this mechanism. To date, our model is not able to handle the occurrence of surface contamination in binary systems, so that the results of model SN810 do not directly apply to this scenario. We speculate however, that if this mechanism would be at work during the evolution of the Galaxy, we might also expect stars with high [r/Fe] abundances at metallicities [Fe/H] . No such stars have been observed to date. Yet, since many abundance studies primarily target metal-poor stars, it is possible that r-process enriched, metal-rich stars simply have been missed. Note, that if iron is produced in the SN II event of the companion, the resulting surface abundance will be a mixture of the intrinsic r-process abundances and the yields of the SN II. In this case, large r-process yields are still required to enrich the companion to the high level seen in observations.
-
4.
The models also predicts some stars with very low [Eu/Fe] and [Bar/Fe] ratios at [Fe/H] , which are not observed to date. However, if stars with [r/Fe] exist in the galactic halo, their Eu and Ba lines may be too weak to be detectable (c.f. observational limits quoted in Travaglio et al. (tr01 (2001))). In the models, stars with very low [Eu/Fe] ratios are inevitably produced if only a limited mass-range of SNe II contributes to the r-process enrichment. In this case, pockets without or with only small amounts of r-process elements may form in the halo ISM if primarily SNe II without r-process yields contributed to the local enrichment.
-
5.
Model stars in Fig. 1 with high r-process abundances ([r/Fe] ) at metallicities below [Fe/H] owe their origin to the same phenomenon. Here, lower-mass SNe II are the primary source of r-process elements, without contributing much iron-peak nuclei to the enrichment of the ISM. Thus, pockets with large r-process abundances may form during the early enrichment of the ISM, similar to pockets with large Fe abundances. However, [r/Fe] ratios soon converge to the average [r/Fe] ratios of metal-poor halo stars and from then on give a good fit to observations. It is interesting to note, that this behaviour is typical for inhomogeneous chemical evolution models and is not present in classic chemical evolution models which assume that the ISM is well mixed at all times (e.g. Travaglio et al. tr99 (1999)). This simplifying assumption leads to a slow increase of the average ISM [r/Fe] abundances, since r-process yields from are instantaneously mixed with iron yields from .
We briefly note here, that the fit of model SN810 to observations of metal-poor halo stars can be improved, if infall of pre-enriched ISM with [Fe/H] is assumed (e.g. Qian & Wasserburg qiwa02 (2002)). In this case, model stars with high [r/Fe] abundances at [Fe/H] are shifted to [Fe/H] , where such r-process enriched stars are observed. This is the case only for model SN810. The fit to observations of models SN2025, SN2050 and the NSM models (see Sect. 3.2) are not changed significantly by the assumption of metal-rich infall.
-
6.
The evolution of average [r/Fe] abundances of model stars (purple circles) as function of metallicity is an important tool to compare model results with observations: Slopes in the distribution of model stars, which might be hidden in the full [r/Fe] plots, will show up in the distribution of these averaged abundances and may be compared to trends seen in observational data. Note, that the evolution of average ISM abundances (yellow line) is generally different from the evolution of average model star abundances. This is the case, since ISM abundances are averaged over all cells in our volume, which is equivalent to assuming a well mixed ISM at all times and thus may be compared to classic chemical evolution models. Average model star abundances, on the other hand, are still affected by chemical inhomogeneities, since they depend on the number of stars with a given [r/Fe] abundance.
This is demonstrated in Fig. 1 (model SN810). Although the calculated standard deviation of model stars is large (due to the low number of model stars with metallicities below [Fe/H] ), the average model star abundances rise with decreasing metallicity. Thus, model SN810 would predict a rising slope in [Bar/Fe], contrary to the one present in observations of metal-poor halo stars. In model SN2025, the average model abundances stay more or less constant, whereas in model SN2050, average abundances give a nice fit to the observational data. Note, that the empty bin at [Fe/H] in Fig. 2 only contains one model star.
In summary, core-collapse SNe seem to be a valid source of r-process elements from the point of view of chemical evolution, since the enrichment of the ISM in the cases discussed above is in qualitative, if not necessarily quantitative, agreement with observations. Based on the evolution of average model star abundances and the range of the scatter at [Fe/H] , model SN2050 gives the best fit to observations, whereas model SN810 gives the worst. Note however, that the initial scatter in [r/Fe] ratios strongly depends on the yields as function of progenitor mass. As was discussed in Argast et al. (ar02 (2002)), the progenitor mass dependence of stellar Fe yields are not known to date and the distribution of observed element abundances as function of metallicity can easily be reproduced by the appropriate choice of Fe yields. Additionally, r-process yields in this work are chosen completely ad hoc and yet lack any theoretical backup. In view of these uncertainties, we conclude in accordance with Ishimaru & Wanajo (is99 (1999)), that it is not possible to date to rule out either lower-mass or higher-mass SNe II within the framework of inhomogeneous chemical evolution.
3.2 NSM as dominating r-process sites
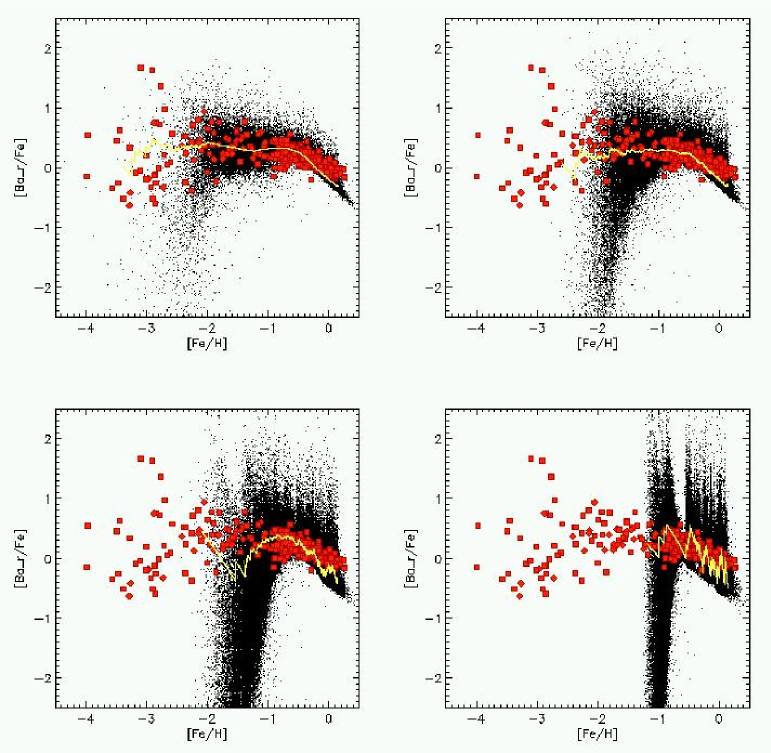
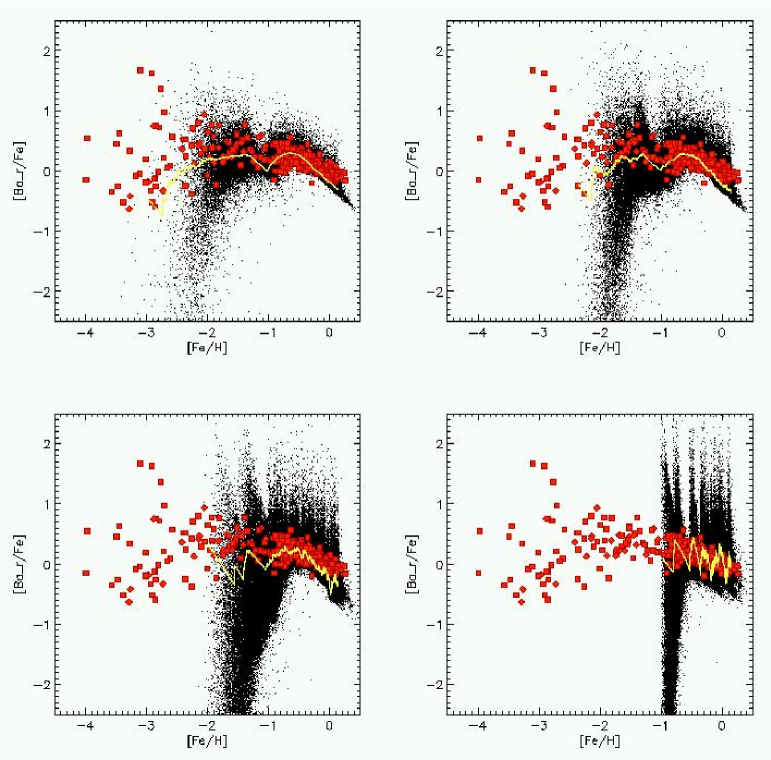
The enrichment of the ISM with r-process elements in the case of NSM acting as major r-process sources is discussed in the following. As already mentioned in Sect. 2.2.3, eight model-runs were carried out in total, assuming NSM rates ranging from to and coalescence time-scales of 1 and 100 Myr (see Table 4). A condensed overview of all models displaying the evolution of [Bar/Fe] is shown in Figs. 4 and 5. The evolution of r-process abundances is strikingly different from the case in which r-process nucleosynthesis occurs in SNe II (see Figs.1 – 3). All models with NSM as r-process sources fail to reproduce observations.
As a representative example, the model shown in the upper right panel of Fig. 4 is discussed in the following. It was calculated with a NSM rate of , a total of of ejected r-process matter and a coalescence time-scale of 1 Myr. Note, that the case discussed here assumes a NSM rate which is at the upper limit given by present estimates of the galactic NSM rate: Estimates range from (van den Heuvel & Lorimer vdH96 (1996)) to (Belczynski et al. bl02 (2002)) and Kalogera & Lorimer (ka00 (2000)) even give an upper limit of . Furthermore, the coalescence timescale adopted in this model is only 1 Myr, which is two to three orders of magnitude lower than the classical estimate of Myr (e.g. Portegies Zwart & Yungel’son pr98 (1998); Fryer et al. fy99 (1999)). However, Belczynski et al. (bl02 (2002)) suggest the existence of a dominating population of short lived neutron star binaries with merger times less than 1 Myr.
The following qualitative differences are immediately visible, if the upper right panel of Fig. 4 is compared to Figs. 1 – 3:
-
1.
r-process nuclei appear at the earliest around [Fe/H] , whereas r-process elements such as Eu are observed at [Fe/H] and probably even down to [Fe/H] in the case of Bar. The reason for this late injection of r-process matter in the model is the low NSM rate (compared to the SN II rate). The decisive parameter to obtain a given NSM rate in the model is the probability which, in this case, is set to (see Table 4). Thus, on average SNe II events occur before the first NSM event and r-process nuclei are injected into an ISM already pre-enriched by SNe II. The lower the NSM rate, i.e. the lower , the later (in time and metallicity) the occurrence of r-process elements. This late injection of r-process nuclei by NSM is the reason why we did not consider coalescence timescales of the order of 1 Gyr: In our model, 1 Gyr after the first SF event the metallicity of the ISM reached [Fe/H] . The first appearance of r-process nuclei at this metallicity is clearly not consistent with observations. Thus, the advantage that the NSM scenario can produce a large scatter in [r/Fe] close to 3 dex, as observed in ultra metal-poor stars, turns into a disadvantage because it appears at too high metallicities where observations do not show this effect anymore.
-
2.
There is a prominent tail of model stars with very low [r/Fe] ratios at [Fe/H] . Such model stars are also present in Figs. 1 – 3. In this case, however, a significant fraction of them shows this property. Furthermore, the tail develops not until [Fe/H] , whereas in the SN II case there are virtually no model stars with very low [r/Fe] ratios above this metallicity. Since the tail develops at higher metallicities, it can not be dismissed as unobservable. Even if r-process element abundances with [r/Fe] could not be detected, the upper part of the tail should be visible in the observational data.
-
3.
Even at late times in the enrichment of the ISM ([Fe/H] ), the scatter in possible [r/Fe] ratios is of the order dex, whereas observations of [Eu/Fe] and [Bar/Fe] abundances show a scatter of approximately dex. The large scatter at high [Fe/H] occurs only for NSM but not for SNe II. Since the total amount of r-process matter ejected in a single NSM event (here ) is very large (cf. to for SNe II) and the frequency of NSM is very low ( times lower than that of SNe II), NSM events may still cause significant local chemical inhomogeneities, in spite of the advanced enrichment of the ISM by many SNe II.
These aspects strongly argue against NSM as the dominating r-process source, especially since the parameters used for the model in discussion are at the upper limit set by theoretical and observational constraints. Lower NSM rates and, consequently, larger ejecta masses, only aggravate the problems mentioned above. The dramatic changes in the distribution of r-process abundances occurring with decreasing NSM rate are clearly visible in the sequence of plots in Figs. 4 and 5. The NSM rates adopted in the models decrease from left to right and top to bottom by one order of magnitude for each panel, i.e. from for the upper left panel down to for the lower right panel. Figs. 4 and 5 assume coalescence timescales of 1 and 100 Myr, respectively.
In the upper left panels of both figures (NSM rate ), a few model stars with r-process abundances first appear around [Fe/H] , in contrast to [Fe/H] in the panels at the lower right (NSM rate ). Simultaneously, the scatter in [Bar/Fe] and [Eu/Fe] at solar metallicity, which is of the same order as the one observed in the upper left panels, increases to almost 3 dex in the lower right panels, clearly not consistent with observations. Furthermore, the tail of model stars with low [r/Fe] abundances gets more pronounced and concentrated and is shifted to higher metallicities.
Contrary to expectations, the impact of the coalescence timescale on the distribution of r-process nuclei is rather small. This is surprising, since a large value of results in a delayed injection of r-process matter into the ISM. However, this can be understood by noting that in the NSM models, the enrichment of the ISM was adjusted to proceed very slowly at the beginning of Galaxy formation: It takes Myr to enrich the ISM from [Fe/H] to [Fe/H] . Thus, a coalescence timescale of 100 Myr is of the same order as the halo enrichment timescale, resulting in only a slight shift of the first r-process matter injection to higher metallicities. The slow enrichment was assumed in order to enable r-process nuclei injection from NSM even at low metallicities. However, as Figs. 4 and 5 show, this is not the case even with the help of a slow enrichment history. Thus, a fast halo enrichment would shift the moment of first r-process matter injection to even higher metallicities. Note that, on the basis of these considerations, coalescence timescales of the order 1 Gyr clearly are not consistent with the occurrence of r-process nuclei early on during Galaxy formation.
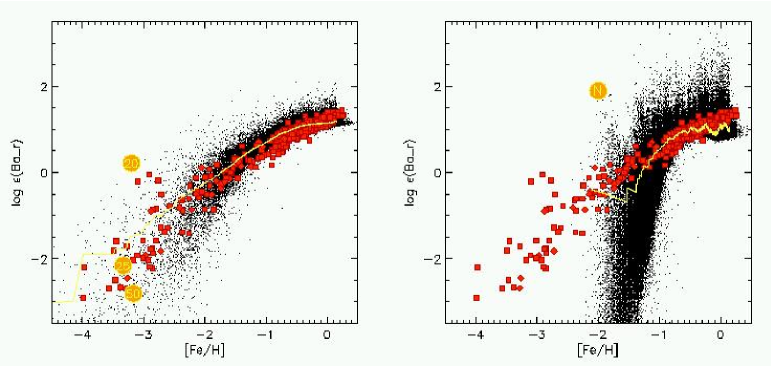
Fig. 6 demonstrates another qualitative difference between the SN II and NSM scenarios. In this figure, 111 vs. [Fe/H] of model SN2050 (left panel) and NSM occurring at a rate of yr-1 (right panel) are shown. In the SN II scenario, the scatter in at low metallicities ([Fe/H] ) is primarily determined by the progenitor mass dependent r-process yields of SNe II (indicated by numbered circles). Model stars at [Fe/H] with Bar abundances above are formed out of material enriched by a single SN II whereas some model stars with are formed out of material which underwent subsequent mixing with primordial ISM. Stars with such low r-process abundances disappear at [Fe/H] due to the increased enrichment of the ISM with r-process material.
In the NSM case, the scatter in is solely determined by subsequent mixing of r-process enriched material with r-process poor ISM. Under the assumption that a NSM event is able to enrich of ISM with of r-process matter, model stars with typically or more can be formed (indicated by the labelled circle in the right-hand panel of Fig. 6). Thus, the distinct peaks in the distribution of Bar abundances of model stars are telltale signs of recent NSM events. However, since NSM events are rare, there is time enough to thoroughly mix the r-process enriched material in the vicinity of a recent NSM with r-process poor ISM. In consequence of this mixing and the low NSM rate, the bulk of model stars with are formed.
We conclude that NSM have to respect stringent requirements if they are to operate as dominating r-process contributors, which most likely are not fulfilled in reality: High NSM rates of the order are required to account for the early appearance of r-process nuclei in the ISM. Consequently, the amount of r-process matter ejected in a NSM event has to be of the order , lest the total inventory of r-process nuclei in the Galaxy is exceeded. In addition, the coalescence timescale of a large fraction of neutron star binaries has to be of the order 1-10 Myr or at the most 100 Myr. If these constraints are indeed fulfilled in reality, then the properties of NSM (i.e. rates and ejected r-process matter) are comparable to the ones of SNe II that (may) give rise to r-process nucleosynthesis from the point of view of chemical evolution. Consequently, the enrichment of the ISM with r-process matter from NSM would be similar to the one where core-collapse SNe are the source of r-process elements (compare Figs. 1 – 2 with the upper left panels of Figs. 4 and 5).
However, it seems unlikely that NSM fulfil these conditions, which suggests that NSM are ruled out as the major r-process source. On the other hand, NSM occurring at low rates and with low ejecta masses of the order may still contribute to the enrichment of the ISM with r-process nuclei if their r-process signature is similar to the one generated by SNe II. In this case, the impact of NSM on r-process nuclei enrichment would be negligible compared to the fast injection of r-process matter by SNe II.
4 Conclusions
In this work, we study the enrichment of the interstellar medium with r-process elements in the framework of inhomogeneous chemical evolution. We present a detailed comparison of the impact of lower-mass SNe II (, model SN810), higher-mass SNe II (, models SN2025 and SN2050) and NSM as major r-process sites on the enrichment history of the early Galaxy.
Among the SNe II scenarios, model SN2050 gives the best fit to observations, since it reproduces the trend of r-process abundances at ultra low metallicities and at the same time fits observations with the highest [r/Fe] abundance ratios at [Fe/H] . Neither model SN2025 nor SN810 are able to reproduce observations of the most r-process enriched stars. In addition, model SN810 gives the worst fit to the trend of r-process abundances at ultra low metallicities. However, we conclude that, due to the large uncertainties inherent in the progenitor mass dependence of iron yields of SNe II, it is not possible to clearly rule out either lower-mass SNe II or higher-mass SNe II as dominant r-process sites from the point of view of inhomogeneous chemical evolution. Additional uncertainties are introduced by the fact that reliable r-process yields from SNe II are unavailable as yet. Here, they were deduced in such a way that the average [r/Fe] abundances in metal-poor halo stars are reproduced. Clearly, iron and r-process yields and their dependence on progenitor mass from self-consistent core-collapse SN calculations are required before any decisive conclusion can be reached.
On the other hand, NSM seem to be ruled out as major r-process sources for the following reasons:
-
1.
Estimates of the galactic NSM rate are two to three orders of magnitude lower than estimates of galactic SNe II rate. Thus, the injection of r-process nuclei into the interstellar medium by NSM would occur very late during Galaxy formation ([Fe/H] ), whereas r-process elements are already observed at [Fe/H] and probably even at [Fe/H] .
-
2.
The late injection of r-process elements furthermore leads to prominent tails in the distribution of r-process abundances down to very low [r/Fe] ratios at [Fe/H] , which are seemingly not consistent with observations. It is possible that r-process abundances [r/Fe] are not detectable to date in metal-poor halo stars. However, the large fraction of stars predicted by our model with [r/Fe] at [Fe/H] should be present in the observational data.
-
3.
Since NSM occur at a lower rate than SNe II, their r-process yield has to be about two orders of magnitudes higher than the r-process yield of typical SNe II. Due to this large r-process yield, considerable chemical inhomogeneities in the ISM are expected to be present even at solar metallicity. The scatter in [r/Fe] is predicted to be of the order dex, whereas a scatter of only dex is observed.
NSM as major r-process sources are only consistent with observations under the following conditions: First, they occur at rates about one to two orders of magnitude higher than given by present estimates. Second, a dominant part of the NSM population has coalescence timescales shorter than approximately 10 Myr. Third, the total amount of ejected r-process matter is of the same order as the present theoretical estimate from relativistic merger calculations. Under these conditions, the enrichment of the ISM with r-process elements from NSM is qualitatively very similar to the enrichment of r-process elements dominated by SNe II. However, it seems highly unlikely that NSM fulfil these conditions, which suggests that NSM are ruled out as the major r-process source. Nevertheless, it is still feasible from the point of view of chemical evolution that NSM contribute a minor fraction of r-process elements to the enrichment of the ISM. In this case they have to occur at a low rate and the ejected r-process matter must not exceed the lower limit indicated by recent relativistic merger calculations.
Thus, we conclude, that the exact astrophysical nature of r-process sites still remains a mystery, since it is not possible to clearly distinguish between neutron capture element abundance patterns resulting from lower-mass SNe II () and the ones from higher-mass SNe II () in the framework of inhomogeneous chemical evolution. However, the present investigation suggests that core-collapse SNe are much more likely to be the dominant r-process sites than coalescing neutron star binaries, which at least reduces the list of possible major contributors of r-process nuclei to the enrichment of the interstellar medium. Yet, it remains to be seen how SNe II can actually produce the required r-process yields.
Acknowledgements.
This work was supported in part by the Swiss National Science Foundation and by US DOE grants DE-FG02-87ER40328 and DE-FG02-00ER41149 at Minnesota.References
- (1) Anders, E., & Grevesse, N. 1989, Geochimica et Cosmochimica Acta, 53, 197
- (2) Aoki, W., Norris, J. E., Ryan, S. G., et al. 2000, ApJ, 536, L97
- (3) Argast, D., Samland, M., Gerhard, O. E., & Thielemann, F.-K. 2000, A&A, 356, 873 (Paper I)
- (4) Argast, D., Samland, M., Thielemann, F.-K., & Gerhard, O. E. 2002, A&A, 388, 842
- (5) Belczynski, K., Kalogera, V., & Bulik, T. 2002, ApJ, 572, 407
- (6) Beveridge, R. C., & Sneden, C. 1994, AJ, 108, 285
- (7) Brachwitz, F., Dean, D. J., Hix, W. R., et al. 2000, ApJ, 536, 934
- (8) Bruenn, S. W. 1989a, ApJ, 340, 955
- (9) Bruenn, S. W. 1989b, ApJ, 341, 385
- (10) Burbidge, G. R., Burbidge, W. A., Fowler, W. A., & Hoyle, F. 1957, Rev. Mod. Phys., 29, 547 (B2FH)
- (11) Burris, D. L., Pilachowski, C. A., Armandroff, T. E., et al. 2000, ApJ 544, 302
- (12) Cameron, A. G. W. ApJ, 2001, 562, 456
- (13) Charbonnel, C., Meynet, G., Maeder, A., et al. 1993, A&AS, 101, 415
- (14) Cowan, J. J., Thielemann, F.-K., & Truran, J. W. 1991, Phys. Rep., 208, 267
- (15) Cowan, J. J., Sneden, C., Burles, S., et al. 2002, ApJ, 572, 861
- (16) Edvardsson, B., Andersen, J., Gustafsson, B., et al. 1993, A&A, 275, 101
- (17) Fields, B. D., Truran, J. W., & Cowan, J. J. 2002, ApJ, 575, 845
- (18) François, P., Spite, M., & Spite F. 1993, A&A, 274, 821
- (19) Freiburghaus, C., Rembges, F., Rauscher, T., et al. 1999a, ApJ, 516, 381
- (20) Freiburghaus, C., Rosswog, S., & Thielemann, F.-K. 1999b, ApJ 525, L121
- (21) Fryer, C. L., Woosley, S. E., & Hartmann, D. H. 1999, ApJ, 526, 152
- (22) Gratton, R. G., & Sneden C. 1991a, A&A, 241, 501
- (23) Gratton, R. G., & Sneden C. 1991b, A&A, 287, 927
- (24) Hill, V., Plez, B., Cayrel, R., et al. 2002, A&A, 387, 560
- (25) Hillebrandt, W., Nomoto, K., & Wolff, R. G. 1984, A&A, 133, 175
- (26) Ishimaru, Y., & Wanajo, S. 1999, ApJ, 511, L33
- (27) Iwamoto, K., Brachwitz, F., Nomoto, K., et al. 1999, ApJS, 125, 439
- (28) Jehin, E., Magain, P., Neuforge, C., et al. 1999, A&A, 341, 241
- (29) Kalogera, V., & Lorimer, D. R. 2000, ApJ, 530, 890
- (30) Koch, A. & Edvardsson, B. 2002, A&A, 381, 500
- (31) Larson, R. B., 1991. In: Lambert, D. A. (ed.) Frontiers of stellar evolution. ASP Conf. Ser. 20, 539.
- (32) Liebendörfer, M., Mezzacappa, A., Thielemann, F.-K., et al. 2001, Phys. Rev. D, 6310, 3004
- (33) Mashonkina, L. & Gehren, T. 2000, A&A, 364, 249
- (34) Mashonkina, L. & Gehren, T. 2001, A&A, 376, 232
- (35) Mazzali, P. A., Lucy, L. B. & Buttler, K. 1992, A&A, 258, 399
- (36) McWilliam, A., Preston, G. W., Sneden, C., & Searle, L. 1995a, AJ, 109, 2757
- (37) McWilliam, A., Preston, G. W., Sneden, C., & Shectman, S. 1995b, AJ, 109, 2736
- (38) McWilliam, A. 1998, AJ, 115, 1640
- (39) Meyer, B. S., & Brown, J. S. 1997, ApJS, 112, 199
- (40) Mishenina, T. V. & Kovtyukh, V. V. 2001, A&A, 370, 951
- (41) Nagataki, S. 2001, ApJ, 551, 429
- (42) Nomoto, K., Hashimoto, M., Tsujimoto, T., et al. 1997, Nucl. Phys., A616, 79c13
- (43) Oechslin, R., Rosswog, S., & Thielemann, F. K. 2002, Phys. Rev., D65, 103005
- (44) Peterson, R. C., Kurucz, R. L., & Carney, B. W. 1990, ApJ, 350, 173
- (45) Pfeiffer, B., Kratz, K.-L., Thielemann, F.-K., & Walters, W. B. 2001, Nucl. Phys., A693, 282
- (46) Portegies Zwart, S. F., & Yungel’son, L. R. 1998, A&A, 332, 173
- (47) Qian, Y.-Z. 2000, ApJ, 534, L67
- (48) Qian, Y.-Z. 2001, ApJ, 552, L117
- (49) Qian, Y.-Z. & Wasserburg, G. J. 2001, ApJ, 552, L55
- (50) Qian, Y.-Z. & Wasserburg, G. J. 2002, ApJ, 567, 515
- (51) Qian, Y.-Z. & Wasserburg, G. J. 2003, ApJ, 588, 1099
- (52) Qian, Y.-Z., & Woosley, S. E. 1996, ApJ, 471, 331
- (53) Raiteri, C. M., Villata, M., Gallino, R., et al. 1999, ApJ, 518, L91
- (54) Rampp, M., & Janka, H.-T. 2000, ApJ, 539, L33
- (55) Rosswog, S., Liebendörfer, M., Thielemann, F.-K., et al. 1999, A&A, 341, 499
- (56) Rosswog, S., Davies, M. B., Thielemann, F.-K., & Piran, T. 2000, A&A, 360, 171
- (57) Rosswog, S., & Davies, M. B. 2002, MNRAS, 334, 481
- (58) Ryan, S. G., Norris, J. E., & Bessell, M. S. 1991, AJ, 102, 303
- (59) Ryan, S. G., Norris, J. E., & Beers, T. C. 1996, ApJ, 471, 254
- (60) Samland, M. 1998, ApJ, 496, 155
- (61) Schaerer, D., Meynet, G., Maeder, A., & Schaller, G., 1993a, A&AS, 98, 523
- (62) Schaerer, D., Charbonnel, C., Meynet, G., et al. 1993b, A&AS, 102, 339
- (63) Schaller, G., Schaerer, D., Meynet, G., & Maeder, A., 1992 A&AS, 96, 269
- (64) Schmidt, M. 1959, ApJ, 121, 161
- (65) Shigeyama, T., & Tsujimoto, T. 1998, ApJ, 507, L135
- (66) Sneden, C., Cowan, J. J., Ivans, I. I., et al. 2000, ApJ, 533, L139
- (67) Stephens, A., & Boesgaard, A. M. 2002, AJ, 123, 1647
- (68) Sumiyoshi, K., Terasawa, M., Mathews, G. J., et al. 2001, ApJ, 562, 880
- (69) Takahashi, K., Witti, J., & Janka, H.-T. 1994, A&A, 286, 857
- (70) Tammann, G. A., Löffler, W., & Schröder, A. 1994, ApJS, 92, 487
- (71) Terasawa, M., Sumiyoshi, K., Yamada, S., et al. 2002, ApJ, 578, L137
- (72) Thielemann, F.-K., Nomoto, K., & Hashimoto, M. 1996, ApJ, 460, 408
- (73) Thielemann, F.-K., Hauser, P., Kolbe, E., et al. 2002, SSRv, 100, 277
- (74) Thompson, T. A., Burrows, A., & Bradley, S. M. 2001, ApJ, 562, 887
- (75) Thompson, T. A. 2003, ApJ, 585, L33
- (76) Travaglio, C., Galli, D., Gallino, R., et al. 1999, ApJ, 521, 691
- (77) Travaglio, C., Galli, D. & Burkert, A. 2001, ApJ, 547, 217
- (78) Tsujimoto, T., Shigeyama, T., & Yoshii, Y. 1999, ApJ, 519, L63
- (79) Tsujimoto, T., Shigeyama, T., & Yoshii, Y. 2000, ApJ, 531, L33
- (80) Tsujimoto, T., & Shigeyama, T. 2001, ApJ, 561, L97
- (81) Utrobin, V. P., & Chugai, N. N. 2002, In: Hillebrandt, W., Müller, E. (Eds.) Proceedings of the 11th Workshop on “Nuclear Astrophysics”. Max-Planck-Institut für Astrophysik, Garching, p. 136
- (82) van den Heuvel, E., & Lorimer, D. 1996, MNRAS, 283, L37
- (83) Wallerstein, G., Iben, I., Jr., Parker, P., et al. 1997, Rev. Mod. Phys., 69, 995
- (84) Wanajo, S., Toshitaka, K., Mathews, G. J., & Otsuki, K. 2001, ApJ 554, 578
- (85) Wanajo, S., Naoki, I., Ishimaru, Y. et al. 2002, ApJ 577, 853
- (86) Wasserburg, G. J., Busso, M., & Gallino, R. 1996, ApJ, 466, L109
- (87) Wasserburg, G. J., & Qian, Y.-Z. 2000, ApJ, 529, L21
- (88) Westin, J., Sneden, C., Gustafsson, B., & Cowan, J. J. 2000, ApJ, 530, 783
- (89) Witti, J., Janka, H.-T., & Takahashi, K. 1994, A&A, 286, 841
- (90) Wheeler, J. C., Cowan, J. J., & Hillebrandt, W. 1998, ApJ, 493, L101
- (91) Williams, R. E. 1987, ApJ, 320, L117
- (92) Woosley, S. E., & Hoffman, R. D. 1992, ApJ, 395, 202
- (93) Woosley, S. E., Wilson, J. R., Mathews, G. J., et al. 1994, ApJ, 433, 229