Kinetic SZ effect and CMB polarization from subsonic bulk motions of dense gas clouds in galaxy cluster cores
Abstract
Recent Chandra observations have revealed the presence of cold fronts in many clusters of galaxies. The cold fronts are believed to be produced by the bulk motions of massive, dense, cold gas clouds with respect to the hotter, more rarefied ambient gas at velocities that can be as high as the speed of sound. This phenomenon may produce a significant contamination of both the kinetic SZ effect and the CMB polarization pattern observed in the direction of a cluster. We estimate the contributions to the kinetic Sunyaev-Zel’dovich (SZ) effect and to the CMB polarization toward galaxy clusters produced by the bulk motions of the gas in the inner parts of galaxy clusters. The observed cold fronts probe the absolute velocities of the gas motion while the induced polarization and the kinetic SZ effect probe the transverse and the radial components, respectively. We show that these signals may be easily detected with sensitive future experiments, opening an exciting new window for studies of galaxy cluster internal dynamics, and eventually facilitating reconstruction of the intrinsic cluster polarization of the CMB and the associated measure of the local CMB quadrupole.
1 Introduction
Recent observations with Chandra have unveiled the presence of cold fronts in many galaxy clusters (Markevitch et. al. 2000; Vikhlinin, Markevitch, and Murray 2001, Mazzotta et. al 2001; Markevitch et al. 2002). The cold front is a discontinuity in the gas density and temperature characterized by the fact that the denser region is significantly colder than the rarefied component (thereby producing a pressure jump which is smaller than either the density or the temperature jump). Although the first cold fronts were discovered in merging clusters, Chandra later revealed the presence of cold fronts in many apparently relaxed clusters (e.g. Mazzotta et al. 2001; Markevitch et al. 2001; Mazzotta, Edge, and Markevitch 2003). Furthermore, a preliminary analysis shows that 2/3 of a X-ray flux limited sample of clusters of galaxies host cold fronts (Markevitch, Vikhlinin, Forman 2002). Since due to projection effects, only of all cold fronts can be observed in X-rays (Mazzotta et al. 2001), this strongly indicates that essentially all clusters of galaxies (including the most relaxed ones) host at least one cold front.
The most likely explanation for the presence of a cold front is that the cluster hosts a dense cold gas cloud which is moving with respect to the hotter and more rarefied ambient gas (Vikhlinin, et al. 2001). So far it is not completely clear why so many clusters (especially rounder, relaxed clusters) host moving gas clouds. One possibility is that the gas cloud in the central region is oscillating (sloshing) around the minimum of the cluster potential well (see. e.g. Markevitch et al. 2001; Markevitch et al. 2002; Mazzotta et al. 2003). This bulk gas motion may either be the result of a recent merger or due to dynamic feedback from the central (not necessarily currently active) AGN.
An important outcome of the study of cold fronts is that the gas thermal pressure at the front can be used to estimate the speed of the moving gas cloud (Vikhlinin et al. 2001). Preliminary studies have already revealed that these moving gas clouds have a wide range of sizes and velocities. More specifically: i) the size of the moving gas cloud can be as large as twice the cluster core radius; ii) the velocity is generally subsonic or at most transonic in rounder systems (e.g A1795, Markevitch et al. 2001; RXJ 1720+26, Mazzotta et al. 2001; 2A 0335+096, Mazzotta et al. 2003) and can be even supersonic in merger systems (e.g. A3667 Vikhlinin, et al. 2001; 1E 0657-56, Markevitch et al. 2002). It is interesting that the bulk motions, combined with the higher densities, of these gas clouds may induce a kinetic SZ effect as well as the polarization of the CMB. In this Letter, we study the contributions to the kinetic Sunyaev-Zel’dovich (SZ) effect and to the CMB polarization toward galaxy clusters produced by the bulk motions of these moving gas clouds in the inner parts of galaxy clusters.
2 Kinetic SZ effect and polarization signals
The kinetic SZ effect is a distortion of the CMB spectrum due to the peculiar motion of the cluster with respect to the Hubble flow. This distortion is given by the expression,
| (1) |
where is the radial component of the velocity of the cluster, the optical depth of the cluster, the Thomson cross-section, and the cluster gas density. This distortion is the same at all frequencies. The same CMB photons which undergo Compton scattering will be polarized after the scattering. The net polarized signal is proportional to the quadrupole of the incoming radiation (Rees 1968, Polnarev 1985). If the cluster is moving with a given velocity with respect to the Hubble flow, there will be an induced quadrupolar signal (Zel’dovich & Sunyaev 1980).
| (2) |
where is the total intensity of the radiation, are the other Stokes parameters ( for Thomson scattering), is the tangential component of the peculiar velocity of the cluster (cluster velocity projected on the sky plane) and is the frequency dependence of the polarized signal (Sazanov & Sunyaev 1999),
| (3) |
with . The resulting polarization plane is perpendicular to the velocity vector. As noted in Sazanov & Sunyaev (1999), there are other sources of CMB polarization in galaxy clusters. One of the most important is due to the intrinsic quadrupole of the CMB. For the COBE quadrupole, they estimated that the maximum signal should be (Rayleigh-Jeans) which for typical cluster optical depths gives . As we will see later, this value is comparable to the contribution of the cluster peculiar velocity plus the bulk motion of the central region. There are other mechanisms producing polarisation in the cluster but they have been discussed elsewhere (finite optical depth: Sazanov & Sunyaev 1999; cluster rotation: Chluba & Mannheim 2002).
3 Cold fronts: A toy model
Studies of cold fronts in clusters of galaxies have shown that many (if not all) clusters of galaxies host dense, cold gas clouds that move with respect to the cluster itself. These gas bulk motions may affect both the intrinsic kinetic SZ and the CMB polarization signal induced by the cluster. To predict the strength of the signal we make very simple assumptions using a toy model to describe the dynamics of the cold fronts observed in the X-rays. The basic elements of our toy model are the cluster within which is embedded a dense gas cloud. To fully define the model, we only need to establish the geometry and its dynamics.
We define the geometry by assuming that both the cluster and the moving gas cloud have spherical symmetry. To maintain the spherical symmetry of the problem, we also assume that at the time of observation, the center of the moving gas cloud and the cluster center coincide. The displacement of the moving cloud with respect to the cluster center is discussed later. In accordance with observations, we assume that the cluster gas density profile is described by a -model with (Jones & Forman, 1999) that we truncate at the virial radius : . In the previous equation, is the cluster core radius and is the central gas density that we obtain after fixing the total mass (and baryon fraction) of the cluster. For convenience, we assume that the virial radius and the core radius of the cluster are related by , with . In the same way we parameterize the real size of the moving gas cloud as and we take the same central density (although other values could be considered).
The dynamics of the model are defined by assessing the velocity of the gas at each point of the plasma. In our toy model, we simply assume that the cluster is moving with its own peculiar velocity while the central gas cloud has a bulk motion with respect to the cluster itself. It is convenient to parametrize the gas cloud velocity as , where is the Mach number, is the cluster speed of sound, and the gas cloud direction of motion. It is important to note that while is directly referred to the Hubble flow, is given in the framework in which the cluster is at rest. Therefore, to obtain the final velocity of the moving gas cloud with respect to the Hubble flow, we need to add to .
With this simplistic description it is easy to reduce the problem to a two-phase plasma with a discontinuity in the velocity. From Eqs. 1 and 2, we see that the signal (kinetic SZ and/or polarization) at any point of the cluster can easily be computed as: where and are the optical depths of the entire cluster and the moving gas cloud respectively and we introduce the new function which is and for the kinetic SZ effect and CMB polarization, respectively. We can also define the percentile variation
| (4) |
where . Using our toy model we can calculate and as a function of the angular distance from the cluster center. The gas cloud optical depth is given by:
| (5) |
where is the Thomson cross-section and is the
angular dimension of the core radius.
In the same way, can be obtained from the previous expression
by substituting .
We can illustrate the relative importance of the gas cloud in the center
of the cluster by calculating the ratio:
This is particularly important as it tells us that,
despite the small size of the cloud ( of the total mass),
the optical depth of the central moving gas cloud in the cluster center
is comparable to that of the remaining part of
the cluster ().
The above ratio can change for different models but for
reasonable models it is close to 2.
We can see that, in this case, the percentile variation of the signal
in the innermost cluster region is approximately
half of the percentile variation of the function .
As an example, let us consider .
Typical velocity values for such a cluster are
and
.
For convenience, we assume that i)
the gas cloud moves at the sound speed ();
ii) the direction of motion of the cluster and the central cloud form
angles of 45o with respect to the line of sight
(in such a way = and both the cluster and the moving cloud
contribute to the kinetic SZ effect and the CMB polarization);
iii) the direction of motion of the cluster is in the y-z plane
while the direction of motion of the the central cloud is in the
x-z plane (the z-axis is aligned with the line of sight).
In this simple situation for the kinetic SZ effect, we find that
.
This means that because of the moving dense gas cloud,
in the innermost cluster region,
the SZ effect induced by this cluster is higher
than in the “classical” case in which such a motion is not taken
into account. If we calculate the polarization, the effect is even
more dramatic since the signal is proportional to the
square of the velocity. In particular
, which means that the
polarization effect is higher!
Interestingly, due to the dependence on the square of the velocity,
the polarization signal is
insensitive to the sign of the velocity.
Two regions having velocities with opposite sign
(but the same magnitude)
will contribute similarly to the polarization.
Therefore, a cancellation of the polarization signal through
averaging the signal over the cluster is less likely than in the case of
the kinetic SZ effect (unless the velocities are orthogonal, in which case
they produce a cancellation in the polarization).
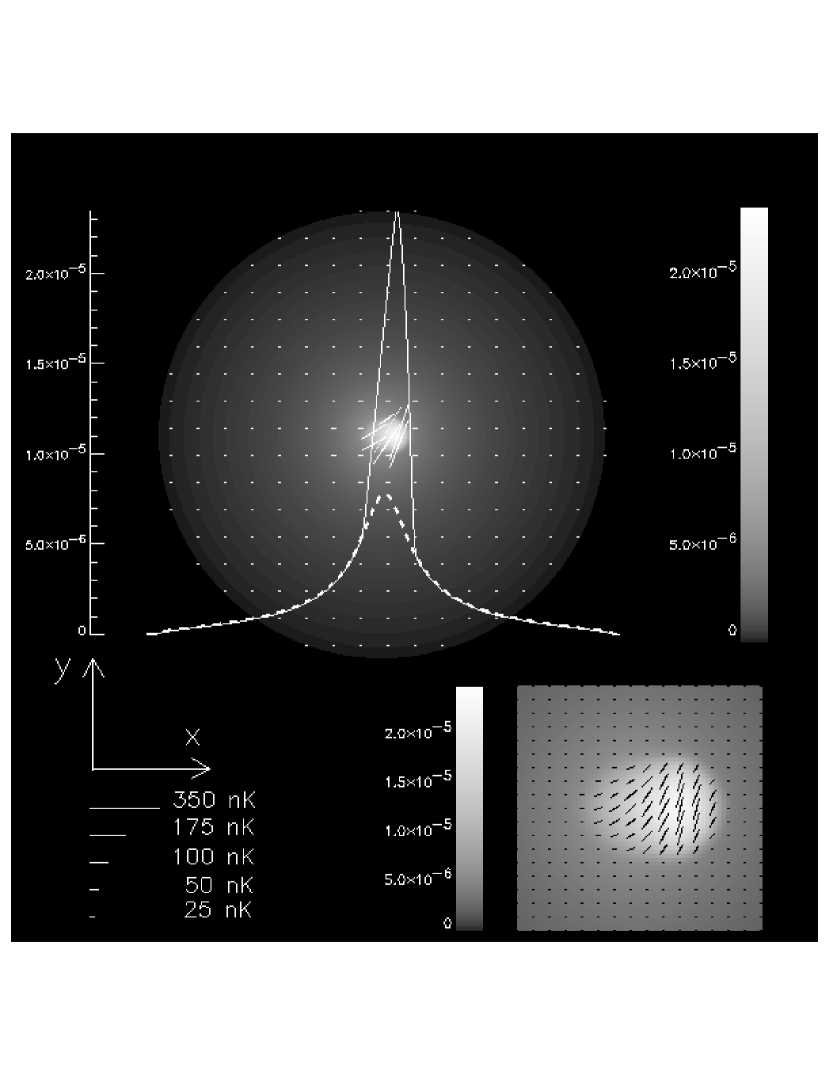
To better illustrate the contribution of the gas cloud to the SZ effect
and CMB polarization, we show in Fig. 1
the maps of these signals induced by the toy model described above.
In these maps, the gas cloud is displaced from the cluster center
by 60 kpc in both x and z directions.
Such a displacement is seen in many round clusters with cold fronts
(e.g. A1795, 2A 0335+096, RXJ1720+26) consistently with the fact that
the central cluster region is moving with respect to the cluster.
Clearly, the displacement of the moving region introduces an
asymmetry into the previous problem making it rather more complicated
to interpret.
The figure shows an evident enhancement of both the kinetic SZ effect
and CMB polarization over the entire region corresponding to the
size of the moving cloud.
For clarity in the figure, we also show the kinetic SZ effect along
a linear scan crossing the center of the cluster of the toy model
(continuous line) and the same signal corresponding to a model
with no moving gas cloud (dashed line).
We notice that i) the peak of the signals are shifted which is a simple
consequence of the dispacement of the moving gas cloud; ii)
the SZ signal of our toy model
is times higher than the “classical” signal
for most of the cluster region corresponding to the
size of the moving cloud.
For the CMB polarization we find that the maximum amplitude
signal for the toy model is 340 nK
(at 300 GHz).
In the Rayleigh-Jeans regime, this amplitude drops to 23 nK.
This number is comparable to (or even higher than) the estimated
amplitude of the polarization from the local CMB quadrupole
(Sazanov & Sunyaev 1999).
The maximum polarization signal can be compared with the expected maximum
signal in the classical case (no moving cloud), 25 nK (300 GHz).
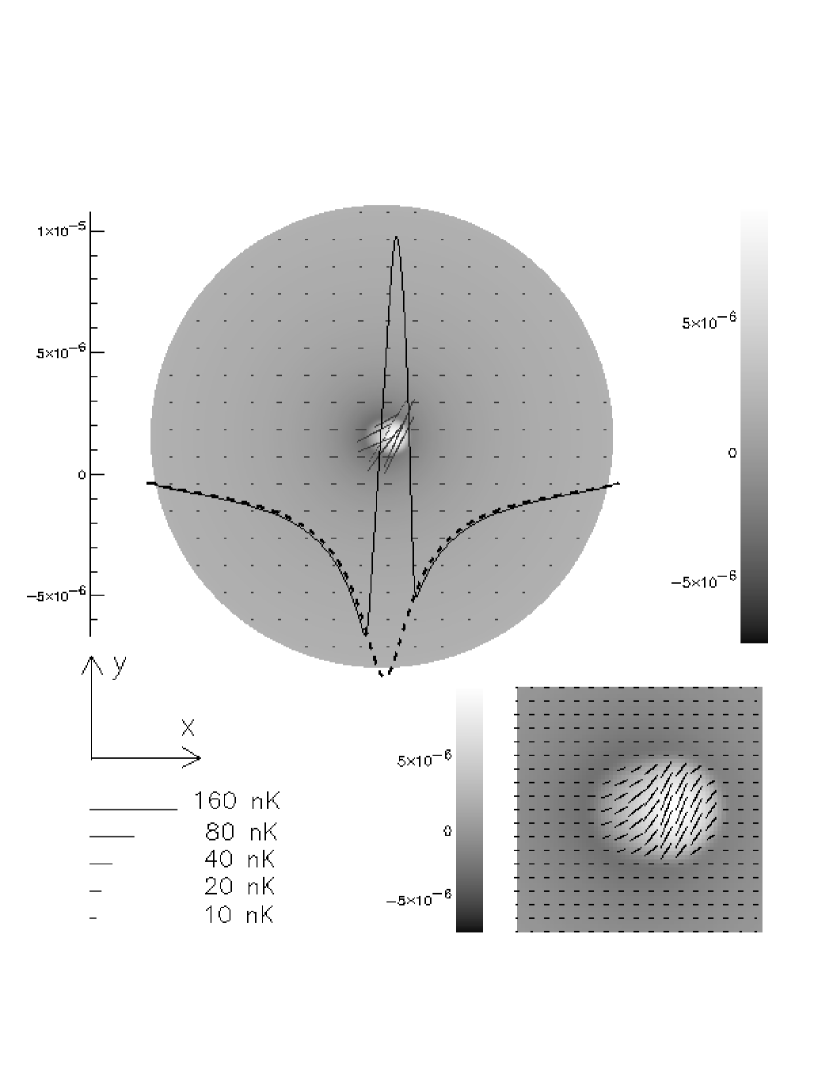
To conclude the description of our toy model,
in Fig. 2 we show the SZ effect and CMB
polarization maps in
the case in which the direction of motion
of the cluster is opposite to that of the gas cloud.
We notice that with respect to the other case considered,
the amplitude of the polarization is smaller.
This is simply due to the fact that the velocity of the cluster
partially compensates the velocity of the moving clouds.
Much more interesting, however, is the signature of the kinetic SZ effect.
It shows a unique feature: a positive peak in the middle
of the negative well.
This feature can be used in high resolution, high
sensitivity experiments to unequivocally identify bulk gas motions
inside clusters of galaxies.
4 Discussion and Conclusions
In the previous section, we showed that the bulk motion of a dense gas cloud in the cluster center may significantly affect both the kinematic SZ effect and the CMB polarization signal induced by clusters of galaxies. On the one hand, this effect represents a strong source of noise for all experiments that require a precise measurement of the SZ effect and cluster-induced CMB polarization. On the other hand, it provides a new tool to better investigate the cluster structure. In the following we discuss these two aspects.
4.1 Bulk gas motion as a possible source of noise
Peculiar velocities of galaxy clusters
are an important cosmological
tool since they can be connected with the velocity field of
density perturbations (see e.g Chiu et al. 1998, Colberg et al. 2000,
Sheth & Diaferio 2001).
The kinematic SZ effect is thought to be one of the most promising
mechanisms for measuring these peculiar velocities
(e.g Haehnelt & Tegmark 1996, Holzapfel et al. 1997,
Aghanim et al. 2001).
In a similar way, the measurement of the CMB quadrupole in
different areas of the universe may be the only
way to solve such questions as whether or not we live
in a universe with a particularly low quadrupole or we live in a
universe with a peculiar geometry (Kamionkowski and Loeb 1997)
or we are seeing a possible signature of new physics (e.g Efstathiou 2003,
Cline et al. 2003, Feng & Zhang 2003).
The measurement of the polarization signal
(due to the CMB quadrupole)
in galaxy clusters can also be used as a probe
of the dark energy which would boost the
CMB quadrupole by the integrated Sachs-Wolfe effect
(Cooray & Baumann 2003).
The bulk gas motion can represent a serious issue
for all the proposed cosmological studies devoted
to measuring the peculiar velocities of galaxy clusters
including kinetic SZ and/or local CMB quadrupole
measurements from polarization.
In the case of the kinetic SZ, this problem is solved if one assumes that
the total signal is still proportional to the total average momentum of the cluster.
These studies can be also affected
by other secondary effects such as the
kinetic SZ effect and polarization associated with cluster rotation
(Chluba & Mannheim 2002).
A way to circumvent this
problem is by using data from high-resolution,
high-sensitivity experiments which can
disentangle the central from the external signal or by means of
multifrequency observations
which could disentangle the kinetic polarization term from the
contribution due to the scattering of the CMB quadrupole.
An estimate of the cluster velocity after averaging over the
kinetic SZ map can
produce unbiased estimates of the peculiar cluster velocity
with a dispersion of
50-100 km s-1 when the velocities are averaged over an
aperture at least as large
as the virial radius (Nagai et al. 2003).
Also, averaging the polarization measurements toward galaxy
clusters in a region
of the sky would help to reduce the contribution from the kinetic
polarization term
(Cooray & Baumann 2003). However, the number of clusters which
need to be averaged
will depend on the dispersion of the kinetic polarization term.
The effect studied in this
Letter will increase this dispersion.
4.2 A powerful new galaxy cluster investigation tool
One interesting aspect of the kinetic SZ effect and the CMB polarization
is that while the first depends on the radial component of the
velocity, the latter depends on the tangential component.
Obviously the two measurements are complementary and can in principle
allow us to fully reconstruct the 3D velocity vector.
However, the signal we observe is a combination
of the signal associated with the moving gas cloud and the cluster itself.
Thus, the gas cloud velocity 3D reconstruction
depends on the actual cluster and gas cloud density profile.
A steeper profile will show
more contrast between the central and
external parts of the cluster while a shallower profile will show a
smoother gradient
in both the kinetic SZ and polarization 2D data.
Fortunately, information
about the optical depth can be easily obtained combining the thermal SZ
effect () with the temperature information obtained
from X-rays observations.
Furthermore, the X-ray observations of the possible
cold front associated with a moving cloud will give us
the absolute velocity of the gas cloud.
This is a good example of how multi-wavelength observations of the same object
can be used to reconstruct its 3D structure.
In conclusion, it is clear that, future experiments
having capabilities to measure the kinetic SZ effect and/or
polarization of CMB photons induced by galaxy clusters with high
spatial resolution will open new and exciting
windows for the studies of galaxy cluster dynamics.
References
- (1)
- (2) Aghanim N., Górski K.M., Puget J.L. 2001, A&A, 374, 1.
- (3)
- (4) Chiu, W.A., Ostriker J.P., Strauss M.A. 1998, ApJ, 494, 479.
- (5)
- (6) Chluba J., Mannheim K., 2002, astro-ph/0208392.
- (7)
- (8) Cline J.M., Crotty P., Lesgourgues J., 2003, astro-ph/0304558.
- (9)
- (10) Cooray A., Baumann D., 2003, PRD, 67, 063505.
- (11)
- (12) Colberg J.M., White S.D.M., MacFarland T.J., Jenkins A., Pearce F.R., Frenk C.S., Thomas P.A., Couchman H.M.P., 2000, MNRAS, 313, 229.
- (13)
- (14) Efstathiou G., 2003, MNRAS submitted. astro-ph/0303127
- (15)
- (16) Feng B., Zhang X., 2003. astro-ph/0305020
- (17)
- (18) Holzapfel W.L., Ade P.A.R., Church S.E., Mauskopf P.D., Rephaeli Y., Wilbanks T.M., Lange A.E., 1997, ApJ, 481, 35.
- (19)
- (20) Haehnelt M.G., Tegmark M. 1996, MNRAS, 279, 545.
- (21)
- (22) Jones, C. & Forman, W. 1999, ApJ, 511, 65
- (23)
- (24) Kamionkoski, M. and Loeb, A. 1997, PRD, 56, 4511.
- (25)
- (26) Markevitch, M. et al. 2000, ApJ, 541, 542
- (27)
- (28) Markevitch, M., Vikhlinin, A., & Mazzotta, P. 2001, ApJ, 562, L153
- (29)
- (30) Markevitch, M., Gonzalez, A. H., David, L., Vikhlinin, A., Murray, S., Forman, W., Jones, C., & Tucker, W. 2002, ApJ, 567, L27
- (31)
- (32) Markevitch, M. Vikhlinin, A., Forman W.R. 2002, Conference proceedings, Taiwan, ASP Conference Series, in press, (astro-ph/0208208)
- (33)
- (34) Mazzotta, P., Markevitch, M., Vikhlinin, A., Forman, W. R., David, L. P., & VanSpeybroeck, L. 2001, ApJ, 555, 205
- (35)
- (36) Mazzotta, P., Edge, A., Markevitch, M. 2003, ApJ, in press, (astro-ph/0303314)
- (37)
- (38) Nagai D., Kravtsov A.V., Kososwsky A., 2003, ApJ, 587, 524.
- (39)
- (40) Polnarev A.G., 1985, Soviet Astronomy, 29, 607.
- (41)
- (42) Rees M., 1968, ApJ, 153, L1.
- (43)
- (44) Sazanov S.Y., Sunyaev R.A., 1999, MNRAS, 310, 765.
- (45)
- (46) Sheth R.K. & Diaferio A., 2001, MNRAS, 322, 901.
- (47)
- (48) Sunyaev R.A., Zel’dovich Ya, B., 1972, A&A, 20, 189.
- (49)
- (50) Vikhlinin, A., Markevitch, M., & Murray, S. S. 2001, ApJ, 551, 160
- (51)
- (52) Zel’dovich Y.B., Sunyaev, R.A., 1980, Astron. Lett., 6, 285.
- (53)