Combined Long and Short Timescale X-ray Variability of NGC 4051 with RXTE and XMM-Newton
Abstract
We present a comprehensive examination of the X-ray variability of the narrow line Seyfert 1 (NLS1) galaxy NGC 4051. We combine over 6.5 years of frequent monitoring observations by RXTE with a ks continuous observation by XMM-Newton and so present a powerspectral density (PSD) covering an unprecedent frequency range of over 6.5 decades from to Hz. The combined RXTE and XMM-Newton PSD is a very good match to the PSD of the galactic black hole binary system (GBH) Cyg X-1 when in a ‘high’, rather than ‘low’, state providing the first definite confirmation of an AGN in a ‘high’ state.
We find a break in the PSD at a frequency Hz. If scales linearly with mass then, assuming a black hole (BH) mass of for Cyg X-1, we imply a BH mass of in NGC 4051, which is consistent with the recently reported reverberation value of . Hence NGC 4051 is emitting at .
We note that the higher energy photons lag the lower energy ones and that the lag is greater for variations of longer Fourier period and increases with the energy separation of the bands. Variations in different wavebands are very coherent at long Fourier periods but the coherence decreases at shorter periods and as the energy separation between bands increases. This behaviour is similar to that of GBHs and suggests a radial distribution of frequencies and photon energies with higher energies and higher frequencies being associated with smaller radii.
It is not possible to fit all AGN to the same linear scaling of break timescale with black hole mass. Broad line AGN are consistent with a linear scaling of break timescale with mass from Cyg X-1 in its low state but NLS1 galaxies scale better with Cyg X-1 in its high state. We suggest that the relationship between black hole mass and break timescale is a function of another underlying parameter which may be accretion rate.
1 INTRODUCTION
Early observations with EXOSAT, coupled with some archival data, indicated a similarity between the powerspectral densities (PSDs) of AGN and galactic black hole X-ray binary systems (GBHs). Both types of PSD were steep at high frequencies and flattened, below a break or ‘knee’ frequency [10]. Early indications were that the break timescale scaled with black hole mass but the long timescale (weeks - years) X-ray lightcurves of AGN were not of adequate quality to properly determine the break timescales. However since the launch of the Rossi X-ray Timing Explorer (RXTE; [18]) in December 1995 we have been able to obtain excellent long timescale AGN lightcurves, and PSDs, and evidence is building for a correlation between black hole mass and break timescale (eg [11, 3, 8]).
GBHs, however, are found in at least two states: the low flux, hard spectrum (‘low’) state and the high flux, soft spectrum (‘high’) state (eg [9, 13, 2]). The PSDs of these two states are different. At high frequencies both PSDs have slopes of . Below a break frequency (Hz for the low state and Hz for the high state) the PSDs both flatten to a slope of -1. In the high state there is no other observable slope change but in the low state the PSD flattens further (below Hz) to a slope of zero. It had been thought, based on the similarity of their energy spectra, that AGN were the analogues of GBHs in their low state. However, by combining RXTE and XMM-Newton observations, we show that NGC4051 is the analogue of a high state GBH. The PSD we present of NGC4051 is the best PSD yet produced for an AGN. In this paper we consider the implications of our result for the understanding of the similarity between AGN and GBHs. We also examine the variation, with energy, of the high frequency PSD slope and the coherence of the X-ray emission, and draw conclusions regarding the geometry of the emitting region and the origin of theblack holemass/break timescale relationship.
2 OBSERVATIONS
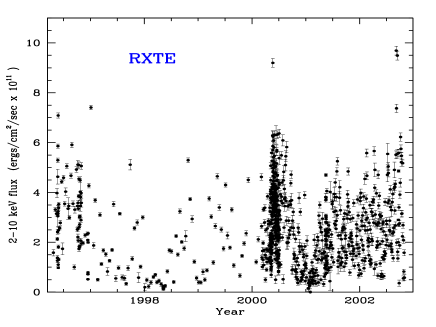
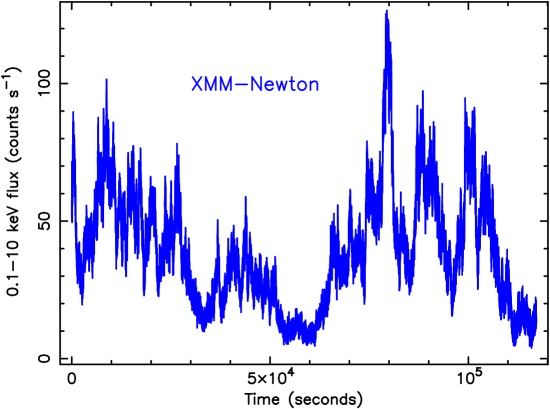
In Fig. 1 we present all of the short (1 ks duration) monitoring observations of NGC 4051 which have been carried out with the proportional counter array (PCA, [26]) on RXTE from 1996 until 2002 inclusive. In Fig. 2 we present the full-band XMM-Newton lightcurve obtained from a continuous observation over the 16th and 17th May 2001. The lightcurve is the sum of data from the PN and MOS detectors. We refer readers to [12] for details of the analysis of the RXTE and XMM-Newton data.
3 POWERSPECTRAL ANALYSIS
3.1 Combined RXTE and XMM-Newton PSD
Powerspectral analysis of the continuous XMM-Newton lightcurves is straighforward but analysis of the RXTE lightcurves is more difficult as they consist of many short observations with a variety of sampling patterns in order to cover different Fourier periods. Since early 2000 we have had observations approximately once every 2 days, and we have had a period (mid 2000) of 2 months where we observed every 6 hours. However prior to 2000 the observations were less frequent. To cope with the distortions which the sampling pattern introduces into the PSD, we employ a simulation-based modelling technique [21]. We are able to incorporate the XMM-Newton observations into our modelling. We again refer to [12] for details. Below (Section 3.2) we show that is independent of energy and so here we use the 0.1-2 keV XMM-Newton data which shows the break most clearly.
A simple powerlaw, although a reasonable fit to the low frequency RXTE PSD on its own, is a very poor fit to the combined RXTE and XMM-Newton PSD. The best fit (Fig 3) is to a bending powerlaw [12] where the PSD changes smoothly from a slope of below, to a slope of above Hz. Note particularly the lack of a second break, about a decade below , which is characteristic of a low state GBH.

In order to provide a good template for comparison we present, in Fig 4, the PSD of the GBH Cyg X-1 in its high state. It is fitted very well by the same bending powerlaw model which fits Fig 3. We therefore conclude that NGC 4051 is the first AGN confirmed to be in a ‘high’ state.
In Cyg X-1 (Fig 4) Hz. If scales linearly with mass then, assuming a black hole mass of for Cyg X-1 [5], we imply a black hole mass of in NGC 4051, which is consistent with the recently reported reverberation value of [17]. Hence NGC 4051 is emitting at .

3.2 Variation of high frequency XMM-Newton PSD with energy
We made PSDs of NGC 4051 in a number of different XMM-Newton wavebands. All PSDs showed a break at Hz and had similar slopes below . As the PSD slope below in Cyg X-1 in the high state is also independent of energy [2] we fixed at -1.1, the best fit value from Fig 3. Further fitting confirmed the invariance of with energy but showed a systematic flattening of with increasing energy (Fig 5). Similar behaviour is seen in MCG-6-30-15 [23].
Flattening of the PSD with increasing energy at high frequency is seen in Cyg X-1 in the low state [13]. In the generally accepted Compton scattering scenario for the production of X-rays the flattening is generally interpreted as arising from variations in the scattering corona as the increased scattering necessary to raise photons to higher energies would wash out variations from the seed photons.

4 THE RMS-FLUX RELATIONSHIP
Uttley and McHardy [20] showed that the amplitude of absolute rms variability in small segments of the X-ray lightcurves of GBHs scaled remarkably linearly with the mean flux of the segments. They also showed that the variability amplitude in RXTE lightcurves of Seyfert galaxies increased with X-ray flux, but could not tell if the relationship was really linear. Subsequently, better quality lightcurves have provided stronger evidence of a linear rms-flux relation in AGN [4, 23].
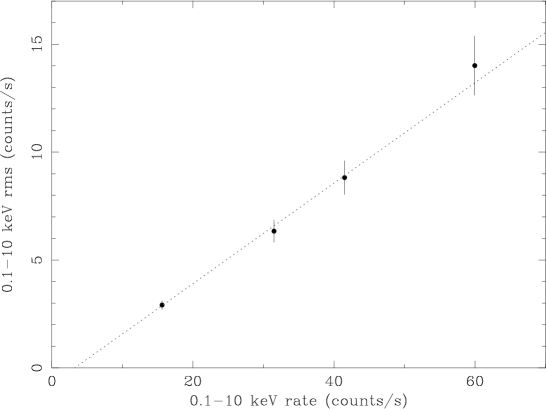
We measured the mean flux and the noise-subtracted variance of 39 separate segments, of duration 2560-s, of the 5-s binned 0.1-10 keV XMM-Newton NGC 4051 lightcurve. We then averaged the variance in 4 flux bins and took the square root to determine the rms (Fig. 6). We note a strong linear rms-flux relationship, similar to that seen in GBHs, indicating a strong similarity in the process driving the variability.
5 TIME LAGS AND COHERENCE
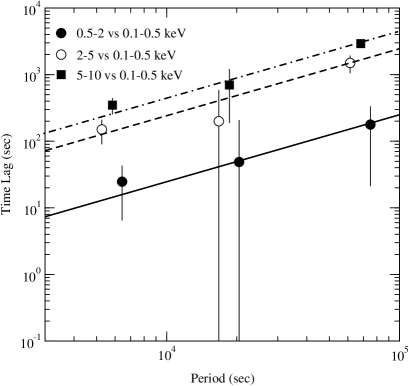
Measurements of ‘time lags’ and ‘coherence’ between different wavebands provide a strong diagnostic of the geometry of the emission region (eg [22, 6] and Section 6.1). Here, for each waveband, we split the lightcurve into its Fourier components and measure the lag between variations in different bands, as a function of Fourier period. The results are shown in Fig 7. The hard band always lags the soft band and the lag increases with increasing Fourier period and with increasing energy separation of the bands (cf [14]).
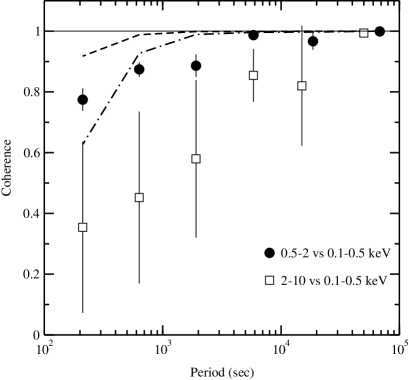
The coherence between two lightcurves, at a certain frequency, may be interpreted as the correlation coefficient between the Fourier components of the two lightcurves at that frequency [16, 22]. For NGC4051 we note (Fig 8) that, even taking account of the artificial decrease in coherence introduced by numerical approximations, the coherence decreases with increasing band separation and with increasing Fourier period.
6 DISCUSSION
6.1 Geometry of the Emission Region
The linear rms-flux relationship tells us that the amplitude of short timescale variations responds to the amplitude of longer timescale variations. This response is explained naturally in the context of the model of Lyubarskii [7] where a characteristic timescale is associated with each radius of the accretion disc, with shorter timescales arising closer to the black hole. Variations propogate inwards and modify the amplitude of shorter timescale variations. If we also associate different photon energies with different locations, with the bulk of the higher energies being produced closer in, we can explain the observations of lags and coherence mentioned earlier.
Churazov et al. [1], with enhancements by Kotov et al. [6], have built a qualitative model along these lines. In the Kotov model variations propogate inwards until they hit the X-ray emitting region, whose emission they modulate. As a larger fraction of the lower energy emission is produced further out in the disc, where characteristic timescales are longer, we expect larger lags with increasing energy separation of the bands and at longer Fourier periods. Regarding the coherence then, if the highest energies are preferentially produced at the innermost radii, those energies see the largest spectrum of variations, including those at the shortest periods. However if the perturbations only propagate inwards then the lower energies do not see the shortest period variations and the coherence then decreases as we go to shorter periods and greater separation of the bands.
6.2 AGN black hole masses and break timescales
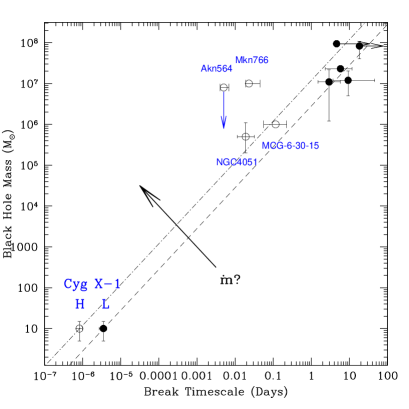
We have gathered data from the literature (eg [8, 21, 15, 23, 24]) and have plotted the timescale at which the PSD breaks from a slope of to a slope of , against the best available value of the black hole mass. This break might be the only break in a high state PSD or it might be the higher frequency break in a low state PSD. For no AGN but NGC 4051 can we be sure which break it is. We also plot the break for Cyg X-1 in its high and low states. We plot broad line AGN with filled circles and NLS1s with open circles. The best fit line to all of the AGN together (not shown) does not go through either state of Cyg X-1.
The data are not sufficient to perform meaningful fits to subsets of the data but we can plot lines of linear scaling through both the high and low states of Cyg X-1. We note that the broad line AGN are consistent with linear scaling from Cyg X-1 in its low state but the NLS1s scale better to the high state. We therefore suggest that some parameter varies between the high and low states in such a way as to move the line of the scaling relationship to shorter timescales for the NLS1s/high state systems. The break timescale in NGC4051 (1250s) corresponds approximately to the viscous or thermal timescale at few (cf [19]). In GBHs the inner edge of the accretion disc moves inwards as the accretion rate increases (eg [9]). If the break timescale is therefore associated with the inner edge of the accretion disc, the parameter which moves the position of the mass-timescale scaling relationship might well be the accretion rate, .
References
- [1] Churazov E., Gilfanov M., Revnivtsev M., 2001, MNRAS, 321, 759
- [2] Cui W., et al. 1997b, ApJ, 474, L57
- [3] Edelson R. Nandra K., 1999, ApJ, 514, 682
- [4] Edelson R., et al. 2002, ApJ, 568, 610
- [5] Hererro A., et al. 1995, A&A, 297, 556
- [6] Kotov O., Churazov E., Gilfanov M., 2001, MNRAS, 327, 799
- [7] Lyubarskii Y.E., 1997, MNRAS, 292, 679
- [8] Markowicz, A. et al. , 2003, ApJ (in press), astro-ph/0303273
- [9] McClintock J.E., Remillard R.A., 2003, astro-ph/0306213
- [10] McHardy I.M., 1988, Mem. It. Astr. Soc., 59, 239
- [11] McHardy I.M., Papadakis I.E., Uttley P., 1998, Nuc. Phys B, 69, 509
- [12] McHardy I.M., Papadakis I.E., Uttley P., Page, M., Mason, K., 2003, MNRAS, in press.
- [13] Nowak M.A., Vaughan B.A., Wilms J., Dove J.B., Begelman M.C., 1999, ApJ 510, 874
- [14] Papadakis I.E., Nandra K., Kazanas D., 2001, ApJ, 554, 133
- [15] Papadakis I.E., Brinkman W., Negoro H. Gliozzi M., 2002, A&A, 382, L1
- [16] Priestley M.B., 1981, ”Spectral Analysis and Time Series”, Academic Press, London
- [17] Shemmer O., Uttley P., Netzer H., McHardy I.M., 2003, astro-ph/0305129.
- [18] Swank J., 1998, Nuc. Phys. B., 69, 12.
- [19] Treves A., Maraschi L., Abramowicz, M., 1988, PASP, 100, 427
- [20] Uttley P., McHardy I.M., 2001, MNRAS, 323, L26
- [21] Uttley P., McHardy I.M., Papadakis I.E., 2002, MNRAS, 332,231
- [22] Vaughan B.A., Nowak M.A., 1997, ApJ, 474, L43
- [23] Vaughan S., Fabian A.C. Nandra K., 2003, MNRAS, 339, 1237
- [24] Vaughan S., Fabian A.C., 2003, MNRAS, 341, 496
- [25] Woo J-H., Urry C.M., 2002, ApJ, 579, 530
- [26] Zhang W., et al. 1993, In ‘EUV and X-ray Instrumentation for Astronomy IV’, ed. Siegmund O.H., SPIE, Bellingham WA, p. 324.